| Param | Original file | Final file |
|---|---|---|
| Filename | modeM0/AS1A10_109T01_9000004678_32064cztM0_level2.evt | modeM0/AS1A10_109T01_9000004678_32064cztM0_level2_quad_clean.evt |
| Size (bytes) | 663,212,160 | 85,412,160 |
| Size | 632.5 MB | 81.5 MB |
| Events in quadrant A | 3,494,313 | 565,524 |
| Events in quadrant B | 5,686,963 | 553,037 |
| Events in quadrant C | 4,262,689 | 527,865 |
| Events in quadrant D | 6,209,003 | 492,816 |
| Mode M9 | |||
|---|---|---|---|
| Quadrant | BADHDUFLAG | Total packets | Discarded packets |
| A | 0 | 24 | 0 |
| B | 0 | 25 | 0 |
| C | 0 | 25 | 0 |
| D | 0 | 25 | 0 |
| Mode SS | |||
|---|---|---|---|
| Quadrant | BADHDUFLAG | Total packets | Discarded packets |
| A | 0 | 128 | 0 |
| B | 0 | 128 | 0 |
| C | 0 | 128 | 0 |
| D | 0 | 128 | 0 |
| Mode M0 | |||
|---|---|---|---|
| Quadrant | BADHDUFLAG | Total packets | Discarded packets |
| A | 0 | 13824 | 0 |
| B | 0 | 21127 | 1 |
| C | 0 | 16534 | 0 |
| D | 0 | 22782 | 0 |
| Quadrant | Total seconds | Saturated seconds | Saturation percentage |
|---|---|---|---|
| A | 6418 | 95 | 1.480212% |
| B | 6417 | 282 | 4.394577% |
| C | 6417 | 364 | 5.672433% |
| D | 6417 | 371 | 5.781518% |
Noise dominated data is calculated using 1-second bins in cleaned event files. If a bin has >2000 counts, and if more than 50% of those come from <1% of pixels, then it is considered to be noise-dominated and hence unusable.
| Quadrant | # 1 sec bins | Bins with >0 counts | Bins with >2000 counts | High rate bins dominated by noise | Noise dominated (total time) | Noise dominated (detector-on time) | Marked lightcurve |
|---|---|---|---|---|---|---|---|
| A | 7573 | 6418 | 0 | 0 | 0.00% | 0.00% | 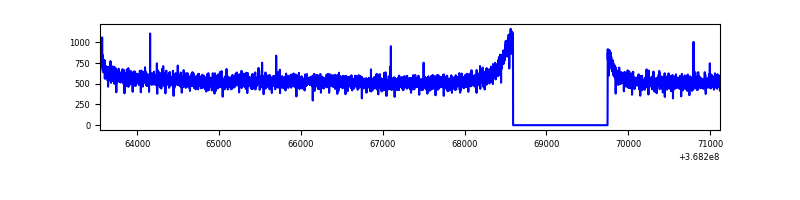 |
| B | 7572 | 6417 | 37 | 37 | 0.49% | 0.58% | 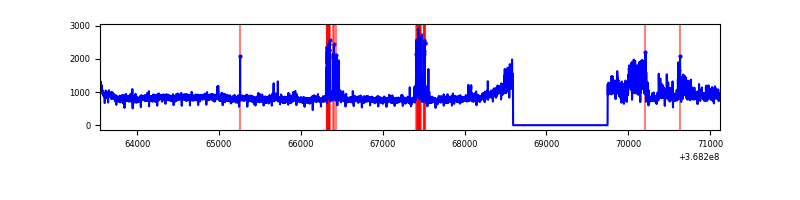 |
| C | 7572 | 6417 | 128 | 128 | 1.69% | 1.99% |  |
| D | 7572 | 6417 | 245 | 245 | 3.24% | 3.82% | 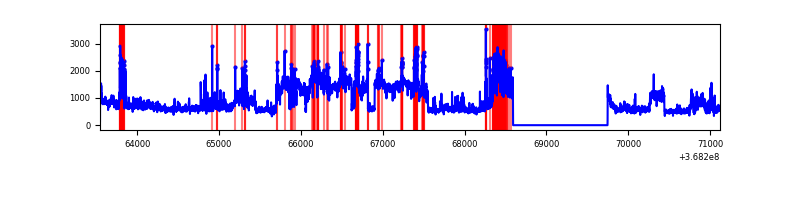 |
Top three noisy pixels from each quadrant. If the there are fewer than three noisy pixels in the level2.evt file, extra rows are filled as -1
| Pixel properties | Quadrant properties | ||||||
|---|---|---|---|---|---|---|---|
| Quadrant | DetID | PixID | Counts | Sigma | Mean | Median | Sigma |
| A | 13 | 254 | 11430 | 58.62 | 906 | 891 | 179.8 |
| A | 3 | 137 | 8366 | 41.58 | 906 | 891 | 179.8 |
| A | 0 | 226 | 7540 | 36.98 | 906 | 891 | 179.8 |
| B | 6 | 159 | 1626758 | 9802.2 | 882 | 865 | 165.9 |
| B | 10 | 245 | 428436 | 2577.74 | 882 | 865 | 165.9 |
| B | 5 | 172 | 145113 | 869.64 | 882 | 865 | 165.9 |
| C | 0 | 10 | 718277 | 3719.14 | 836 | 845 | 192.9 |
| C | 14 | 238 | 154817 | 798.18 | 836 | 845 | 192.9 |
| C | 4 | 175 | 46022 | 234.2 | 836 | 845 | 192.9 |
| D | 12 | 79 | 1801547 | 8910.51 | 847 | 827 | 202.1 |
| D | 8 | 195 | 514116 | 2539.91 | 847 | 827 | 202.1 |
| D | 12 | 233 | 276168 | 1362.47 | 847 | 827 | 202.1 |
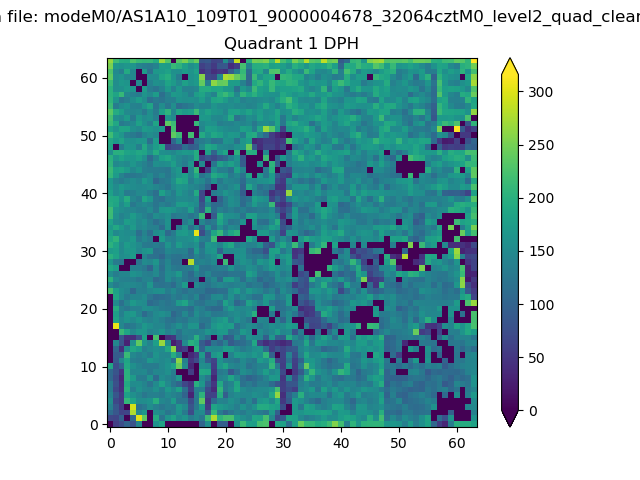
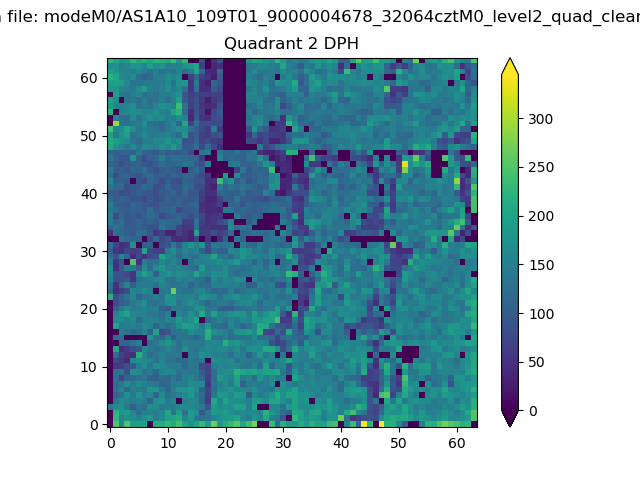
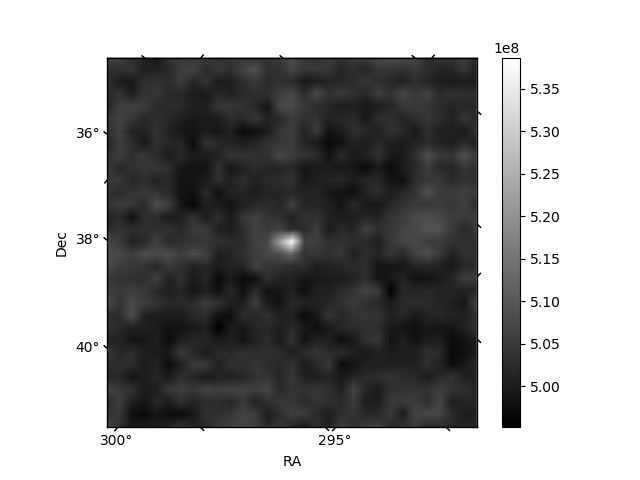
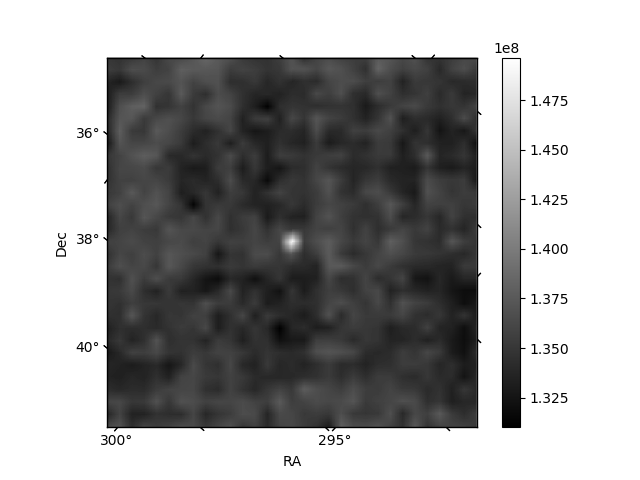
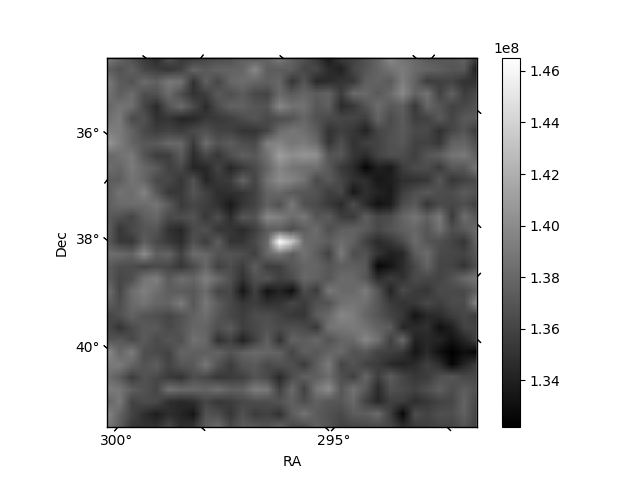
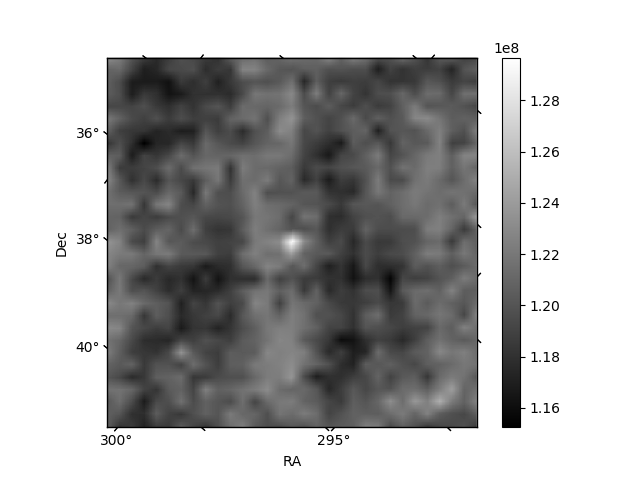
Histogram calculated using DETX and DETY for each event in the final _common_clean file
| Quadrant A | 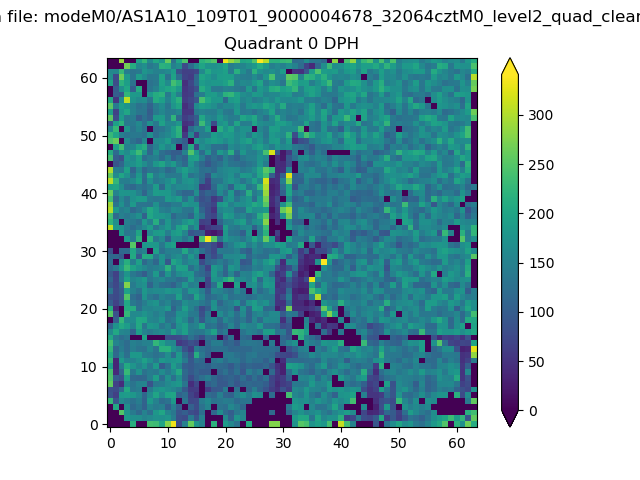 |
 |
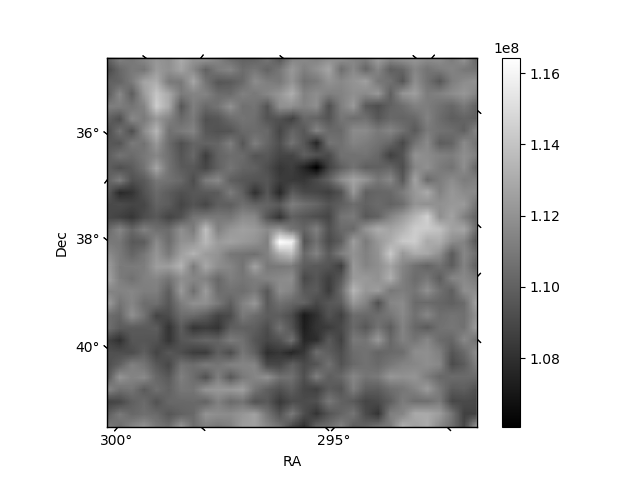
Quadrant B |
|---|---|---|---|
| Quadrant D | 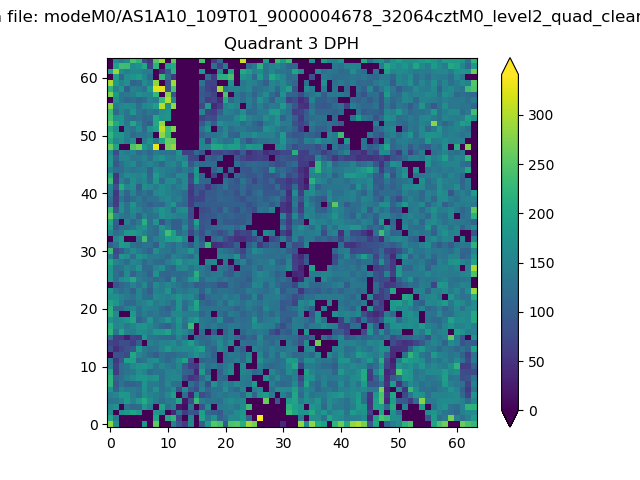 |
 |
Quadrant C |
| Plot type | Count rate plots | Images |
|---|---|---|
| Comparison with Poisson distribution Blue bars denote a histogram of data divided into 1 sec bins. Red curve is a Poisson curve with rate = median count rate of data. |
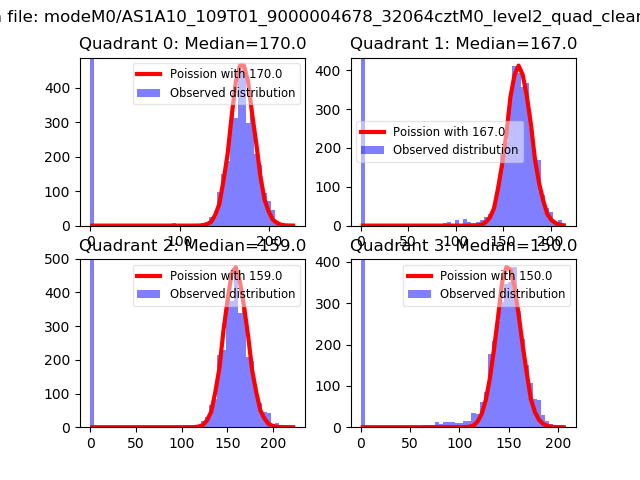 |
 |
| Quadrant-wise count rates Data is divided into 100 sec bins |
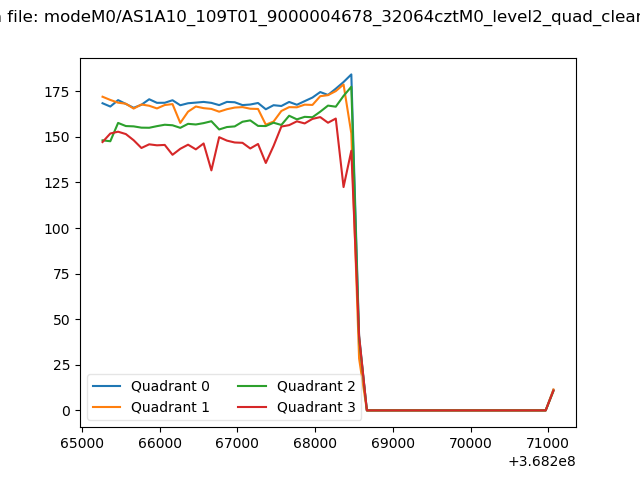 |
|
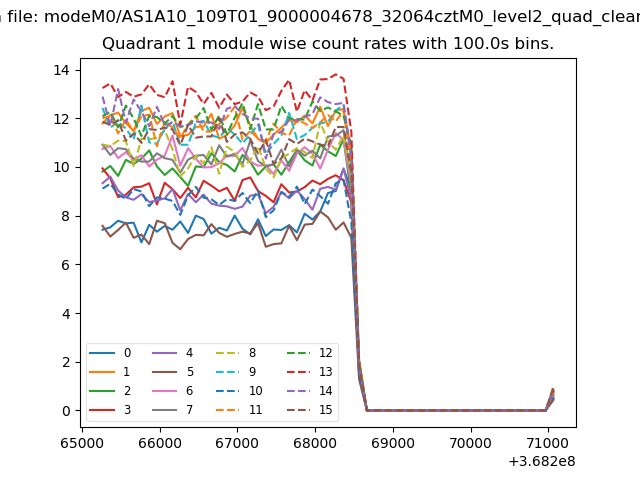
| Module-wise count rates for Quadrant A Data is divided into 100 sec bins |
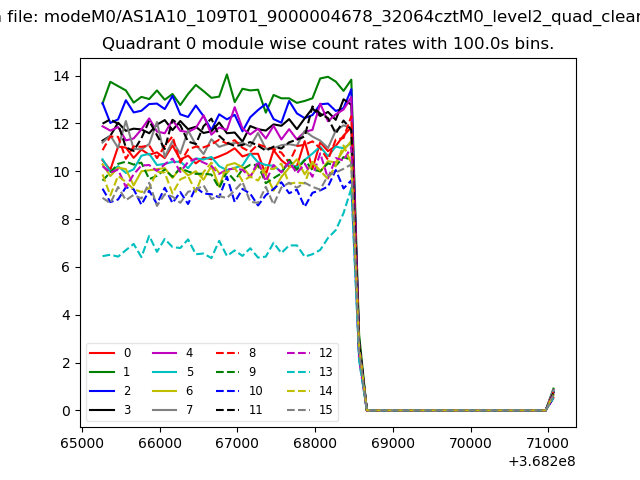 |
 |
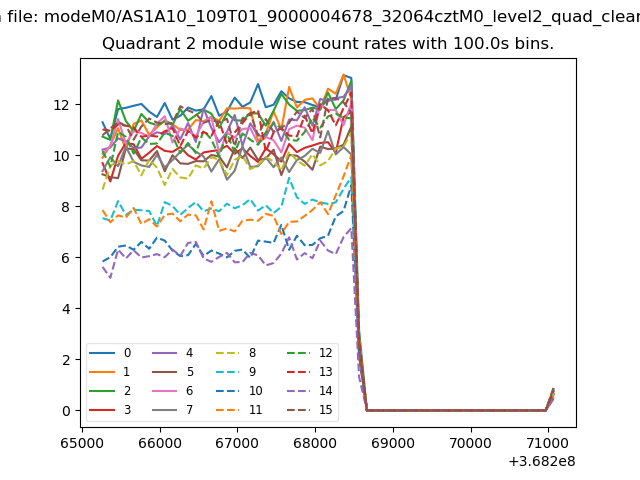
| Module-wise count rates for Quadrant B Data is divided into 100 sec bins |
 |
 |
| Module-wise count rates for Quadrant C Data is divided into 100 sec bins |
 |
 |
| Module-wise count rates for Quadrant D Data is divided into 100 sec bins |
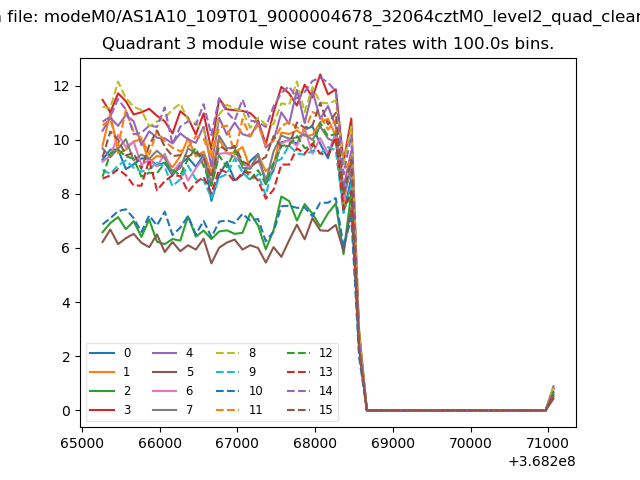 |
 |
| Parameter | Plot |
|---|---|
| CZT HV Monitor | 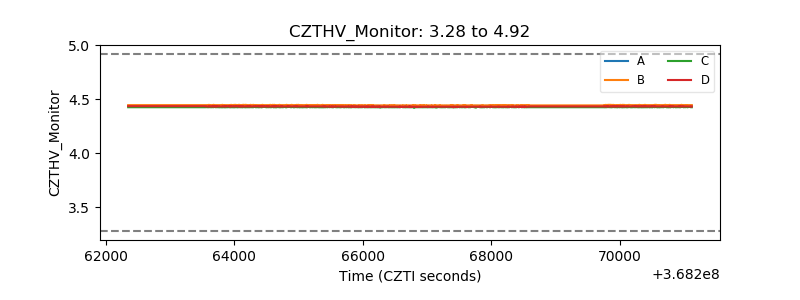 |
| D_VDD | 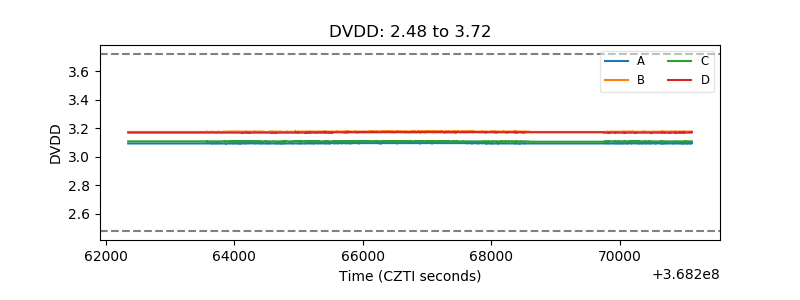 |
| Temperature 1 |  |
| Veto HV Monitor | 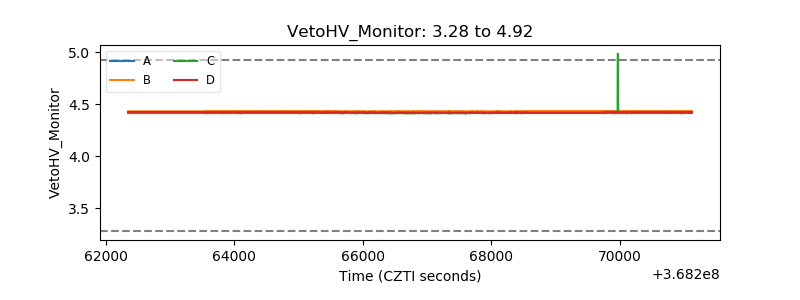 |
| Veto LLD |  |
| Alpha Counter | 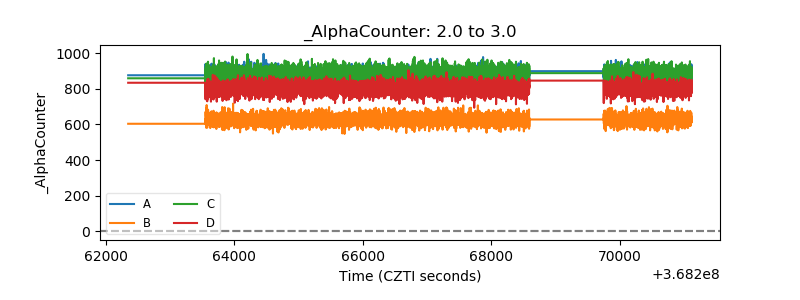 |
| _CPM_Rate | 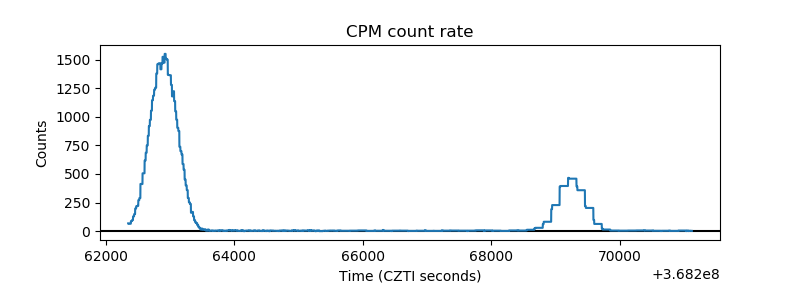 |
| CZT Counter | 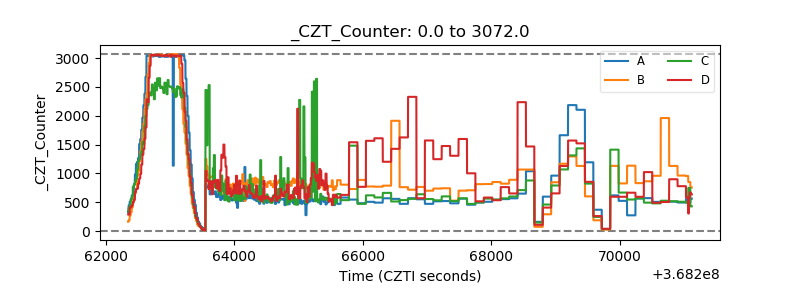 |
| +2.5 Volts monitor |  |
| +5 Volts monitor |  |
| _ROLL_ROT | 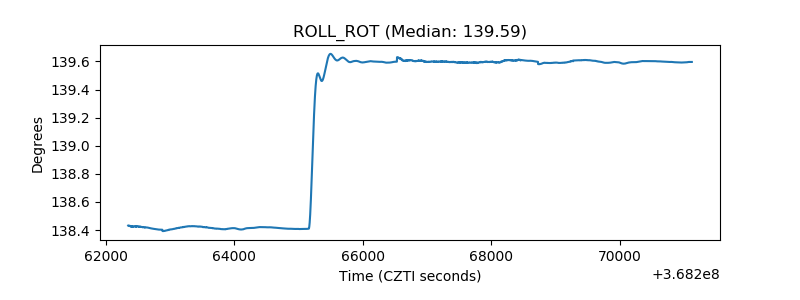 |
| _Roll_DEC | 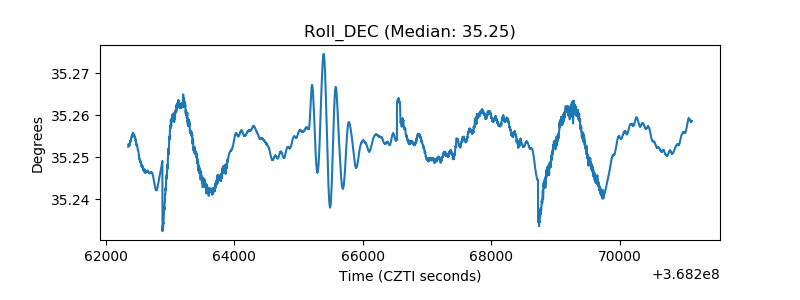 |
| _Roll_RA | 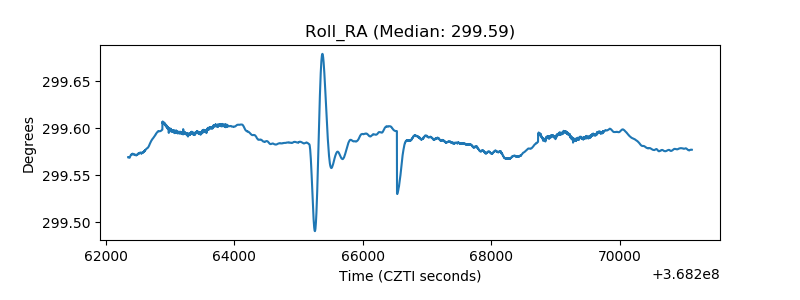 |
| Veto Counter | 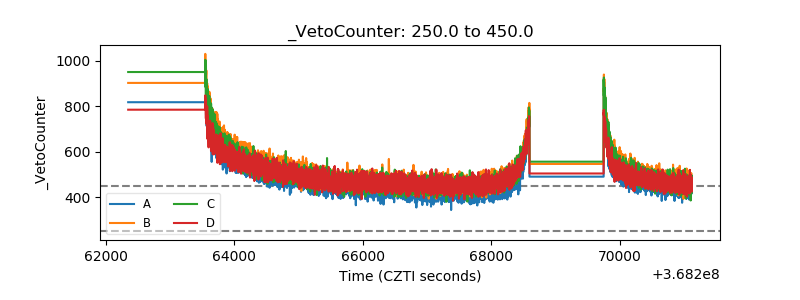 |