| Param | Original file | Final file |
|---|---|---|
| Filename | modeM0/AS1A10_109T01_9000004678_32067cztM0_level2.evt | modeM0/AS1A10_109T01_9000004678_32067cztM0_level2_quad_clean.evt |
| Size (bytes) | 702,501,120 | 115,951,680 |
| Size | 670.0 MB | 110.6 MB |
| Events in quadrant A | 4,046,198 | 773,095 |
| Events in quadrant B | 6,555,680 | 757,756 |
| Events in quadrant C | 4,352,870 | 729,109 |
| Events in quadrant D | 5,788,106 | 704,183 |
| Mode SS | |||
|---|---|---|---|
| Quadrant | BADHDUFLAG | Total packets | Discarded packets |
| A | 0 | 158 | 0 |
| B | 0 | 158 | 0 |
| C | 0 | 158 | 0 |
| D | 0 | 158 | 0 |
| Mode M0 | |||
|---|---|---|---|
| Quadrant | BADHDUFLAG | Total packets | Discarded packets |
| A | 0 | 16717 | 0 |
| B | 0 | 24980 | 0 |
| C | 0 | 17541 | 0 |
| D | 0 | 22338 | 0 |
| Quadrant | Total seconds | Saturated seconds | Saturation percentage |
|---|---|---|---|
| A | 7874 | 220 | 2.794006% |
| B | 7874 | 457 | 5.803912% |
| C | 7874 | 317 | 4.025908% |
| D | 7874 | 330 | 4.191008% |
Noise dominated data is calculated using 1-second bins in cleaned event files. If a bin has >2000 counts, and if more than 50% of those come from <1% of pixels, then it is considered to be noise-dominated and hence unusable.
| Quadrant | # 1 sec bins | Bins with >0 counts | Bins with >2000 counts | High rate bins dominated by noise | Noise dominated (total time) | Noise dominated (detector-on time) | Marked lightcurve |
|---|---|---|---|---|---|---|---|
| A | 7874 | 7874 | 0 | 0 | 0.00% | 0.00% | 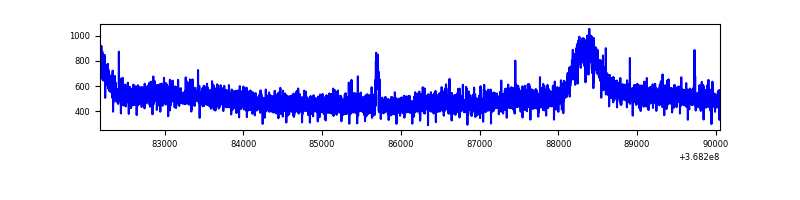 |
| B | 7874 | 7874 | 58 | 58 | 0.74% | 0.74% | 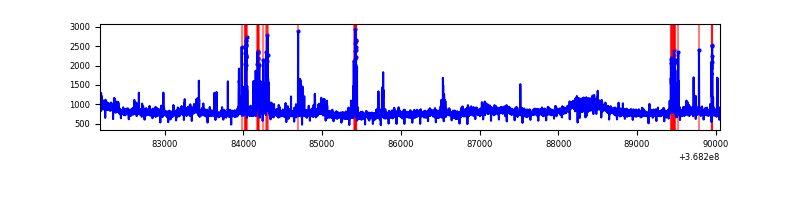 |
| C | 7874 | 7874 | 15 | 15 | 0.19% | 0.19% | 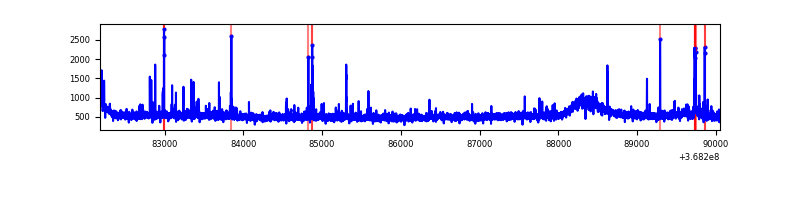 |
| D | 7874 | 7874 | 214 | 214 | 2.72% | 2.72% | 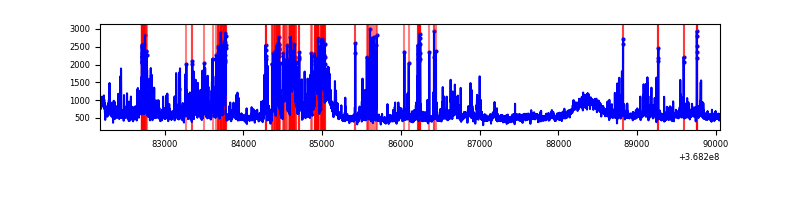 |
Top three noisy pixels from each quadrant. If the there are fewer than three noisy pixels in the level2.evt file, extra rows are filled as -1
| Pixel properties | Quadrant properties | ||||||
|---|---|---|---|---|---|---|---|
| Quadrant | DetID | PixID | Counts | Sigma | Mean | Median | Sigma |
| A | 15 | 174 | 15328 | 68.29 | 1043 | 1020 | 209.5 |
| A | 13 | 254 | 14837 | 65.95 | 1043 | 1020 | 209.5 |
| A | 3 | 137 | 10566 | 45.56 | 1043 | 1020 | 209.5 |
| B | 6 | 159 | 2057711 | 10497.02 | 1013 | 987 | 195.9 |
| B | 5 | 172 | 267210 | 1358.73 | 1013 | 987 | 195.9 |
| B | 10 | 245 | 141185 | 715.53 | 1013 | 987 | 195.9 |
| C | 0 | 10 | 182131 | 775.1 | 991 | 1001 | 233.7 |
| C | 14 | 238 | 161550 | 687.03 | 991 | 1001 | 233.7 |
| C | 12 | 249 | 53332 | 223.94 | 991 | 1001 | 233.7 |
| D | 12 | 227 | 896080 | 3717.73 | 1001 | 976 | 240.8 |
| D | 12 | 218 | 400693 | 1660.19 | 1001 | 976 | 240.8 |
| D | 8 | 195 | 322397 | 1334.99 | 1001 | 976 | 240.8 |
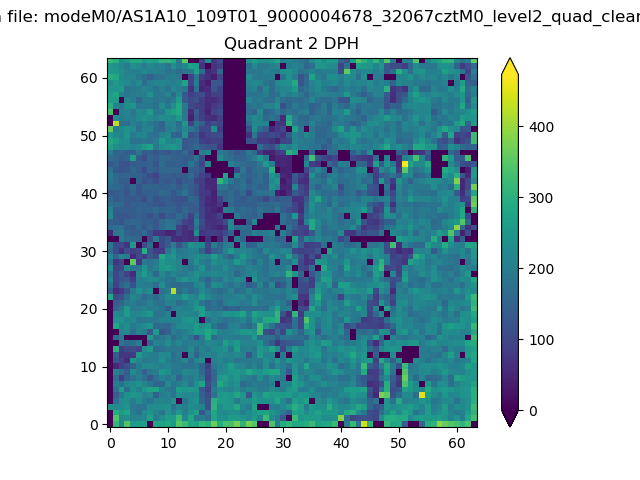
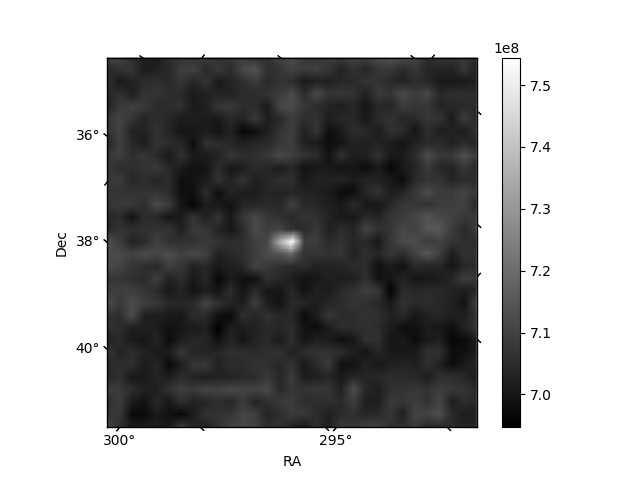
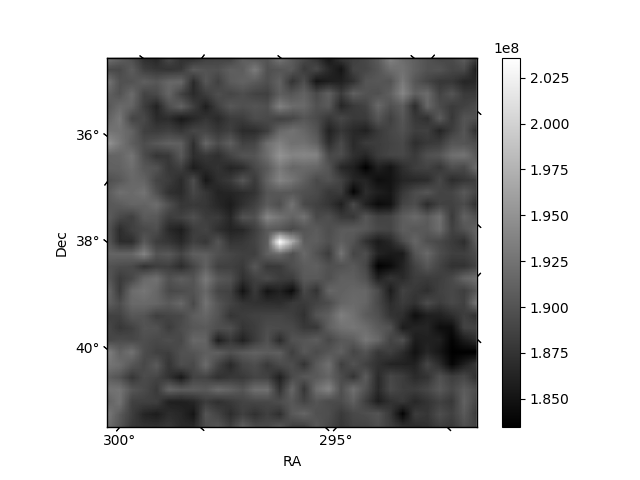
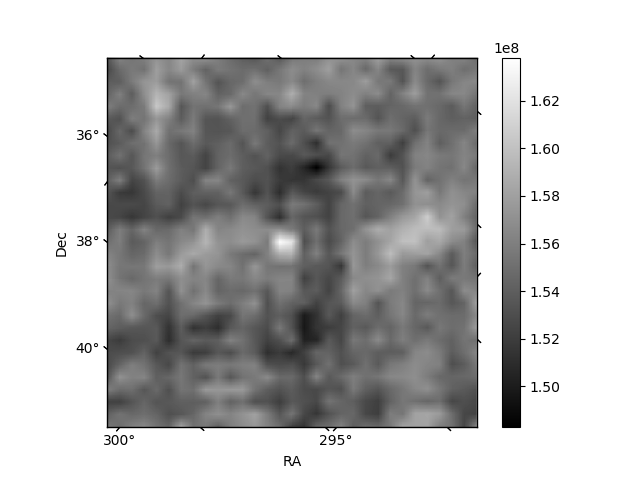
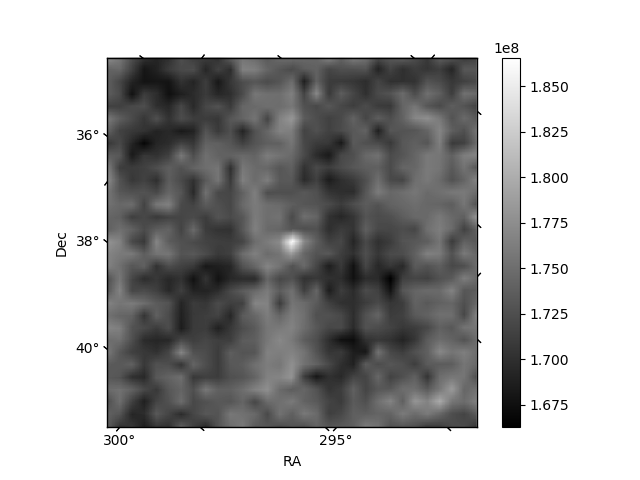
Histogram calculated using DETX and DETY for each event in the final _common_clean file
| Quadrant A | 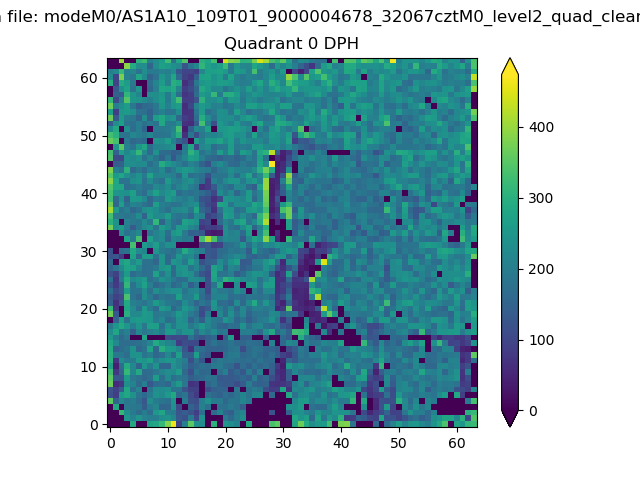 |
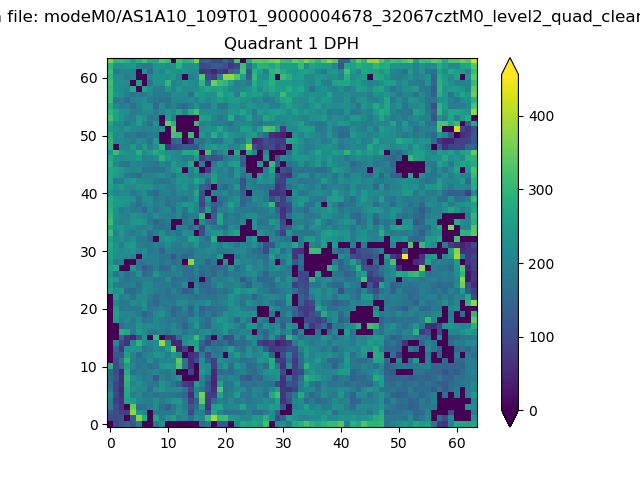 |
Quadrant B |
|---|---|---|---|
| Quadrant D | 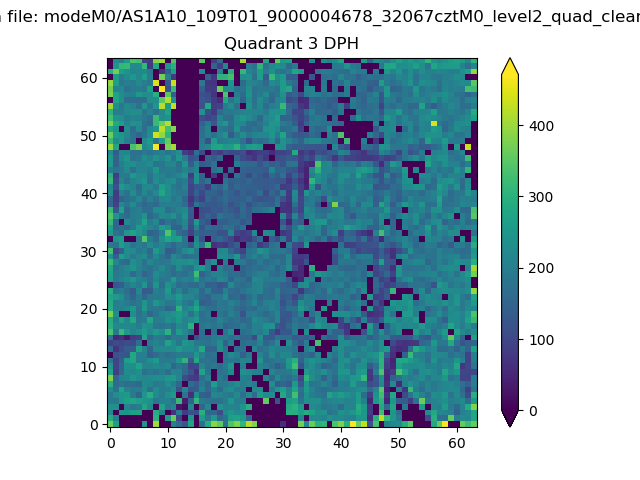 |
 |
Quadrant C |
| Plot type | Count rate plots | Images |
|---|---|---|
| Comparison with Poisson distribution Blue bars denote a histogram of data divided into 1 sec bins. Red curve is a Poisson curve with rate = median count rate of data. |
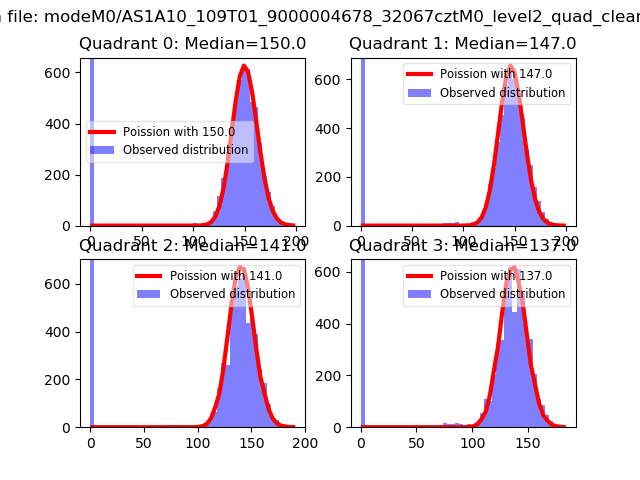 |
 |
| Quadrant-wise count rates Data is divided into 100 sec bins |
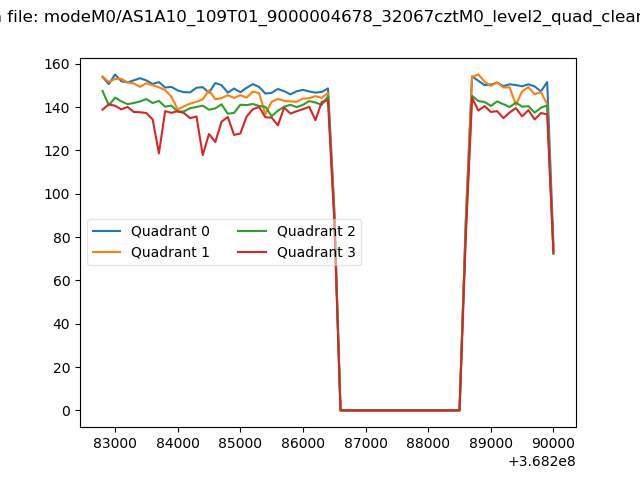 |
|
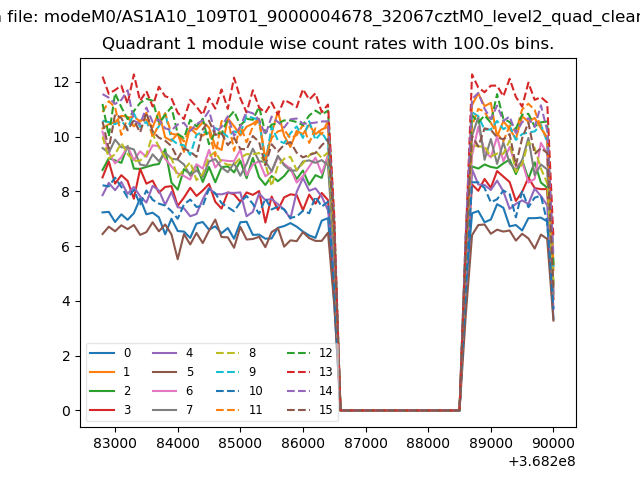
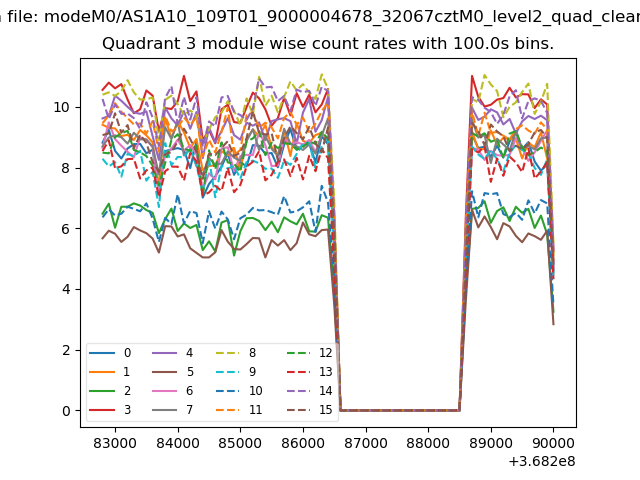
| Module-wise count rates for Quadrant A Data is divided into 100 sec bins |
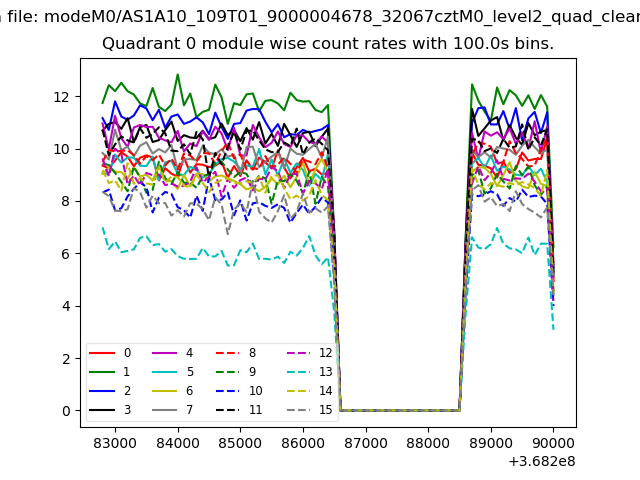 |
 |
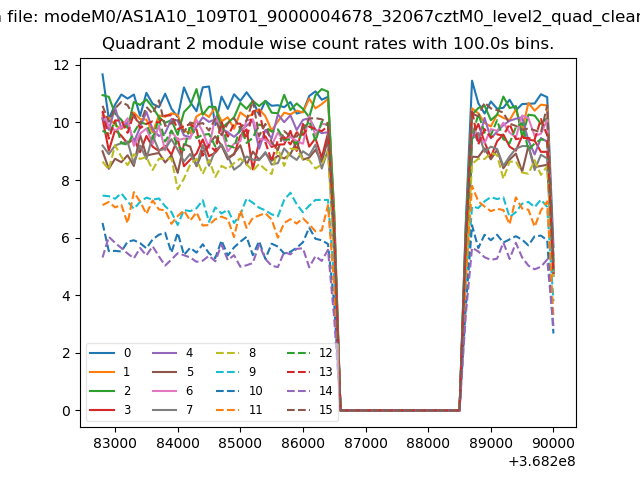
| Module-wise count rates for Quadrant B Data is divided into 100 sec bins |
 |
 |
| Module-wise count rates for Quadrant C Data is divided into 100 sec bins |
 |
 |
| Module-wise count rates for Quadrant D Data is divided into 100 sec bins |
 |
 |
| Parameter | Plot |
|---|---|
| CZT HV Monitor | 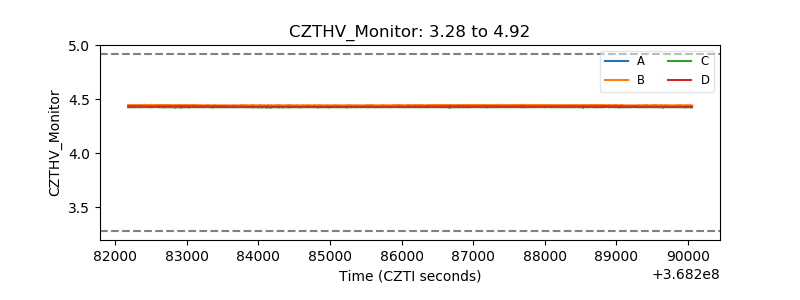 |
| D_VDD | 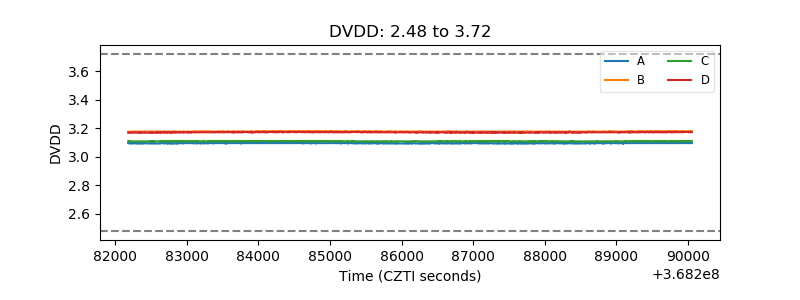 |
| Temperature 1 | 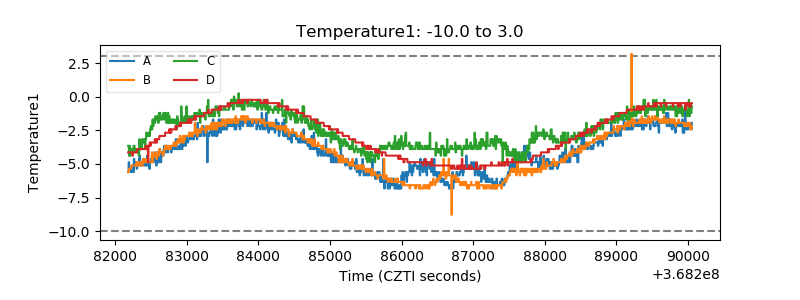 |
| Veto HV Monitor | 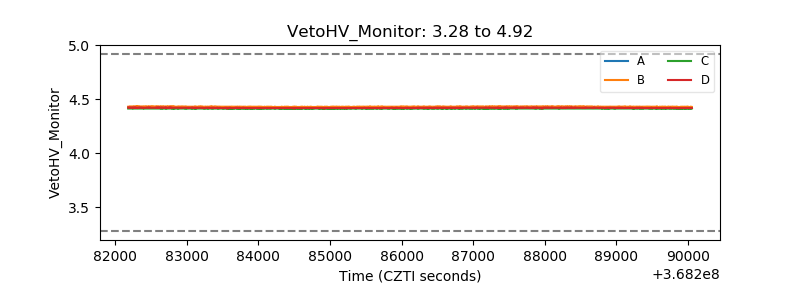 |
| Veto LLD |  |
| Alpha Counter | 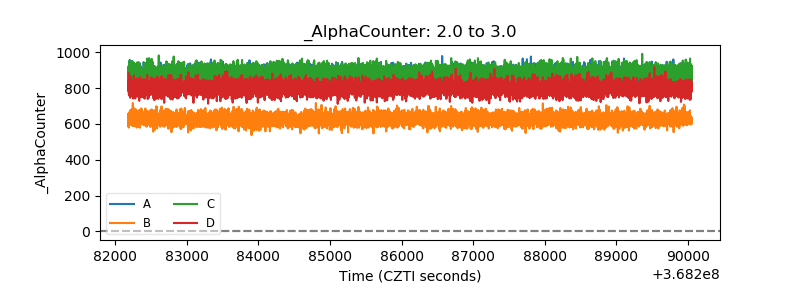 |
| _CPM_Rate | 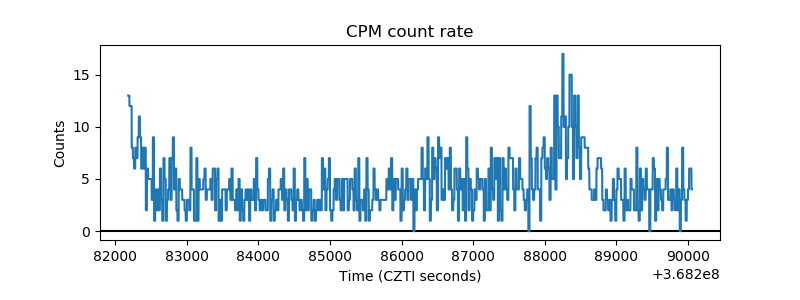 |
| CZT Counter | 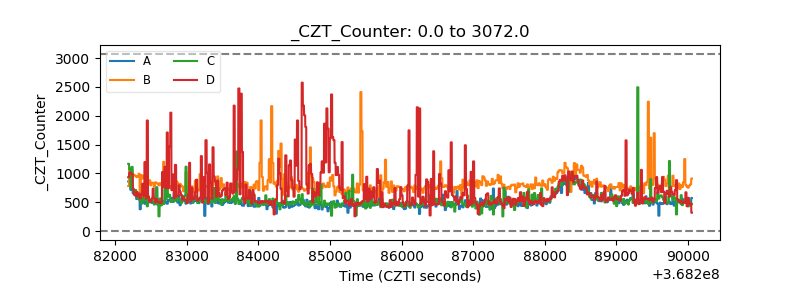 |
| +2.5 Volts monitor |  |
| +5 Volts monitor |  |
| _ROLL_ROT | 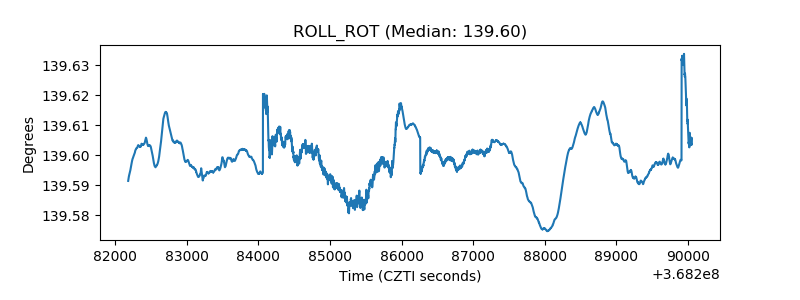 |
| _Roll_DEC | 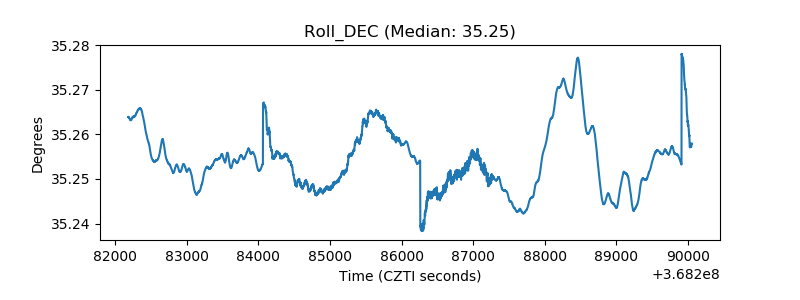 |
| _Roll_RA | 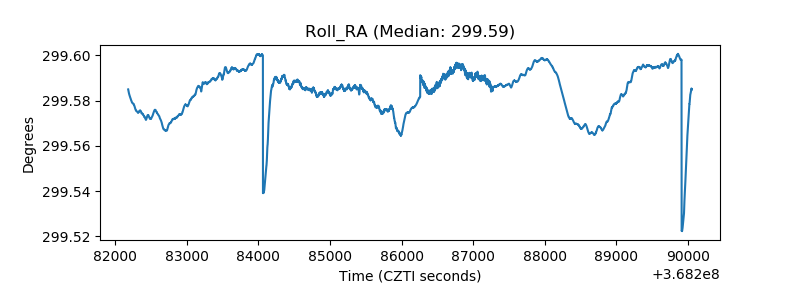 |
| Veto Counter | 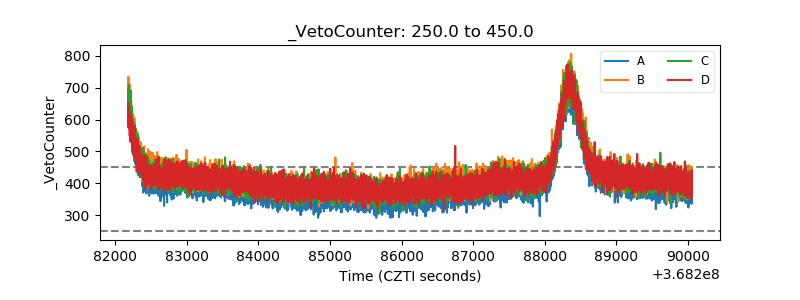 |