| Param | Original file | Final file |
|---|---|---|
| Filename | modeM0/AS1A10_109T01_9000004678_32071cztM0_level2.evt | modeM0/AS1A10_109T01_9000004678_32071cztM0_level2_quad_clean.evt |
| Size (bytes) | 672,782,400 | 104,302,080 |
| Size | 641.6 MB | 99.5 MB |
| Events in quadrant A | 3,284,504 | 706,764 |
| Events in quadrant B | 5,447,421 | 696,768 |
| Events in quadrant C | 5,220,377 | 647,612 |
| Events in quadrant D | 5,965,375 | 634,989 |
| Mode M9 | |||
|---|---|---|---|
| Quadrant | BADHDUFLAG | Total packets | Discarded packets |
| A | 0 | 10 | 0 |
| B | 0 | 11 | 0 |
| C | 0 | 11 | 0 |
| D | 0 | 11 | 0 |
| Mode SS | |||
|---|---|---|---|
| Quadrant | BADHDUFLAG | Total packets | Discarded packets |
| A | 0 | 138 | 0 |
| B | 0 | 138 | 0 |
| C | 0 | 136 | 0 |
| D | 0 | 136 | 0 |
| Mode M0 | |||
|---|---|---|---|
| Quadrant | BADHDUFLAG | Total packets | Discarded packets |
| A | 0 | 14122 | 2 |
| B | 0 | 21014 | 2 |
| C | 0 | 20101 | 2 |
| D | 0 | 22588 | 2 |
| Quadrant | Total seconds | Saturated seconds | Saturation percentage |
|---|---|---|---|
| A | 6784 | 30 | 0.442217% |
| B | 6784 | 117 | 1.724646% |
| C | 6783 | 517 | 7.621996% |
| D | 6783 | 255 | 3.759398% |
Noise dominated data is calculated using 1-second bins in cleaned event files. If a bin has >2000 counts, and if more than 50% of those come from <1% of pixels, then it is considered to be noise-dominated and hence unusable.
| Quadrant | # 1 sec bins | Bins with >0 counts | Bins with >2000 counts | High rate bins dominated by noise | Noise dominated (total time) | Noise dominated (detector-on time) | Marked lightcurve |
|---|---|---|---|---|---|---|---|
| A | 7674 | 6784 | 0 | 0 | 0.00% | 0.00% | 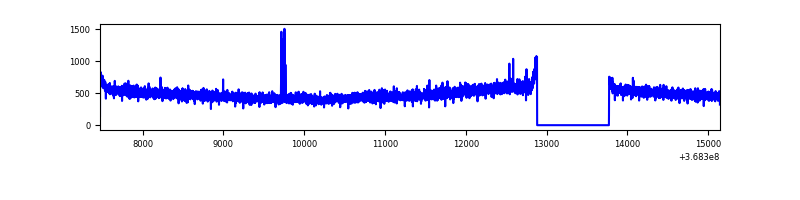 |
| B | 7674 | 6784 | 22 | 22 | 0.29% | 0.32% | 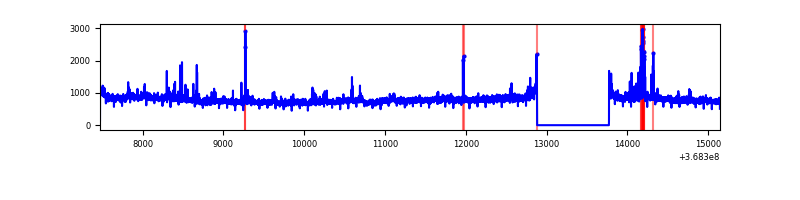 |
| C | 7673 | 6783 | 213 | 213 | 2.78% | 3.14% | 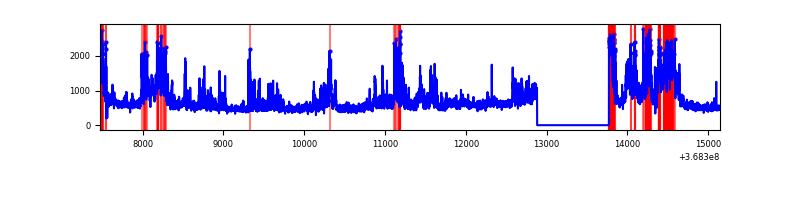 |
| D | 7673 | 6784 | 151 | 151 | 1.97% | 2.23% | 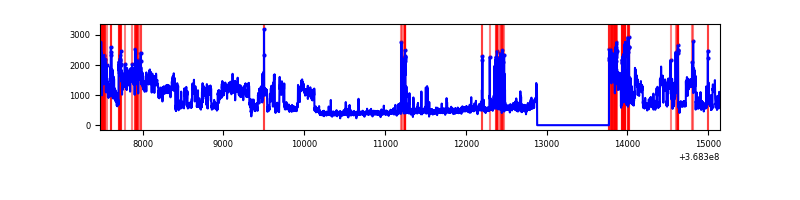 |
Top three noisy pixels from each quadrant. If the there are fewer than three noisy pixels in the level2.evt file, extra rows are filled as -1
| Pixel properties | Quadrant properties | ||||||
|---|---|---|---|---|---|---|---|
| Quadrant | DetID | PixID | Counts | Sigma | Mean | Median | Sigma |
| A | 15 | 174 | 20512 | 115.79 | 844 | 827 | 170.0 |
| A | 13 | 254 | 13614 | 75.22 | 844 | 827 | 170.0 |
| A | 13 | 6 | 8414 | 44.63 | 844 | 827 | 170.0 |
| B | 6 | 159 | 1871125 | 11619.32 | 832 | 812 | 161.0 |
| B | 10 | 245 | 146941 | 907.83 | 832 | 812 | 161.0 |
| B | 5 | 172 | 85379 | 525.37 | 832 | 812 | 161.0 |
| C | 3 | 233 | 1686071 | 9059.25 | 791 | 800 | 186.0 |
| C | 0 | 10 | 196963 | 1054.48 | 791 | 800 | 186.0 |
| C | 14 | 238 | 144122 | 770.43 | 791 | 800 | 186.0 |
| D | 8 | 195 | 2250854 | 11482.17 | 810 | 788 | 196.0 |
| D | 12 | 227 | 302942 | 1541.9 | 810 | 788 | 196.0 |
| D | 12 | 218 | 167937 | 852.97 | 810 | 788 | 196.0 |
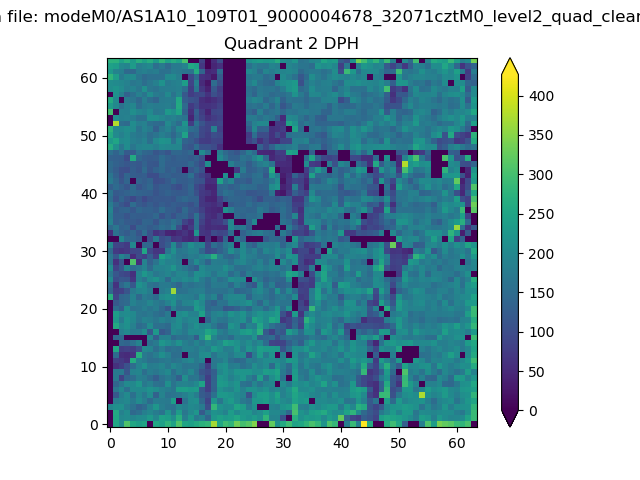
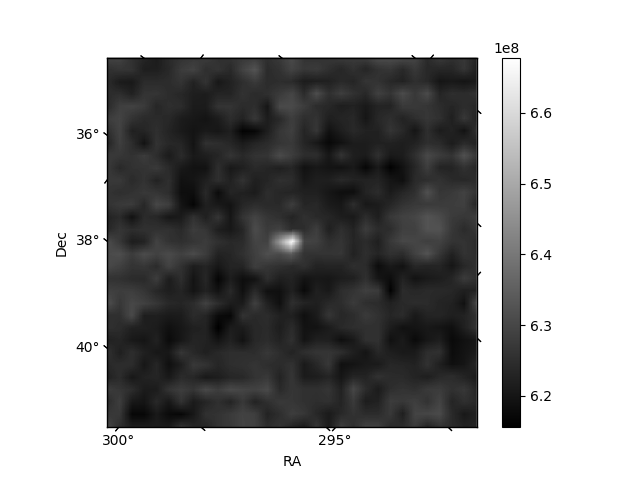
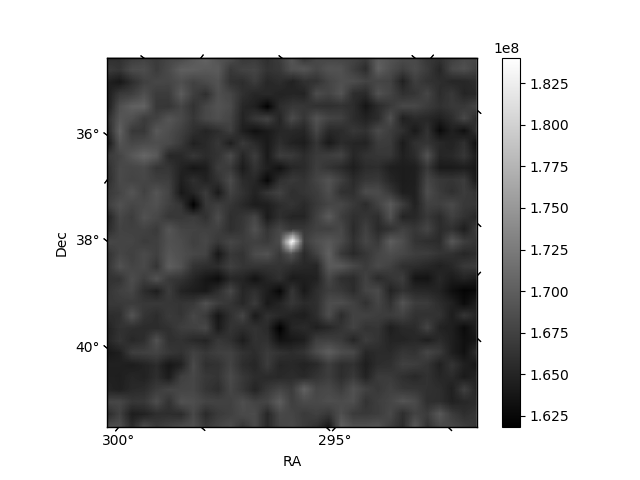
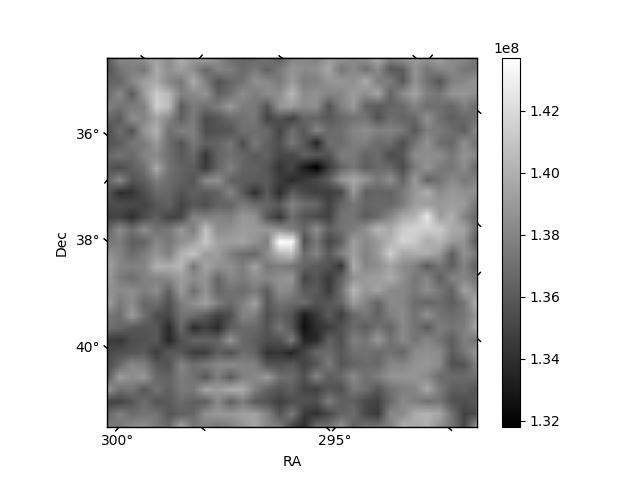
Histogram calculated using DETX and DETY for each event in the final _common_clean file
| Quadrant A | 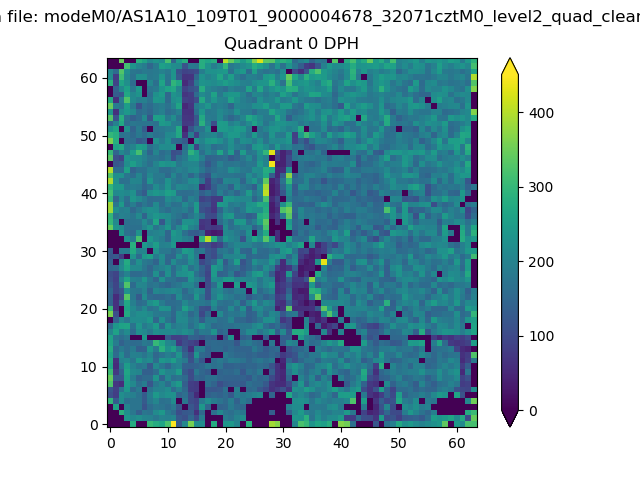 |
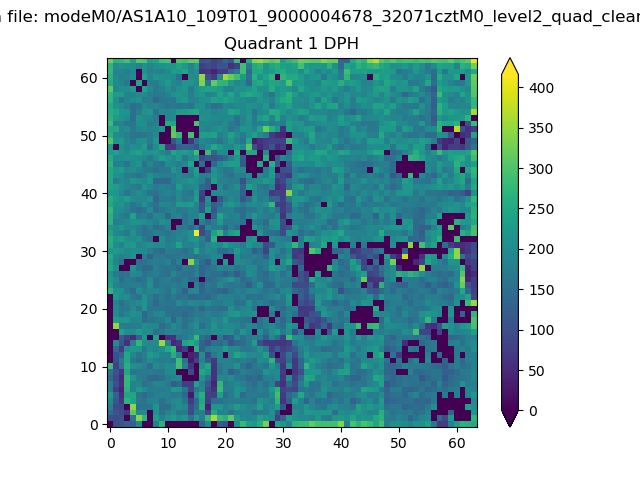 |
Quadrant B |
|---|---|---|---|
| Quadrant D | 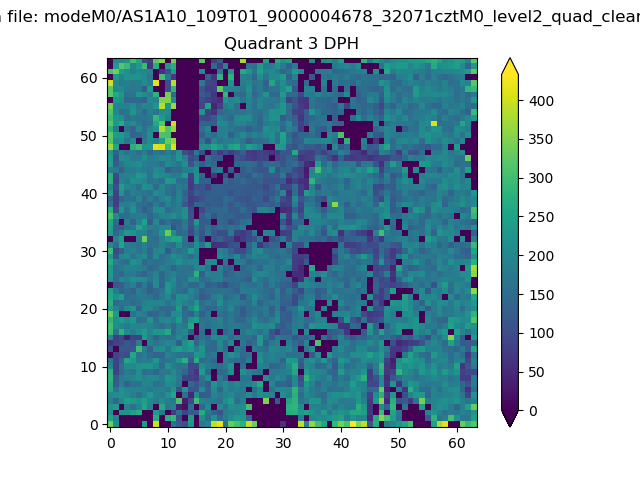 |
 |
Quadrant C |
| Plot type | Count rate plots | Images |
|---|---|---|
| Comparison with Poisson distribution Blue bars denote a histogram of data divided into 1 sec bins. Red curve is a Poisson curve with rate = median count rate of data. |
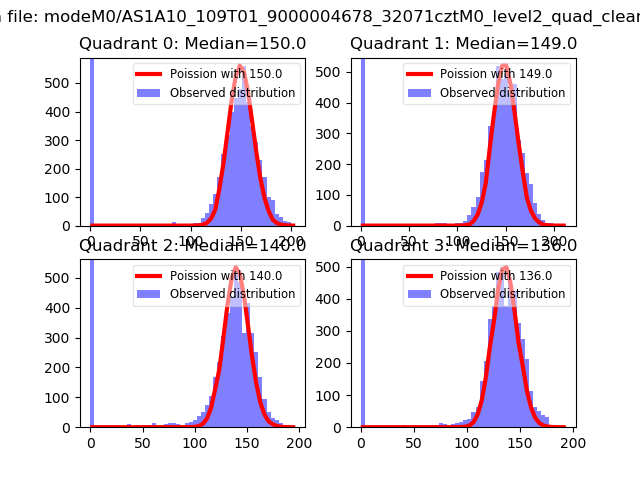 |
 |
| Quadrant-wise count rates Data is divided into 100 sec bins |
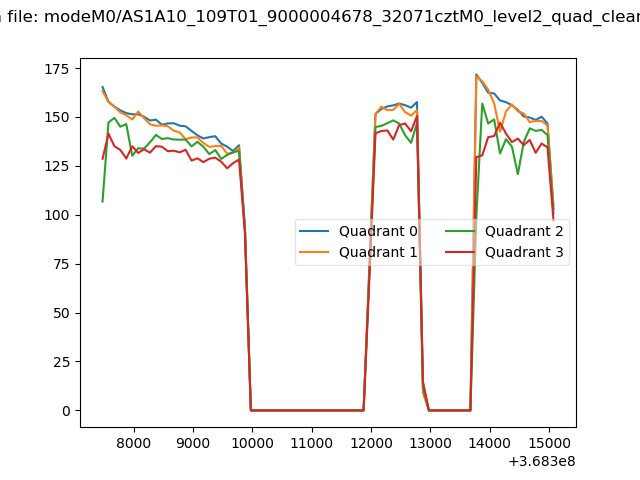 |
|
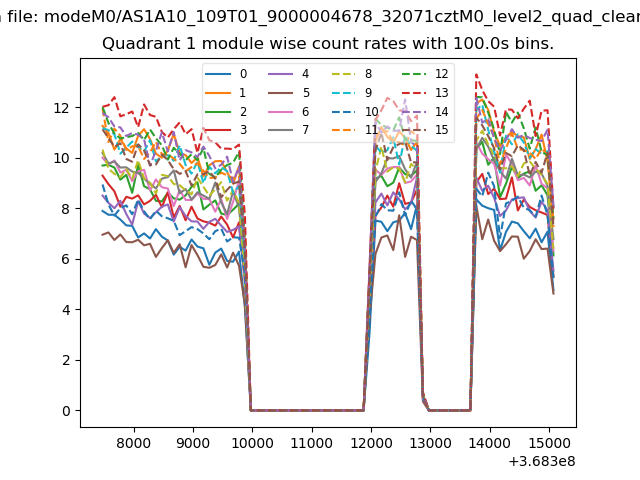
| Module-wise count rates for Quadrant A Data is divided into 100 sec bins |
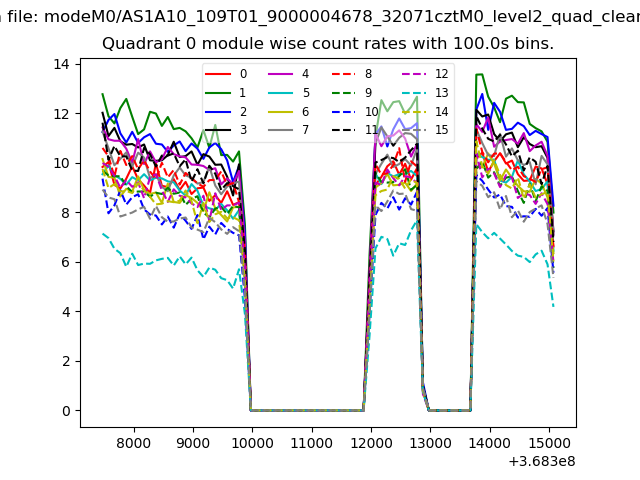 |
 |
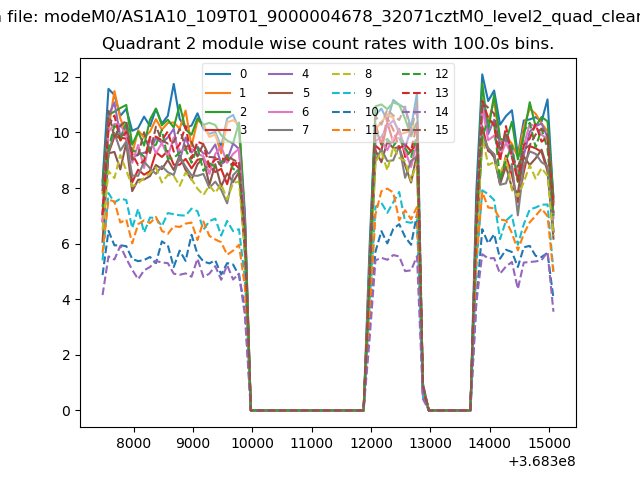
| Module-wise count rates for Quadrant B Data is divided into 100 sec bins |
 |
 |
| Module-wise count rates for Quadrant C Data is divided into 100 sec bins |
 |
 |
| Module-wise count rates for Quadrant D Data is divided into 100 sec bins |
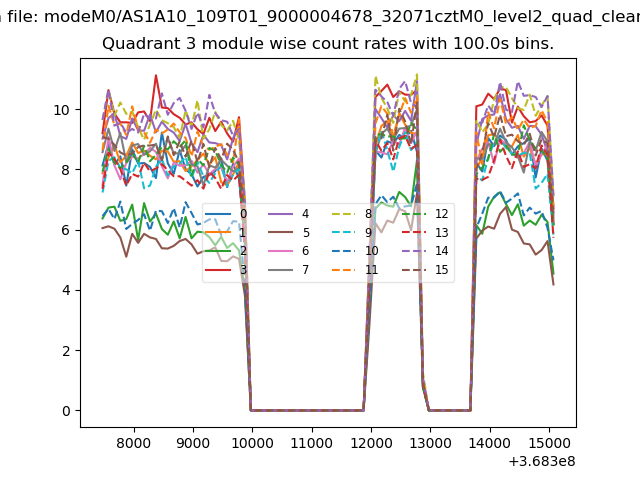 |
 |
| Parameter | Plot |
|---|---|
| CZT HV Monitor | 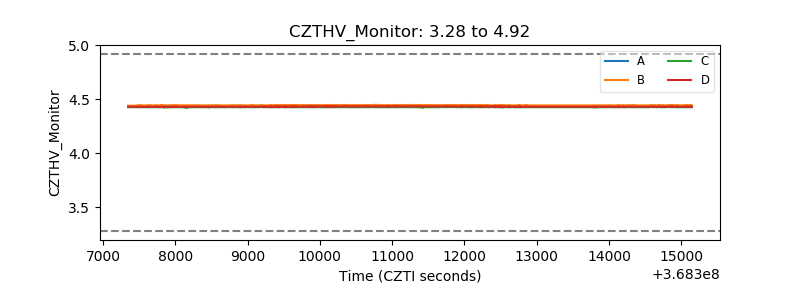 |
| D_VDD | 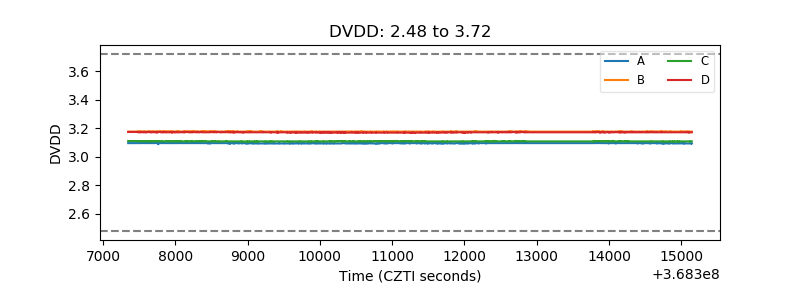 |
| Temperature 1 | 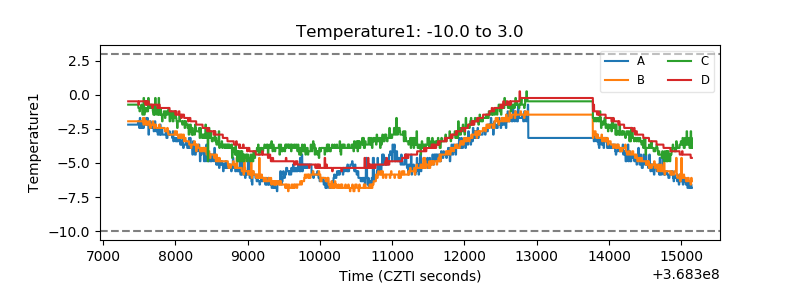 |
| Veto HV Monitor | 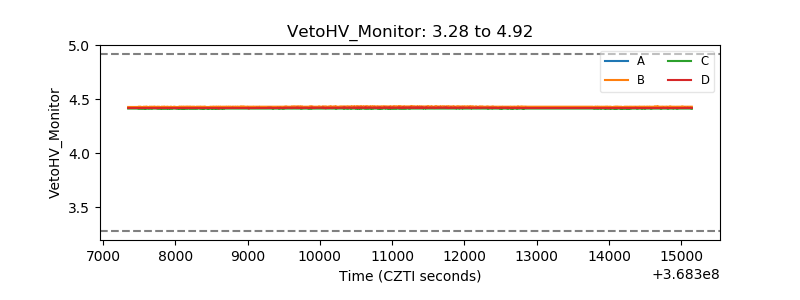 |
| Veto LLD |  |
| Alpha Counter | 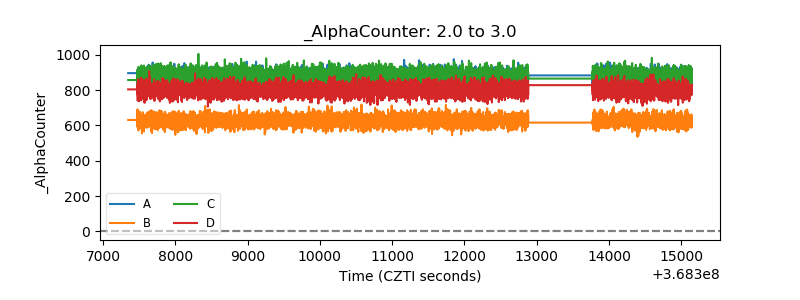 |
| _CPM_Rate | 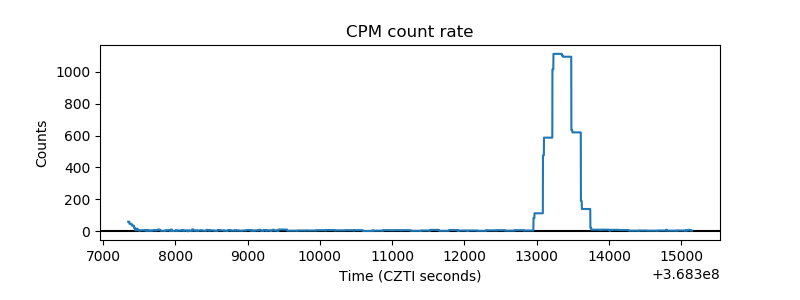 |
| CZT Counter | 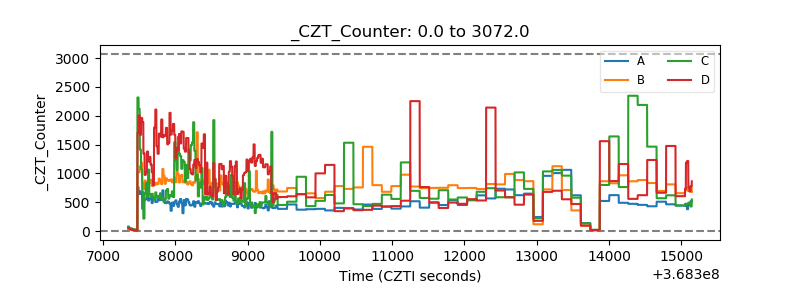 |
| +2.5 Volts monitor |  |
| +5 Volts monitor | 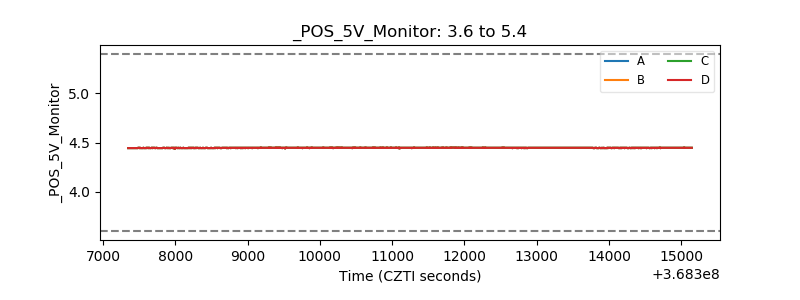 |
| _ROLL_ROT | 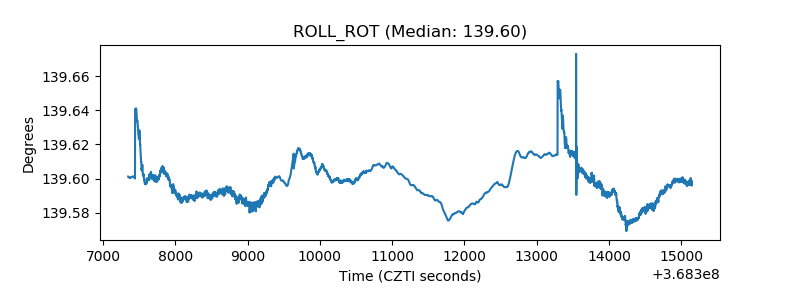 |
| _Roll_DEC |  |
| _Roll_RA |  |
| Veto Counter | 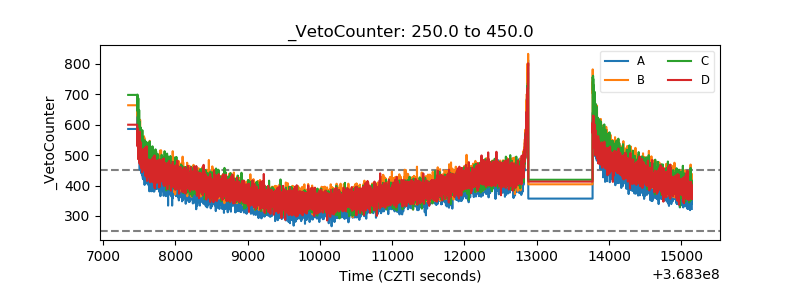 |