| Param | Original file | Final file |
|---|---|---|
| Filename | modeM0/AS1A10_109T01_9000004678_32072cztM0_level2.evt | modeM0/AS1A10_109T01_9000004678_32072cztM0_level2_quad_clean.evt |
| Size (bytes) | 783,541,440 | 98,095,680 |
| Size | 747.2 MB | 93.6 MB |
| Events in quadrant A | 3,168,899 | 692,094 |
| Events in quadrant B | 8,383,698 | 616,987 |
| Events in quadrant C | 5,108,924 | 587,992 |
| Events in quadrant D | 6,627,555 | 617,547 |
| Mode M9 | |||
|---|---|---|---|
| Quadrant | BADHDUFLAG | Total packets | Discarded packets |
| A | 0 | 19 | 0 |
| B | 0 | 20 | 0 |
| C | 0 | 20 | 0 |
| D | 0 | 20 | 0 |
| Mode SS | |||
|---|---|---|---|
| Quadrant | BADHDUFLAG | Total packets | Discarded packets |
| A | 0 | 134 | 0 |
| B | 0 | 134 | 0 |
| C | 0 | 134 | 0 |
| D | 0 | 134 | 0 |
| Mode M0 | |||
|---|---|---|---|
| Quadrant | BADHDUFLAG | Total packets | Discarded packets |
| A | 0 | 13527 | 2 |
| B | 0 | 29446 | 2 |
| C | 0 | 19637 | 2 |
| D | 0 | 24452 | 2 |
| Quadrant | Total seconds | Saturated seconds | Saturation percentage |
|---|---|---|---|
| A | 6527 | 27 | 0.413666% |
| B | 6527 | 1363 | 20.882488% |
| C | 6527 | 2076 | 31.806343% |
| D | 6527 | 281 | 4.305194% |
Noise dominated data is calculated using 1-second bins in cleaned event files. If a bin has >2000 counts, and if more than 50% of those come from <1% of pixels, then it is considered to be noise-dominated and hence unusable.
| Quadrant | # 1 sec bins | Bins with >0 counts | Bins with >2000 counts | High rate bins dominated by noise | Noise dominated (total time) | Noise dominated (detector-on time) | Marked lightcurve |
|---|---|---|---|---|---|---|---|
| A | 7592 | 6527 | 0 | 0 | 0.00% | 0.00% | 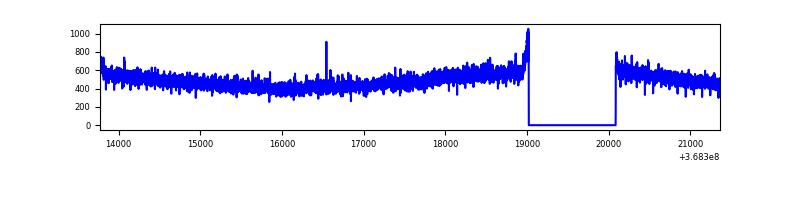 |
| B | 7592 | 6527 | 1035 | 1035 | 13.63% | 15.86% | 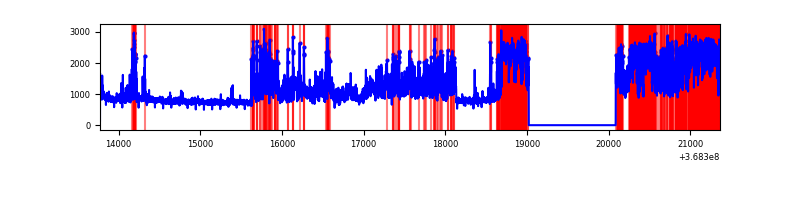 |
| C | 7592 | 6527 | 167 | 167 | 2.20% | 2.56% | 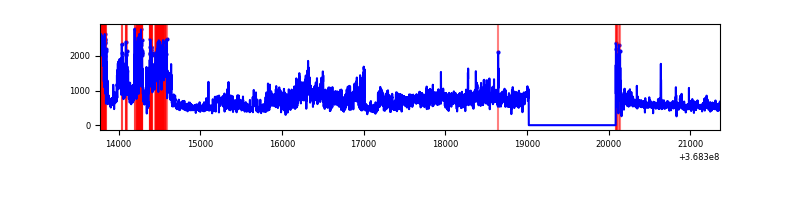 |
| D | 7592 | 6527 | 186 | 186 | 2.45% | 2.85% | 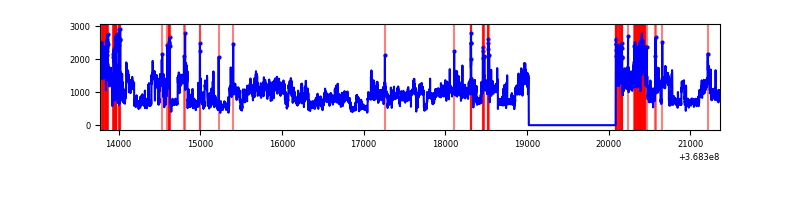 |
Top three noisy pixels from each quadrant. If the there are fewer than three noisy pixels in the level2.evt file, extra rows are filled as -1
| Pixel properties | Quadrant properties | ||||||
|---|---|---|---|---|---|---|---|
| Quadrant | DetID | PixID | Counts | Sigma | Mean | Median | Sigma |
| A | 13 | 254 | 12535 | 71.11 | 820 | 805 | 164.9 |
| A | 3 | 137 | 7969 | 43.43 | 820 | 805 | 164.9 |
| A | 0 | 226 | 6880 | 36.83 | 820 | 805 | 164.9 |
| B | 10 | 245 | 3414708 | 23611.72 | 759 | 741 | 144.6 |
| B | 6 | 159 | 1675553 | 11583.36 | 759 | 741 | 144.6 |
| B | 5 | 172 | 134533 | 925.33 | 759 | 741 | 144.6 |
| C | 3 | 233 | 989787 | 6233.13 | 673 | 680 | 158.7 |
| C | 14 | 254 | 639390 | 4025.01 | 673 | 680 | 158.7 |
| C | 14 | 238 | 576880 | 3631.09 | 673 | 680 | 158.7 |
| D | 8 | 195 | 2741843 | 14715.07 | 778 | 759 | 186.3 |
| D | 12 | 227 | 463438 | 2483.82 | 778 | 759 | 186.3 |
| D | 12 | 218 | 256292 | 1371.79 | 778 | 759 | 186.3 |
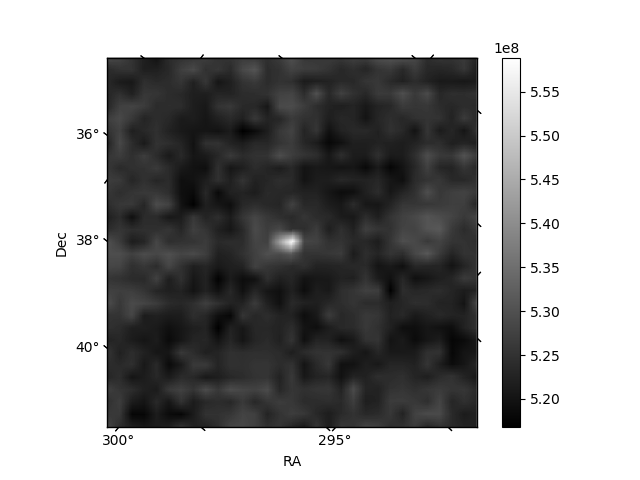
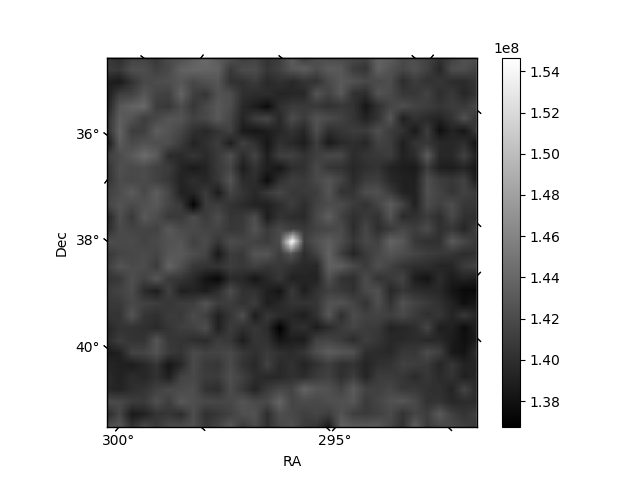
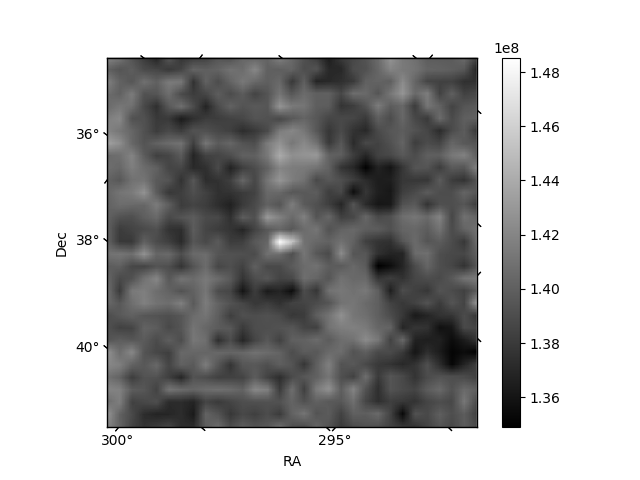
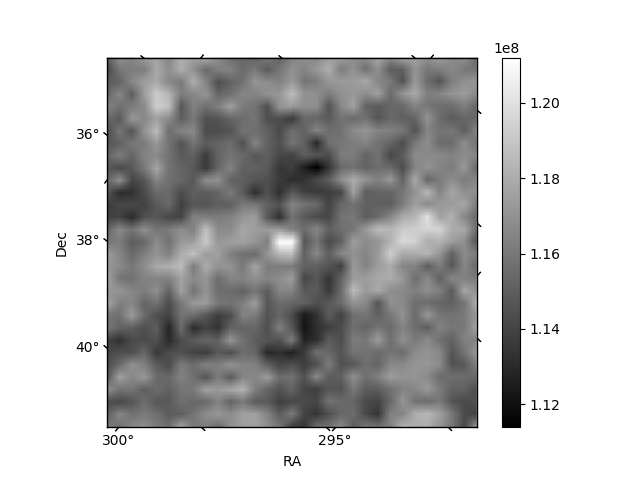
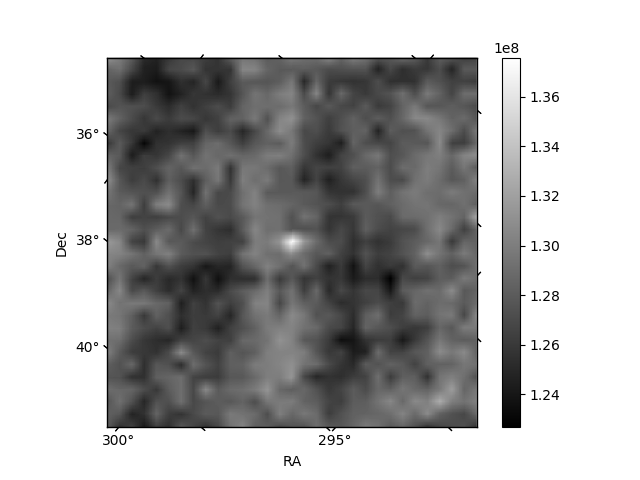
Histogram calculated using DETX and DETY for each event in the final _common_clean file
| Quadrant A | 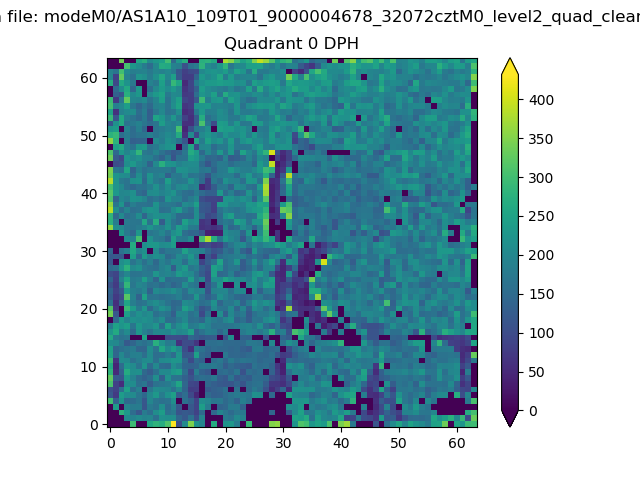 |
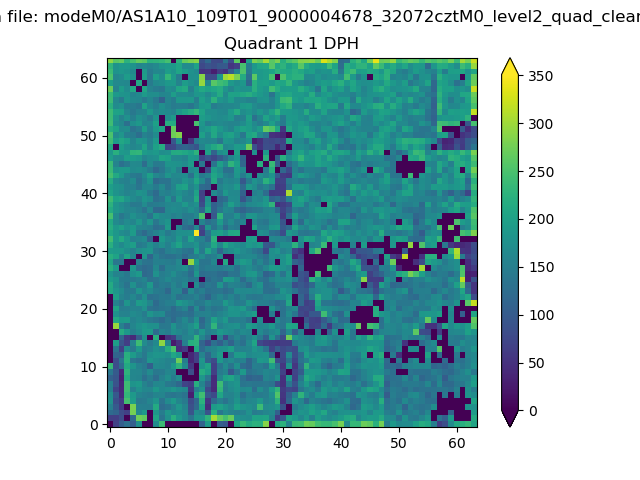 |
Quadrant B |
|---|---|---|---|
| Quadrant D | 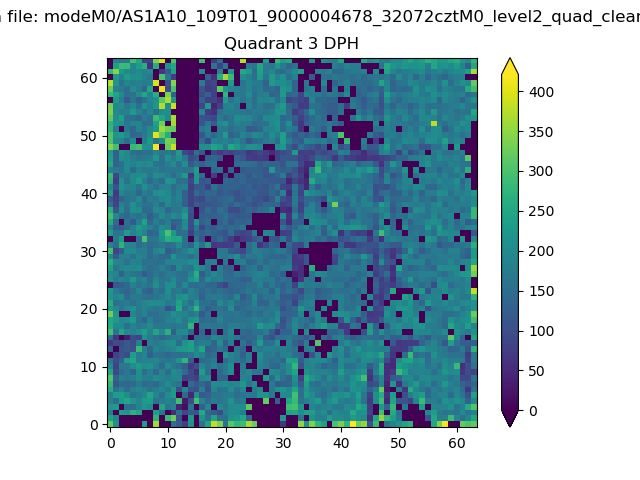 |
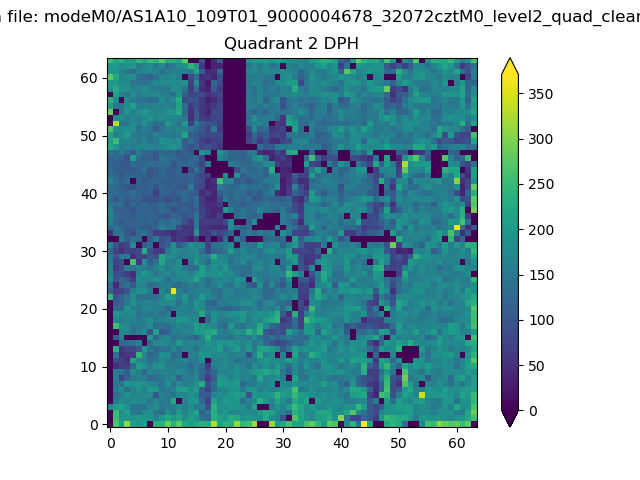 |
Quadrant C |
| Plot type | Count rate plots | Images |
|---|---|---|
| Comparison with Poisson distribution Blue bars denote a histogram of data divided into 1 sec bins. Red curve is a Poisson curve with rate = median count rate of data. |
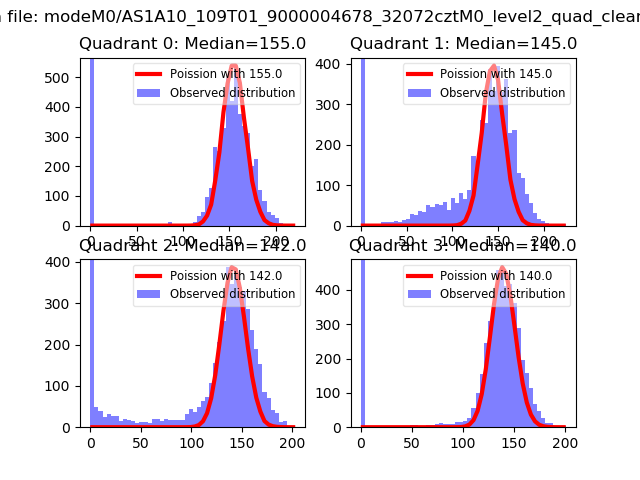 |
 |
| Quadrant-wise count rates Data is divided into 100 sec bins |
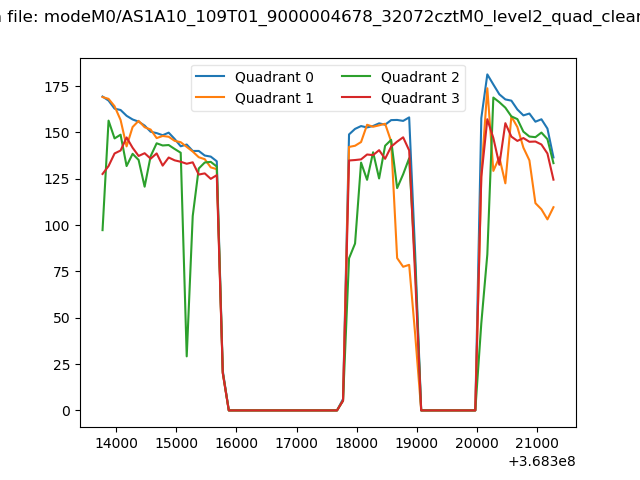 |
|
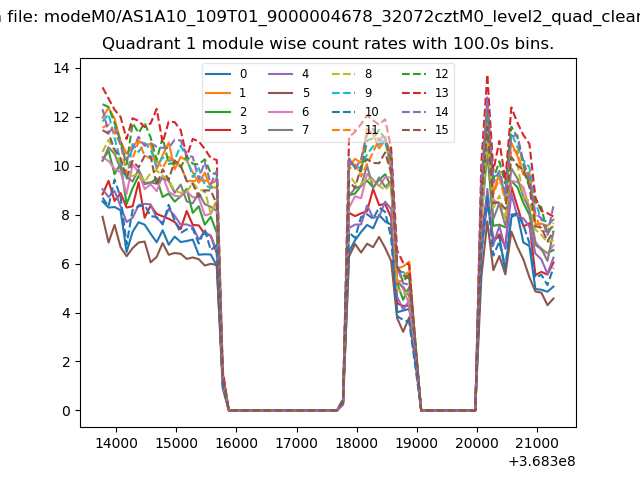
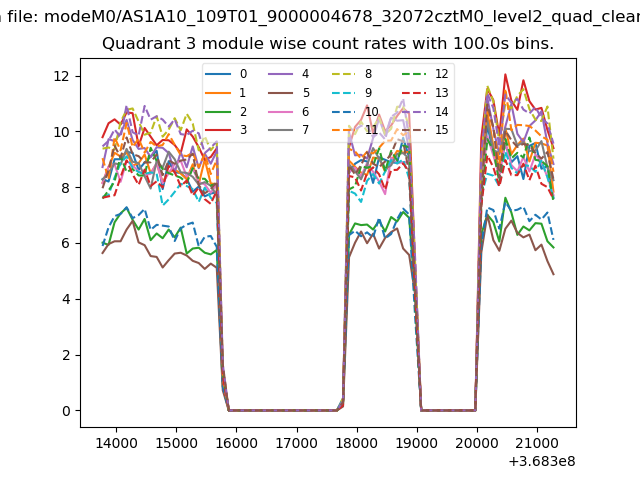
| Module-wise count rates for Quadrant A Data is divided into 100 sec bins |
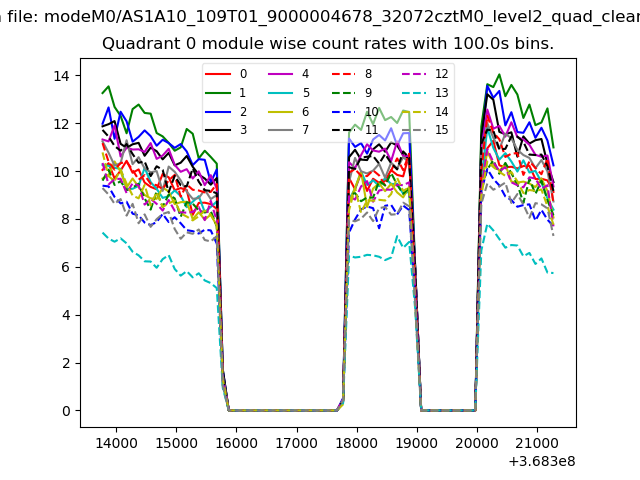 |
 |
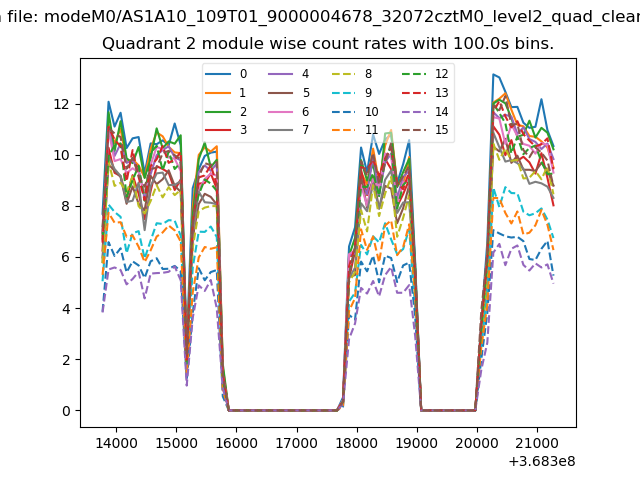
| Module-wise count rates for Quadrant B Data is divided into 100 sec bins |
 |
 |
| Module-wise count rates for Quadrant C Data is divided into 100 sec bins |
 |
 |
| Module-wise count rates for Quadrant D Data is divided into 100 sec bins |
 |
 |
| Parameter | Plot |
|---|---|
| CZT HV Monitor | 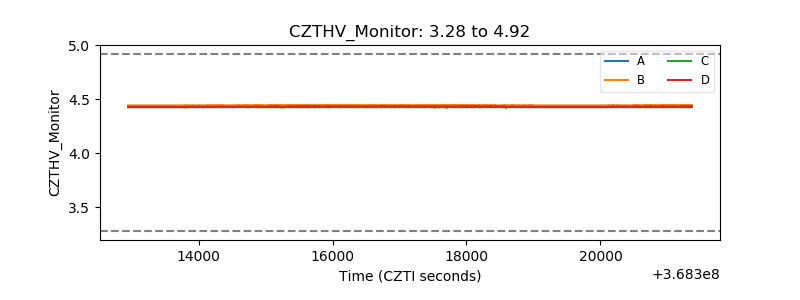 |
| D_VDD | 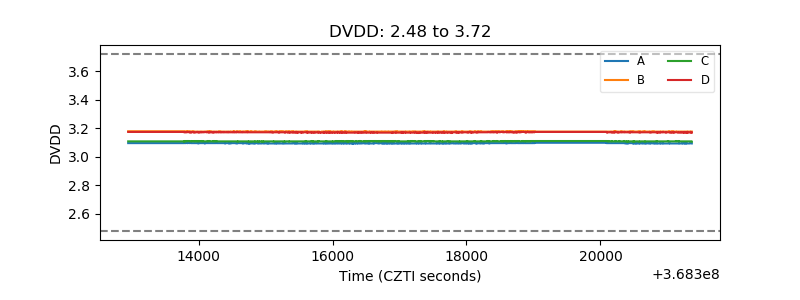 |
| Temperature 1 | 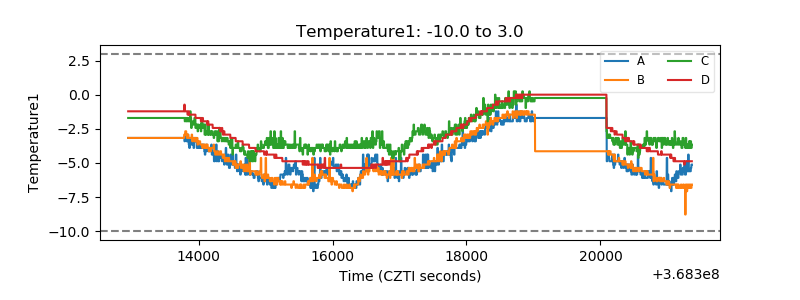 |
| Veto HV Monitor |  |
| Veto LLD | 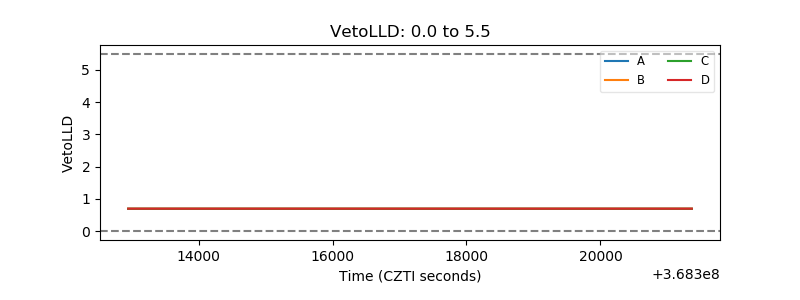 |
| Alpha Counter | 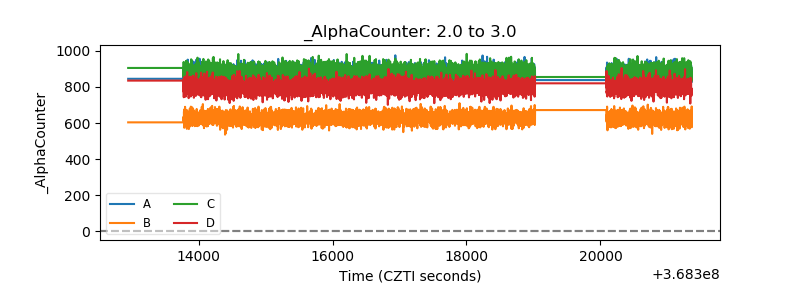 |
| _CPM_Rate | 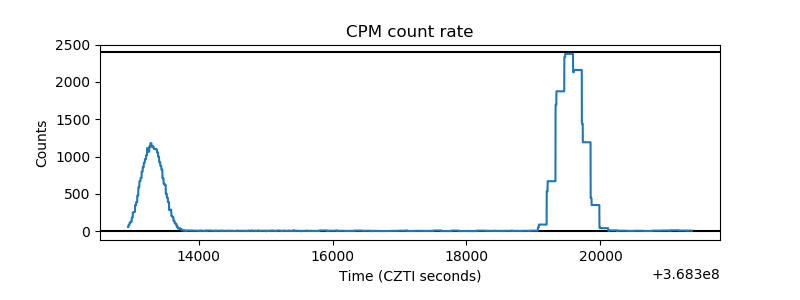 |
| CZT Counter | 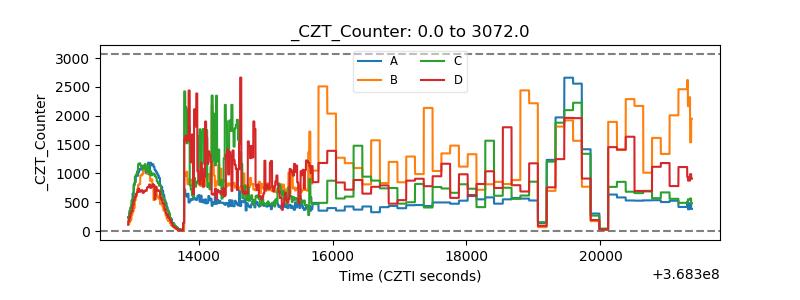 |
| +2.5 Volts monitor |  |
| +5 Volts monitor |  |
| _ROLL_ROT | 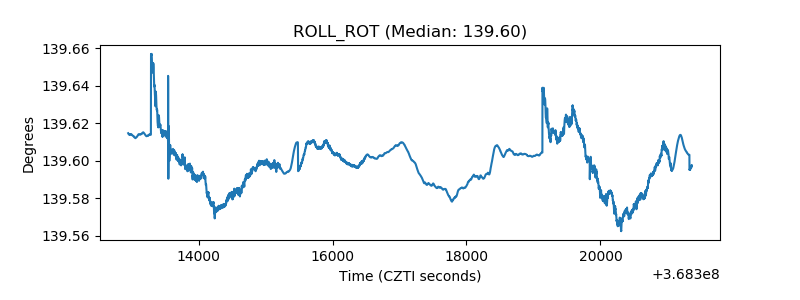 |
| _Roll_DEC | 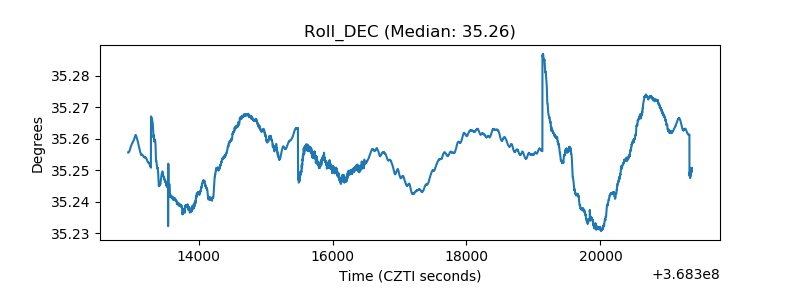 |
| _Roll_RA | 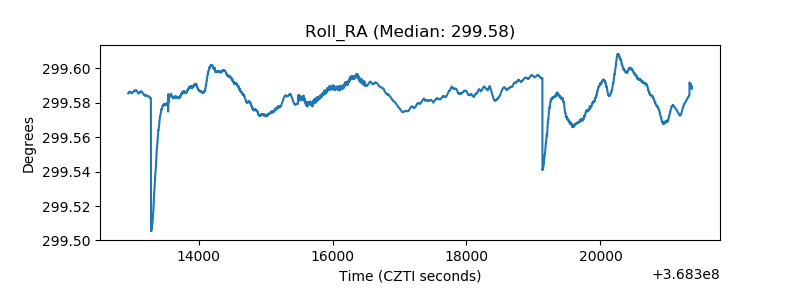 |
| Veto Counter | 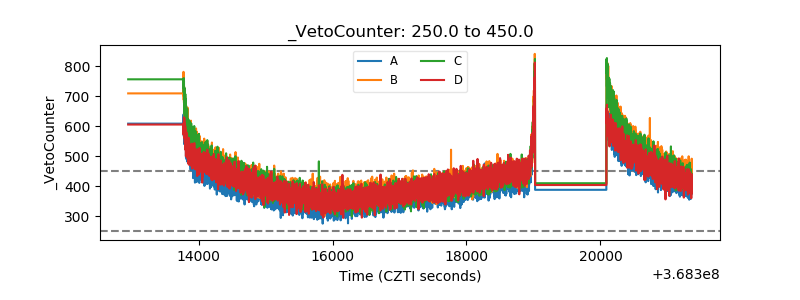 |