| Param | Original file | Final file |
|---|---|---|
| Filename | modeM0/AS1A10_109T01_9000004678_32074cztM0_level2.evt | modeM0/AS1A10_109T01_9000004678_32074cztM0_level2_quad_clean.evt |
| Size (bytes) | 831,695,040 | 82,932,480 |
| Size | 793.2 MB | 79.1 MB |
| Events in quadrant A | 3,228,759 | 573,245 |
| Events in quadrant B | 10,714,684 | 474,312 |
| Events in quadrant C | 4,729,054 | 500,869 |
| Events in quadrant D | 6,077,844 | 508,712 |
| Mode M9 | |||
|---|---|---|---|
| Quadrant | BADHDUFLAG | Total packets | Discarded packets |
| A | 0 | 12 | 0 |
| B | 0 | 13 | 0 |
| C | 0 | 13 | 0 |
| D | 0 | 13 | 0 |
| Mode SS | |||
|---|---|---|---|
| Quadrant | BADHDUFLAG | Total packets | Discarded packets |
| A | 0 | 134 | 0 |
| B | 0 | 134 | 0 |
| C | 0 | 134 | 0 |
| D | 0 | 134 | 0 |
| Mode M0 | |||
|---|---|---|---|
| Quadrant | BADHDUFLAG | Total packets | Discarded packets |
| A | 0 | 13632 | 2 |
| B | 0 | 36398 | 2 |
| C | 0 | 18268 | 2 |
| D | 0 | 22574 | 3 |
| Quadrant | Total seconds | Saturated seconds | Saturation percentage |
|---|---|---|---|
| A | 6488 | 13 | 0.200370% |
| B | 6488 | 2500 | 38.532676% |
| C | 6488 | 807 | 12.438348% |
| D | 6487 | 212 | 3.268075% |
Noise dominated data is calculated using 1-second bins in cleaned event files. If a bin has >2000 counts, and if more than 50% of those come from <1% of pixels, then it is considered to be noise-dominated and hence unusable.
| Quadrant | # 1 sec bins | Bins with >0 counts | Bins with >2000 counts | High rate bins dominated by noise | Noise dominated (total time) | Noise dominated (detector-on time) | Marked lightcurve |
|---|---|---|---|---|---|---|---|
| A | 7678 | 6489 | 0 | 0 | 0.00% | 0.00% | 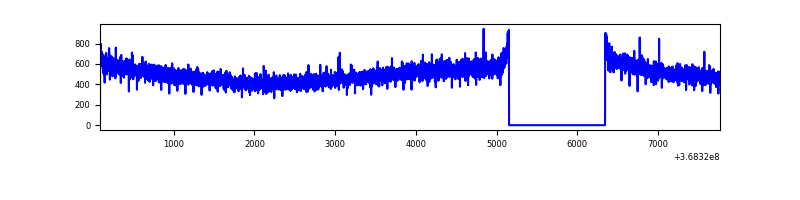 |
| B | 7678 | 6488 | 1938 | 1938 | 25.24% | 29.87% | 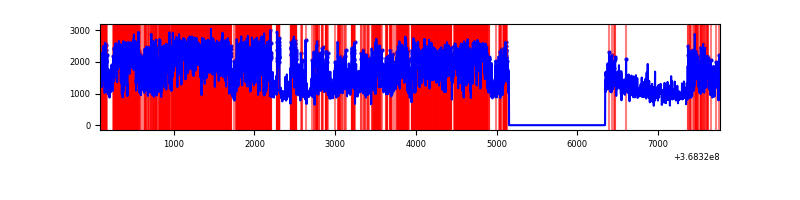 |
| C | 7678 | 6489 | 283 | 283 | 3.69% | 4.36% | 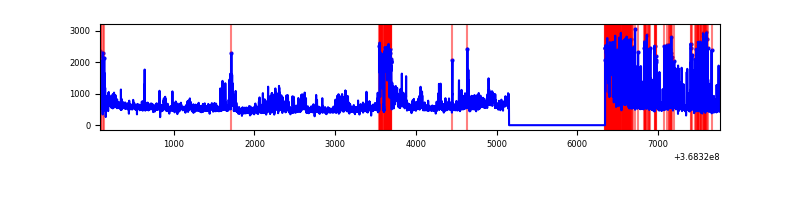 |
| D | 7677 | 6488 | 155 | 155 | 2.02% | 2.39% | 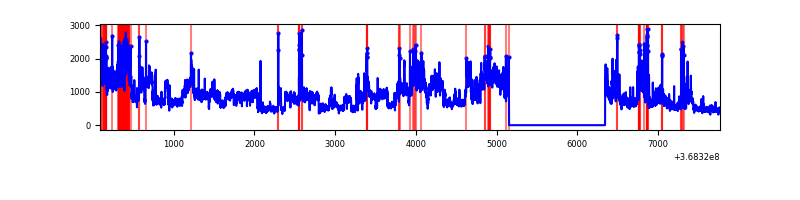 |
Top three noisy pixels from each quadrant. If the there are fewer than three noisy pixels in the level2.evt file, extra rows are filled as -1
| Pixel properties | Quadrant properties | ||||||
|---|---|---|---|---|---|---|---|
| Quadrant | DetID | PixID | Counts | Sigma | Mean | Median | Sigma |
| A | 13 | 254 | 12142 | 68.78 | 834 | 819 | 164.6 |
| A | 13 | 6 | 9732 | 54.14 | 834 | 819 | 164.6 |
| A | 3 | 137 | 8048 | 43.91 | 834 | 819 | 164.6 |
| B | 10 | 245 | 5923090 | 41972.13 | 757 | 740 | 141.1 |
| B | 6 | 159 | 1655651 | 11728.47 | 757 | 740 | 141.1 |
| B | 0 | 190 | 100818 | 709.26 | 757 | 740 | 141.1 |
| C | 0 | 10 | 897453 | 5087.21 | 759 | 766 | 176.3 |
| C | 3 | 233 | 237069 | 1340.63 | 759 | 766 | 176.3 |
| C | 14 | 238 | 231836 | 1310.94 | 759 | 766 | 176.3 |
| D | 8 | 195 | 2087480 | 11094.51 | 791 | 773 | 188.1 |
| D | 12 | 227 | 504979 | 2680.74 | 791 | 773 | 188.1 |
| D | 12 | 218 | 353377 | 1874.71 | 791 | 773 | 188.1 |
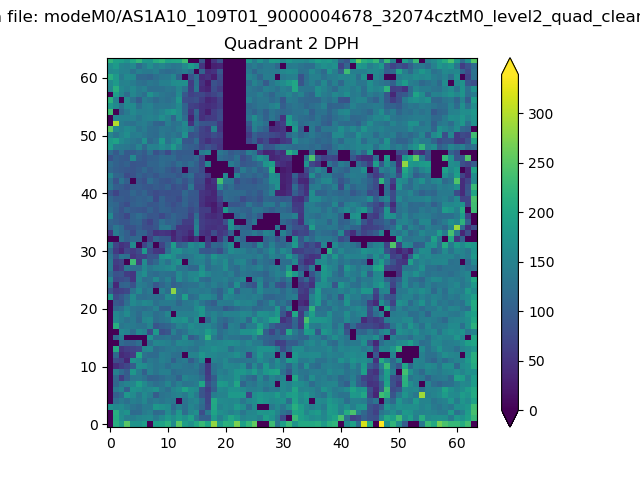
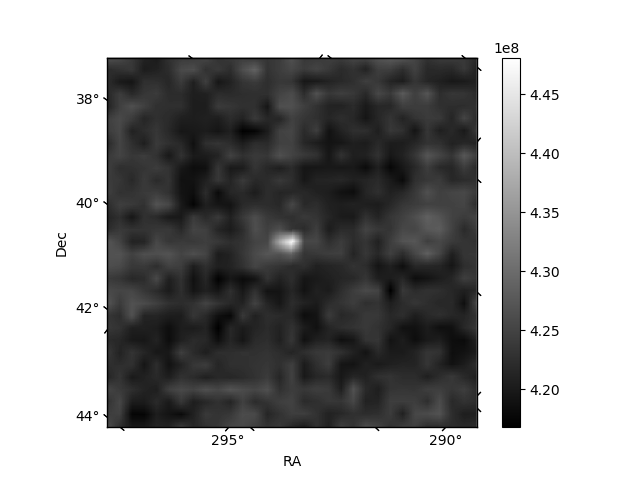
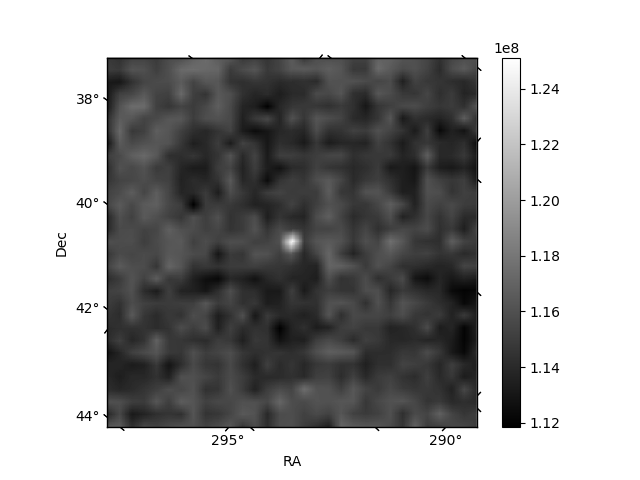
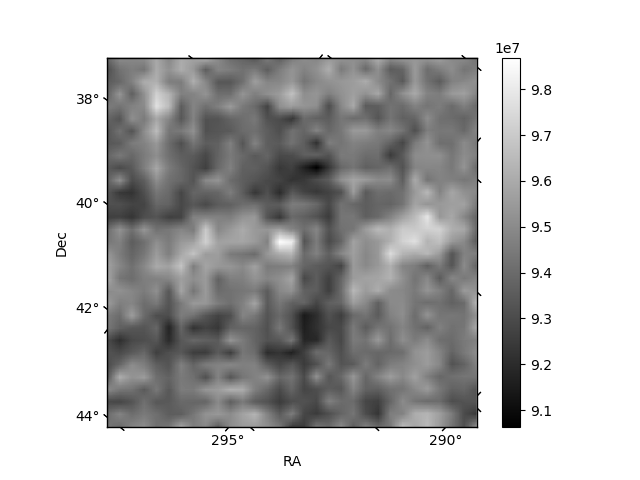
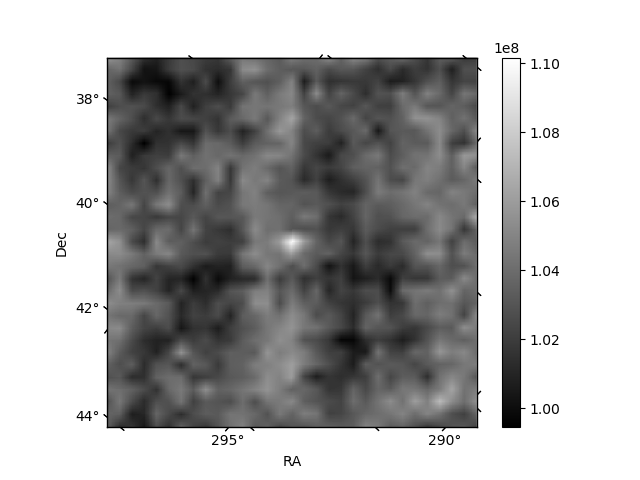
Histogram calculated using DETX and DETY for each event in the final _common_clean file
| Quadrant A | 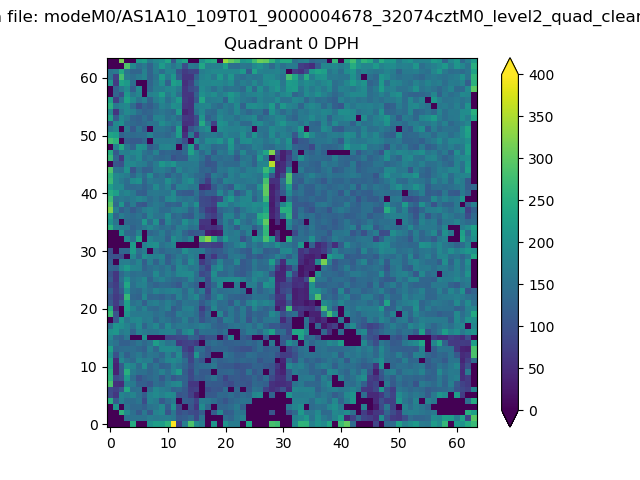 |
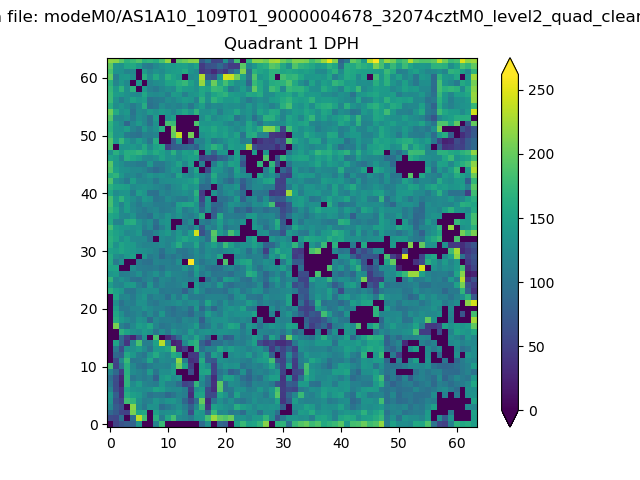 |
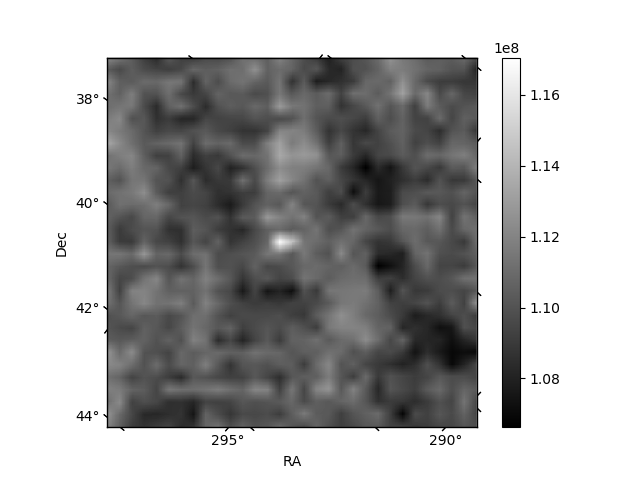
Quadrant B |
|---|---|---|---|
| Quadrant D | 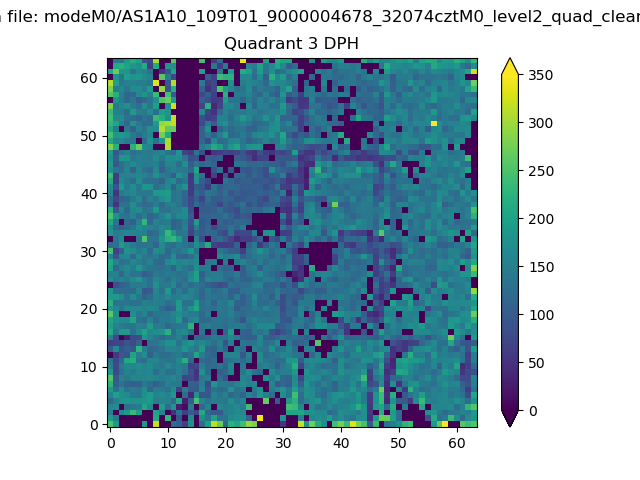 |
 |
Quadrant C |
| Plot type | Count rate plots | Images |
|---|---|---|
| Comparison with Poisson distribution Blue bars denote a histogram of data divided into 1 sec bins. Red curve is a Poisson curve with rate = median count rate of data. |
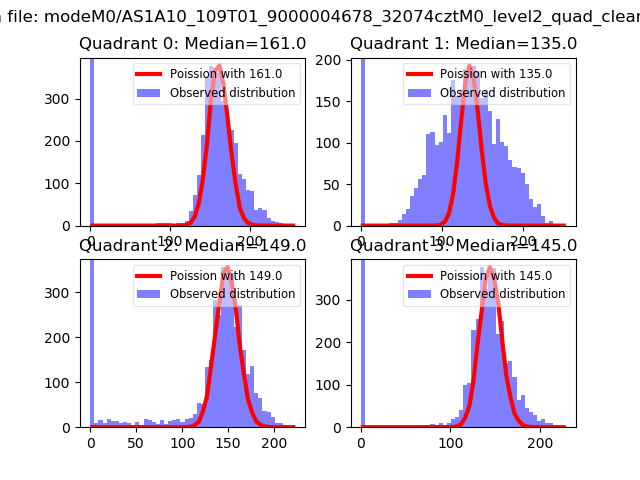 |
 |
| Quadrant-wise count rates Data is divided into 100 sec bins |
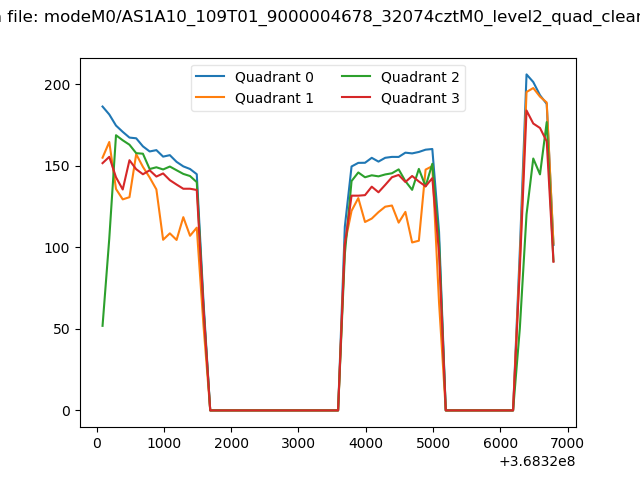 |
|
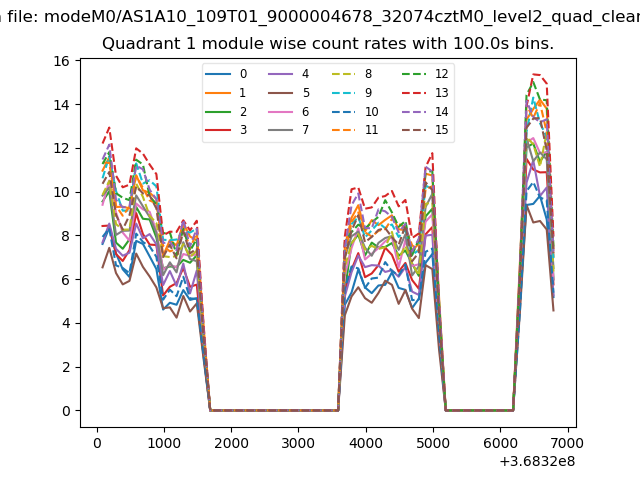
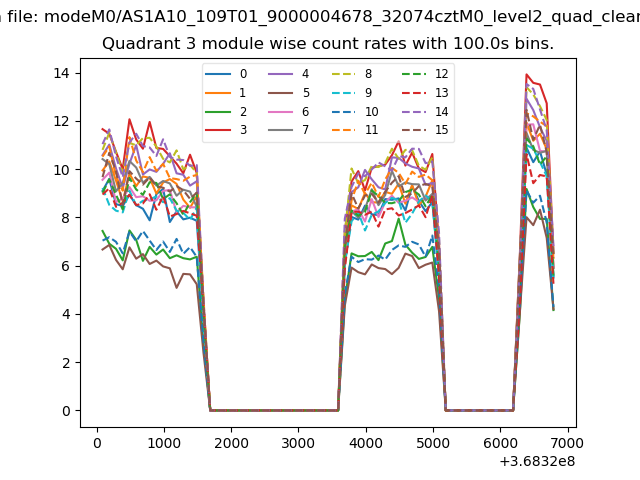
| Module-wise count rates for Quadrant A Data is divided into 100 sec bins |
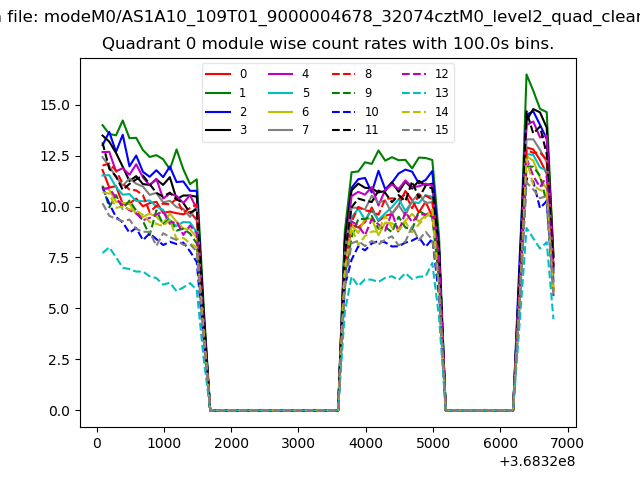 |
 |
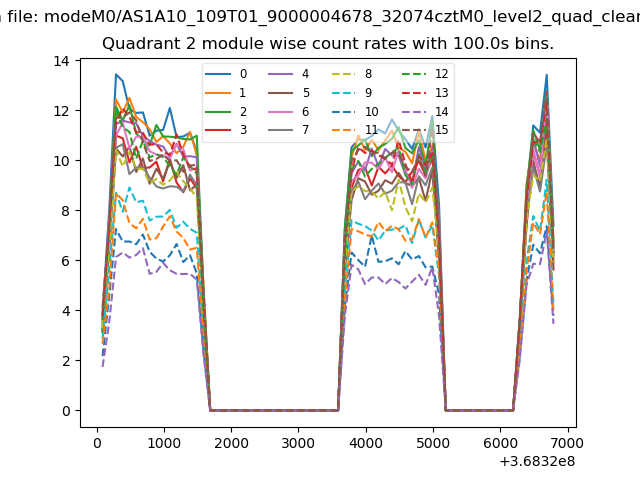
| Module-wise count rates for Quadrant B Data is divided into 100 sec bins |
 |
 |
| Module-wise count rates for Quadrant C Data is divided into 100 sec bins |
 |
 |
| Module-wise count rates for Quadrant D Data is divided into 100 sec bins |
 |
 |
| Parameter | Plot |
|---|---|
| CZT HV Monitor | 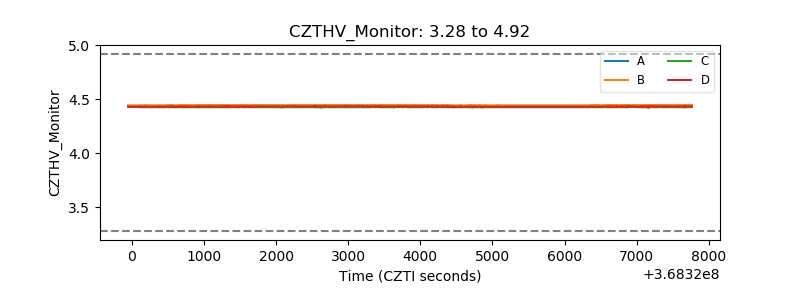 |
| D_VDD | 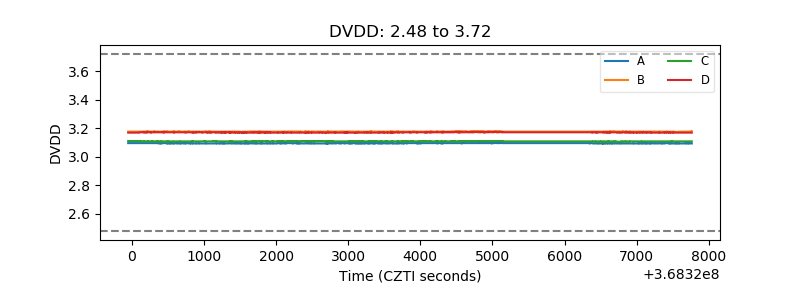 |
| Temperature 1 | 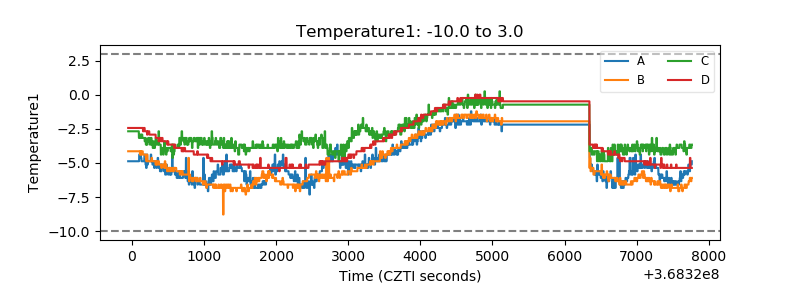 |
| Veto HV Monitor |  |
| Veto LLD | 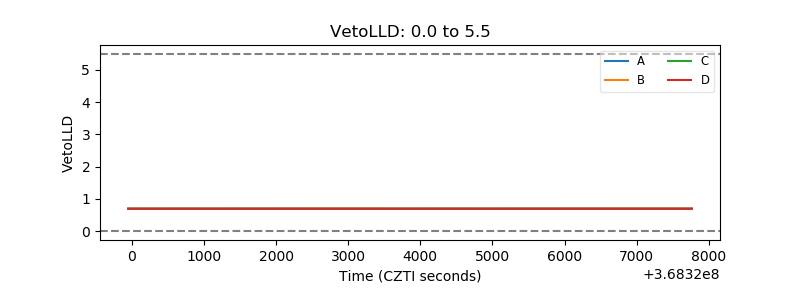 |
| Alpha Counter | 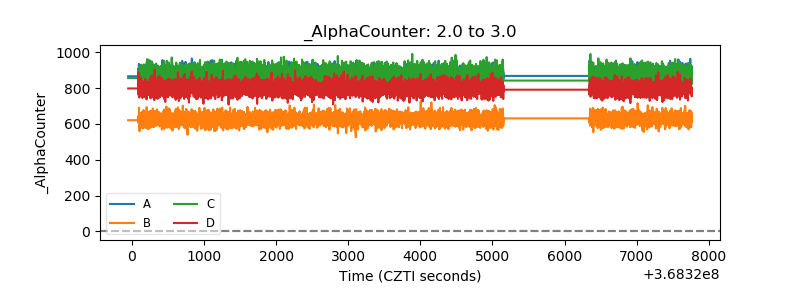 |
| _CPM_Rate | 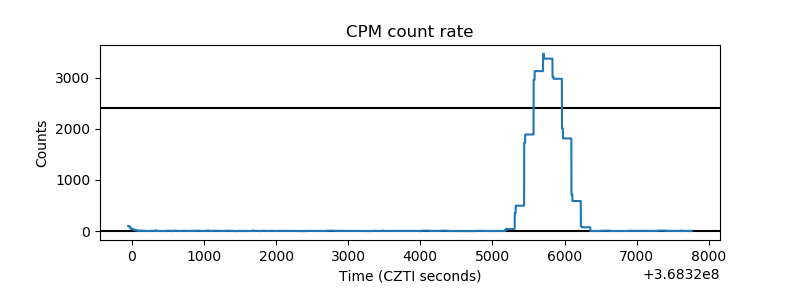 |
| CZT Counter | 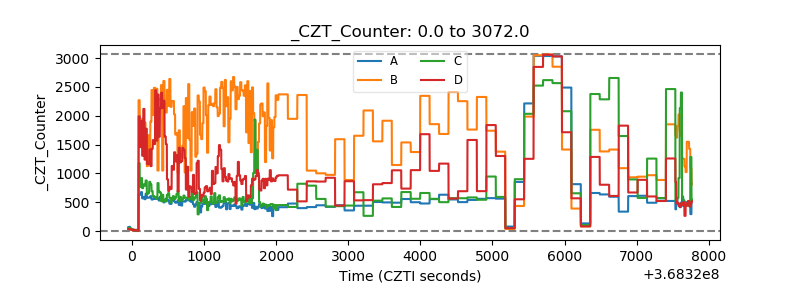 |
| +2.5 Volts monitor |  |
| +5 Volts monitor |  |
| _ROLL_ROT | 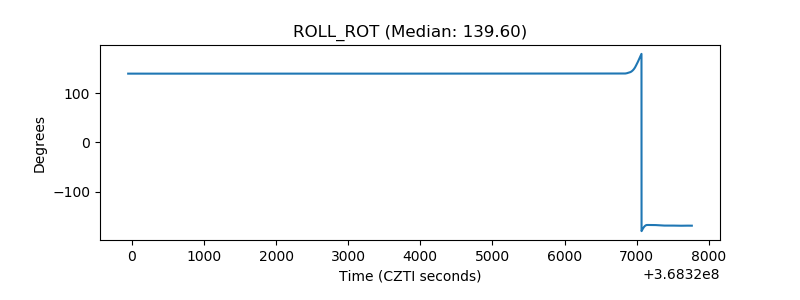 |
| _Roll_DEC | 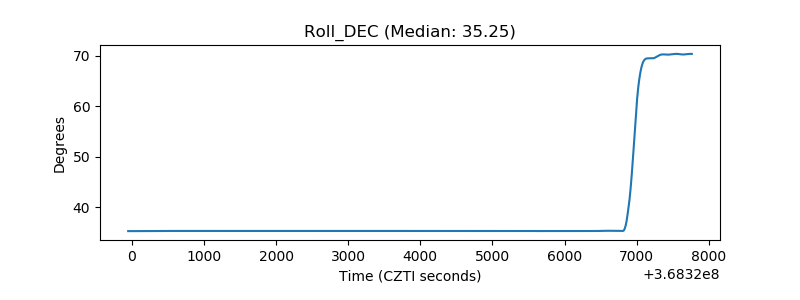 |
| _Roll_RA | 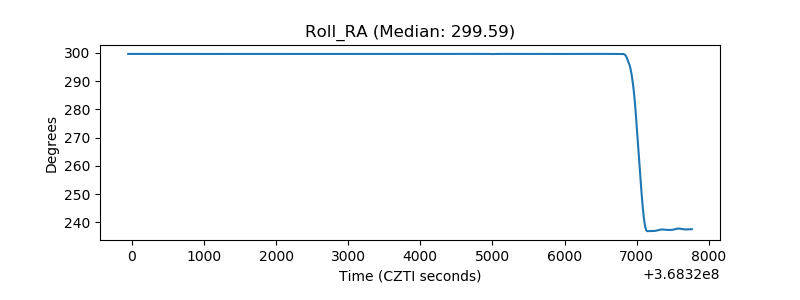 |
| Veto Counter | 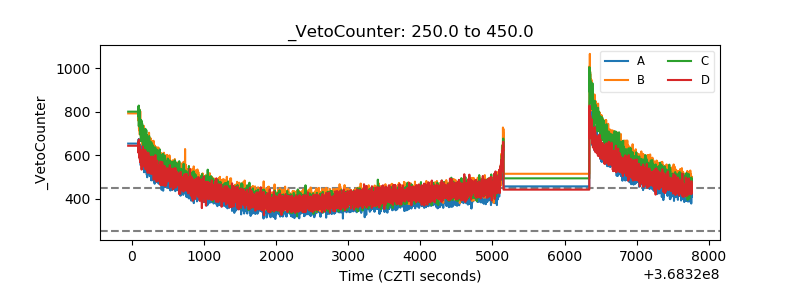 |