| Param | Original file | Final file |
|---|---|---|
| Filename | modeM0/AS1T04_046T01_9000004680_32029cztM0_level2.evt | modeM0/AS1T04_046T01_9000004680_32029cztM0_level2_quad_clean.evt |
| Size (bytes) | 439,081,920 | 61,899,840 |
| Size | 418.7 MB | 59.0 MB |
| Events in quadrant A | 2,444,586 | 393,812 |
| Events in quadrant B | 4,689,522 | 382,297 |
| Events in quadrant C | 2,812,508 | 380,849 |
| Events in quadrant D | 3,021,728 | 376,669 |
| Mode M0 | |||
|---|---|---|---|
| Quadrant | BADHDUFLAG | Total packets | Discarded packets |
| A | 0 | 10256 | 1 |
| B | 0 | 17466 | 3 |
| C | 0 | 11219 | 1 |
| D | 0 | 12180 | 1 |
| Mode M9 | |||
|---|---|---|---|
| Quadrant | BADHDUFLAG | Total packets | Discarded packets |
| A | 0 | 11 | 0 |
| B | 0 | 11 | 0 |
| C | 0 | 11 | 0 |
| D | 0 | 11 | 0 |
| Mode SS | |||
|---|---|---|---|
| Quadrant | BADHDUFLAG | Total packets | Discarded packets |
| A | 0 | 98 | 0 |
| B | 0 | 98 | 0 |
| C | 0 | 98 | 0 |
| D | 0 | 98 | 0 |
| Quadrant | Total seconds | Saturated seconds | Saturation percentage |
|---|---|---|---|
| A | 4856 | 44 | 0.906096% |
| B | 4855 | 466 | 9.598352% |
| C | 4855 | 146 | 3.007209% |
| D | 4855 | 67 | 1.380021% |
Noise dominated data is calculated using 1-second bins in cleaned event files. If a bin has >2000 counts, and if more than 50% of those come from <1% of pixels, then it is considered to be noise-dominated and hence unusable.
| Quadrant | # 1 sec bins | Bins with >0 counts | Bins with >2000 counts | High rate bins dominated by noise | Noise dominated (total time) | Noise dominated (detector-on time) | Marked lightcurve |
|---|---|---|---|---|---|---|---|
| A | 5951 | 4856 | 16 | 16 | 0.27% | 0.33% | 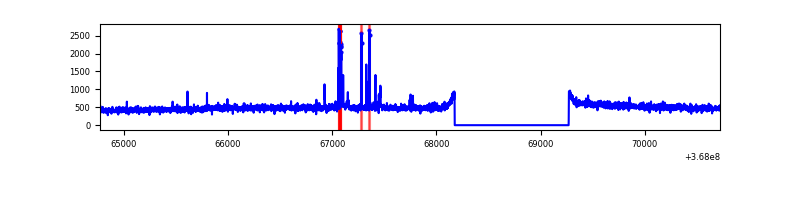 |
| B | 5950 | 4855 | 254 | 254 | 4.27% | 5.23% | 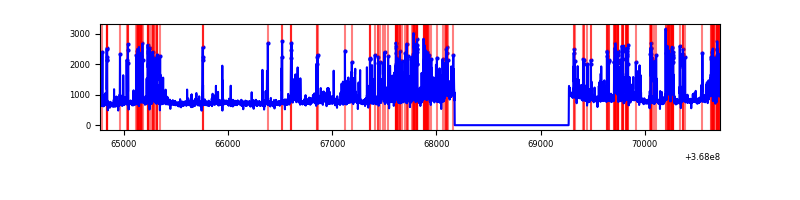 |
| C | 5950 | 4855 | 59 | 59 | 0.99% | 1.22% | 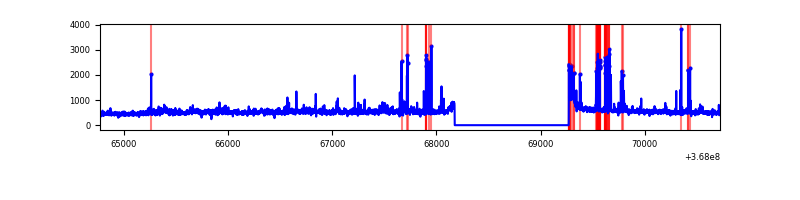 |
| D | 5950 | 4855 | 44 | 44 | 0.74% | 0.91% | 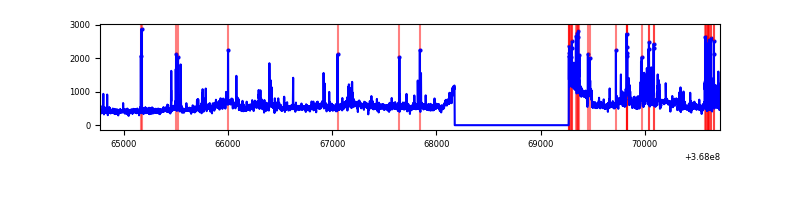 |
Top three noisy pixels from each quadrant. If the there are fewer than three noisy pixels in the level2.evt file, extra rows are filled as -1
| Pixel properties | Quadrant properties | ||||||
|---|---|---|---|---|---|---|---|
| Quadrant | DetID | PixID | Counts | Sigma | Mean | Median | Sigma |
| A | 15 | 174 | 73455 | 591.22 | 610 | 598 | 123.2 |
| A | 13 | 6 | 11182 | 85.89 | 610 | 598 | 123.2 |
| A | 13 | 254 | 8358 | 62.97 | 610 | 598 | 123.2 |
| B | 6 | 159 | 1275288 | 11378.93 | 584 | 569 | 112.0 |
| B | 12 | 18 | 815827 | 7277.5 | 584 | 569 | 112.0 |
| B | 0 | 190 | 122530 | 1088.7 | 584 | 569 | 112.0 |
| C | 0 | 10 | 228609 | 1677.92 | 579 | 582 | 135.9 |
| C | 3 | 233 | 181675 | 1332.56 | 579 | 582 | 135.9 |
| C | 14 | 238 | 95102 | 695.52 | 579 | 582 | 135.9 |
| D | 8 | 195 | 457402 | 3302.69 | 588 | 573 | 138.3 |
| D | 2 | 250 | 169051 | 1218.03 | 588 | 573 | 138.3 |
| D | 12 | 218 | 113739 | 818.15 | 588 | 573 | 138.3 |
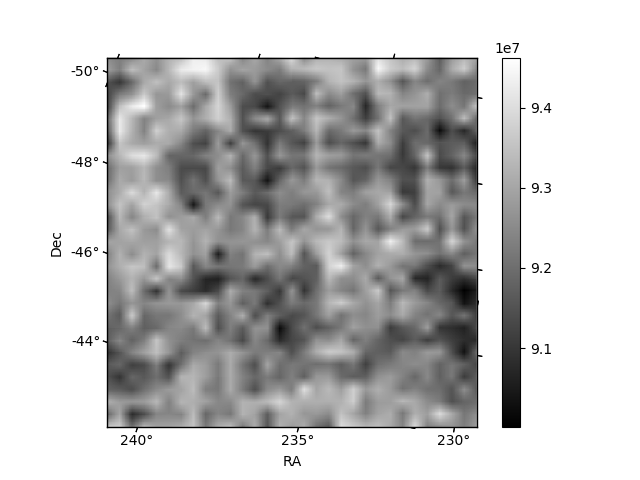
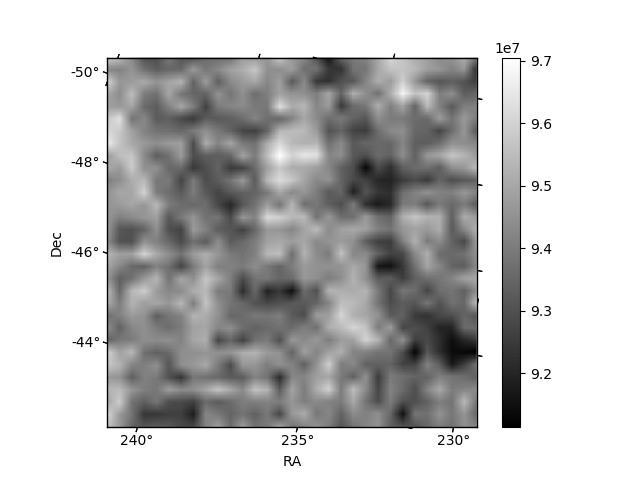
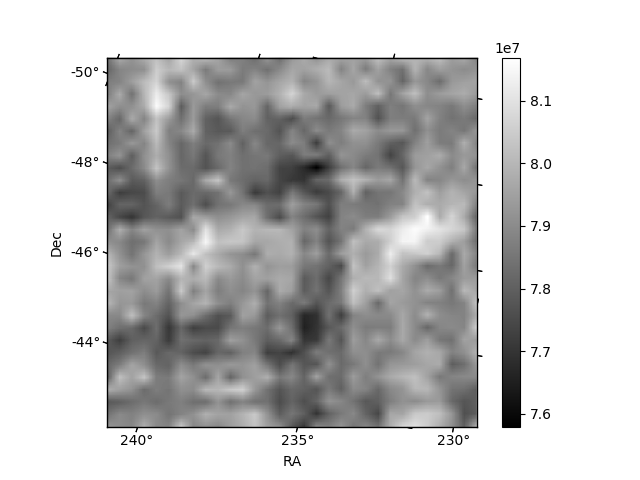
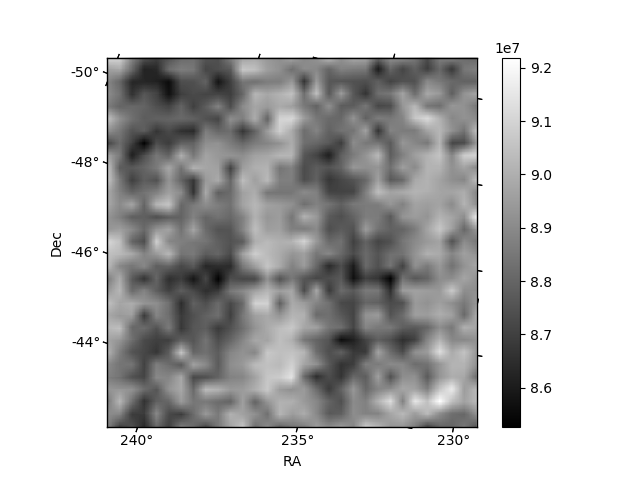
Histogram calculated using DETX and DETY for each event in the final _common_clean file
| Quadrant A | 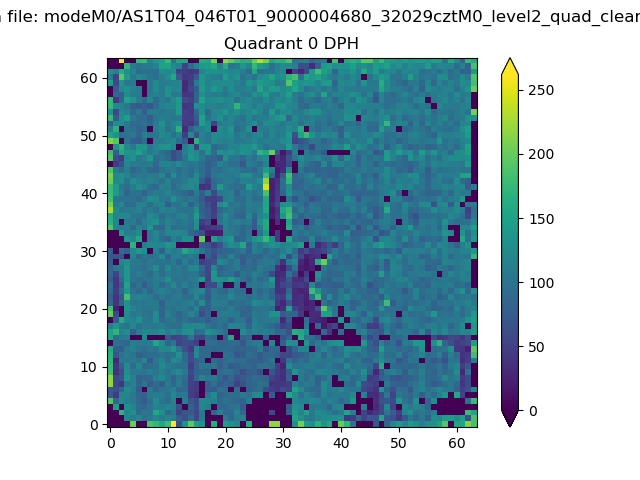 |
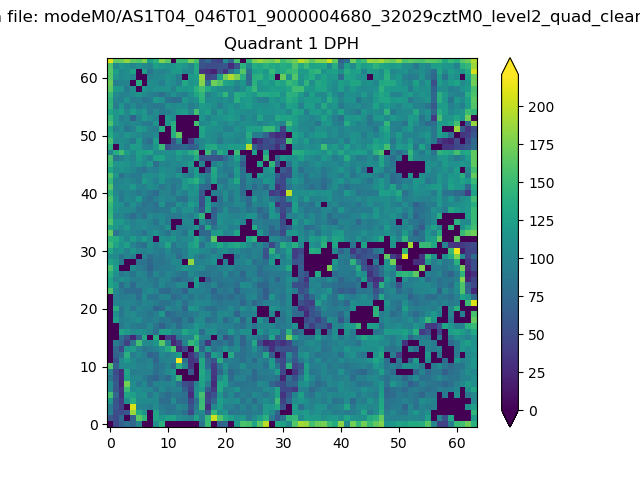 |
Quadrant B |
|---|---|---|---|
| Quadrant D | 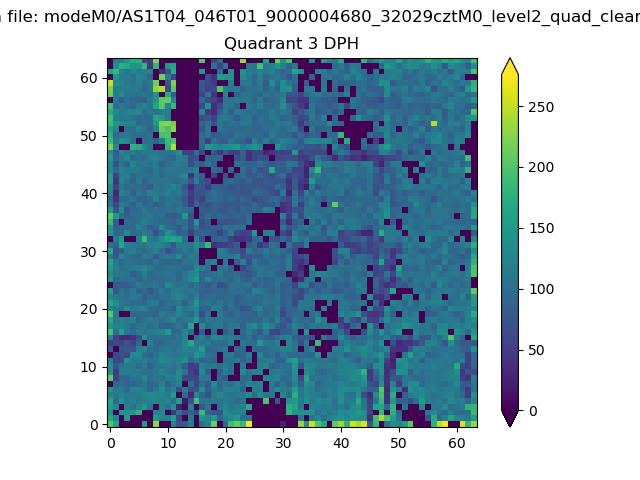 |
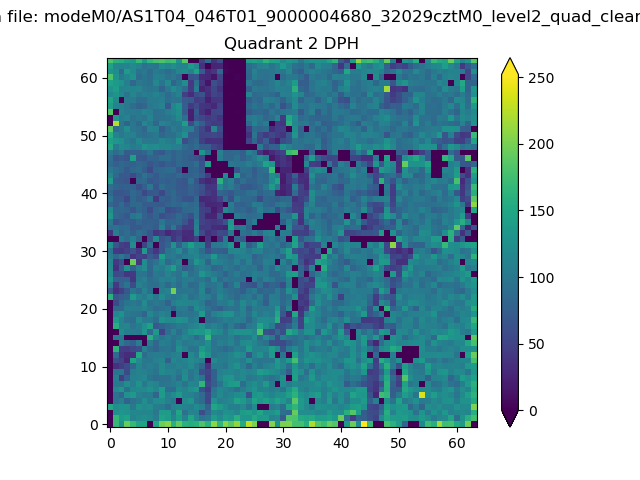 |
Quadrant C |
| Plot type | Count rate plots | Images |
|---|---|---|
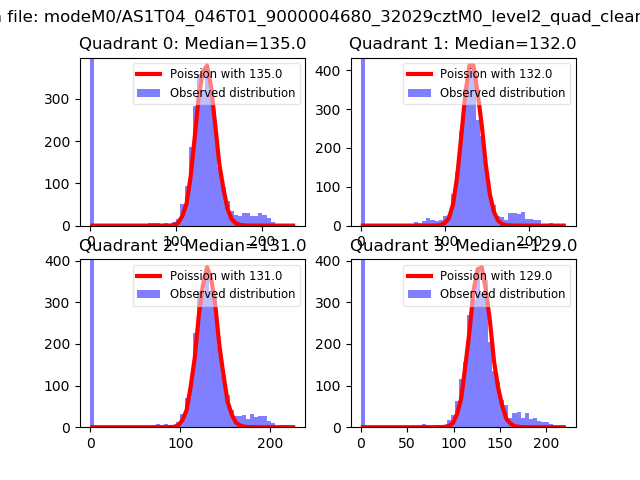
| Comparison with Poisson distribution Blue bars denote a histogram of data divided into 1 sec bins. Red curve is a Poisson curve with rate = median count rate of data. |
 |
 |
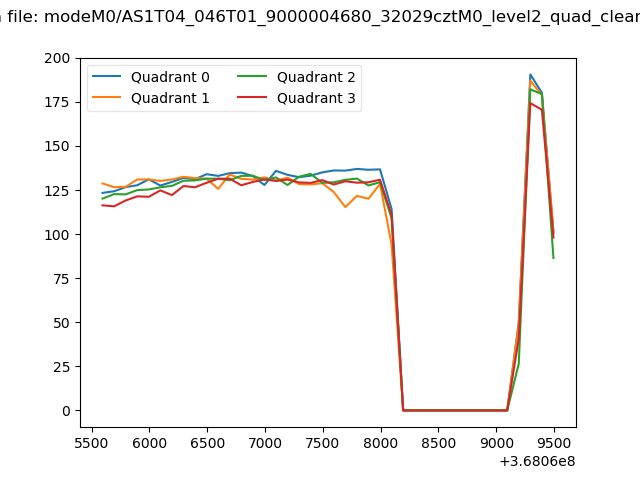
| Quadrant-wise count rates Data is divided into 100 sec bins |
 |
|
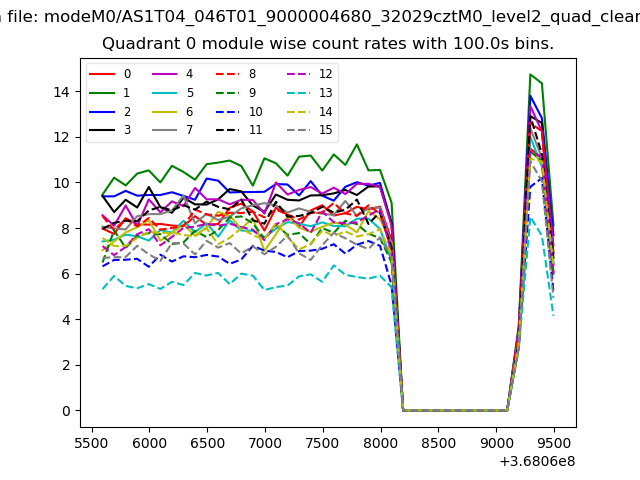
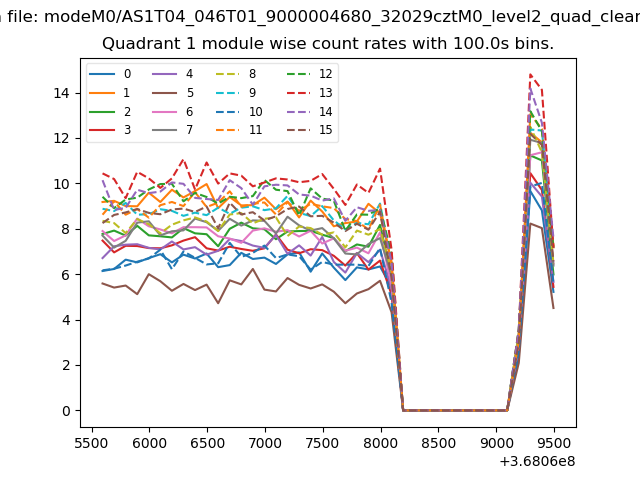
| Module-wise count rates for Quadrant A Data is divided into 100 sec bins |
 |
 |
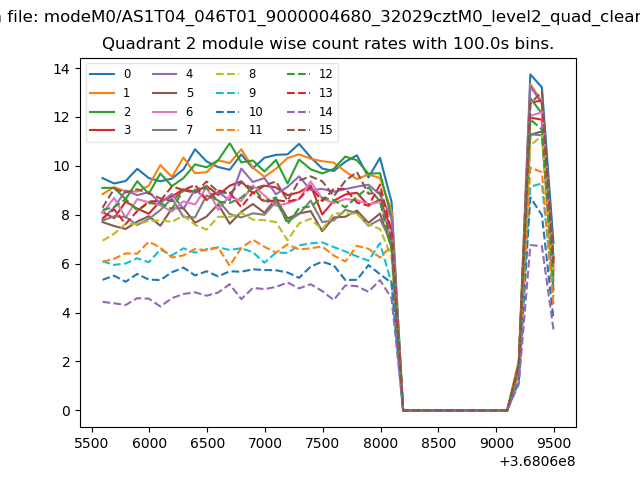
| Module-wise count rates for Quadrant B Data is divided into 100 sec bins |
 |
 |
| Module-wise count rates for Quadrant C Data is divided into 100 sec bins |
 |
 |
| Module-wise count rates for Quadrant D Data is divided into 100 sec bins |
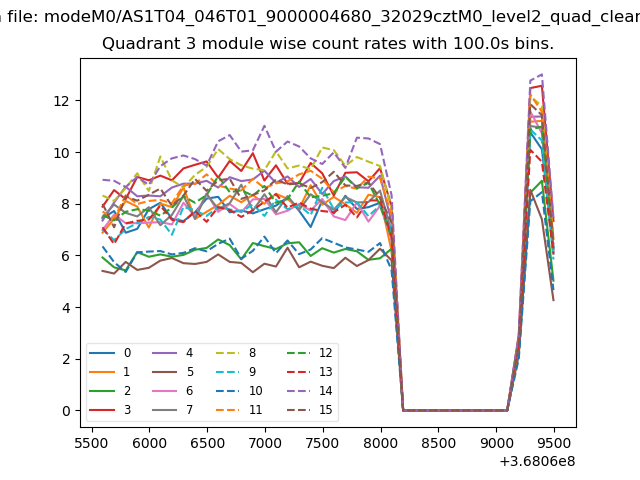 |
 |
| Parameter | Plot |
|---|---|
| CZT HV Monitor | 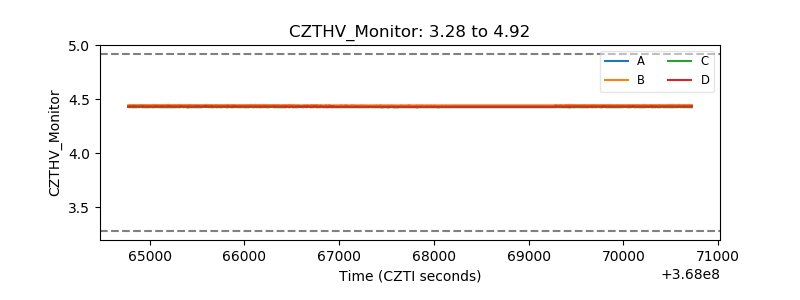 |
| D_VDD | 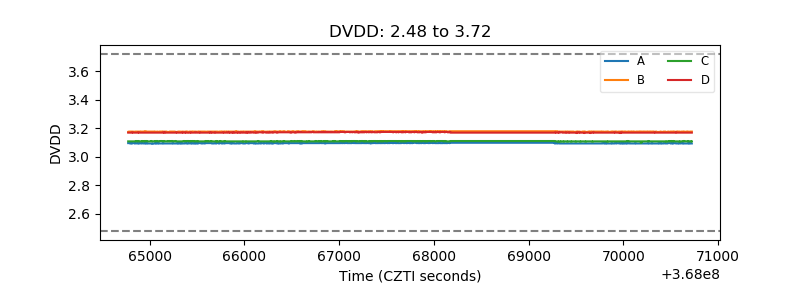 |
| Temperature 1 | 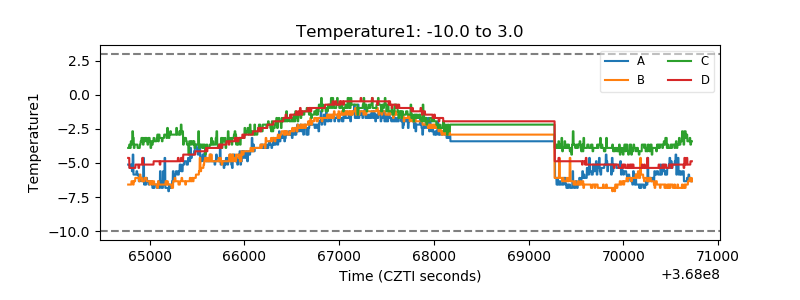 |
| Veto HV Monitor | 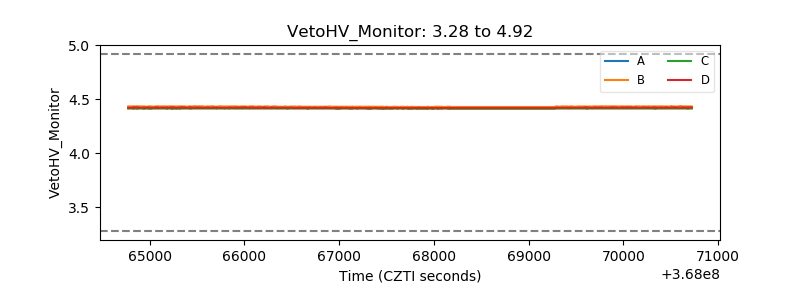 |
| Veto LLD | 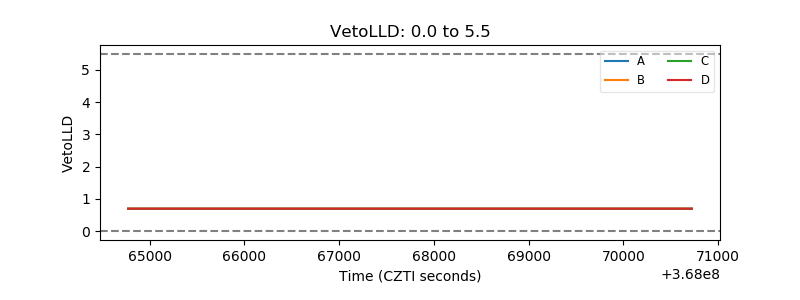 |
| Alpha Counter | 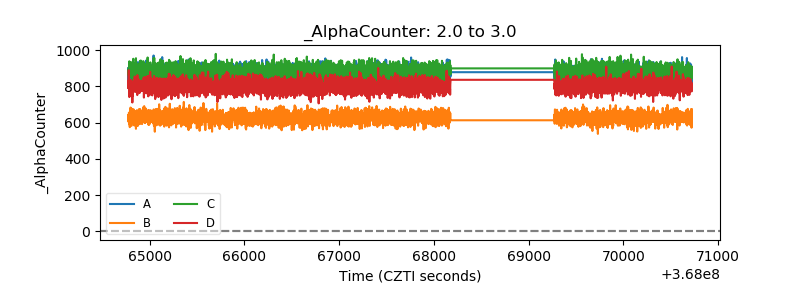 |
| _CPM_Rate | 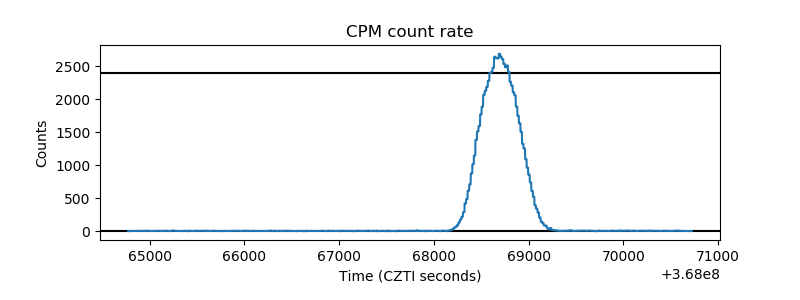 |
| CZT Counter | 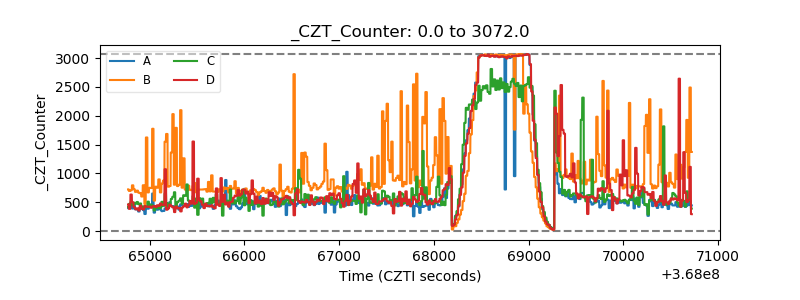 |
| +2.5 Volts monitor | 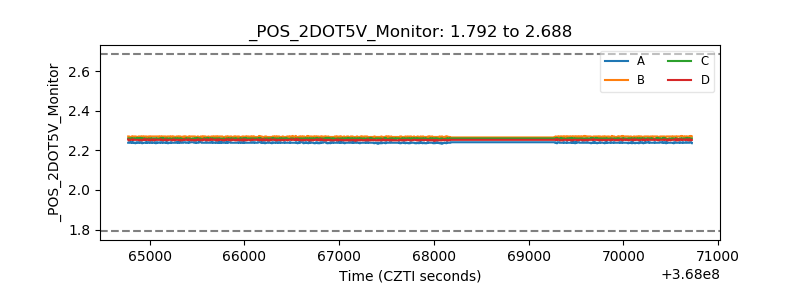 |
| +5 Volts monitor |  |
| _ROLL_ROT | 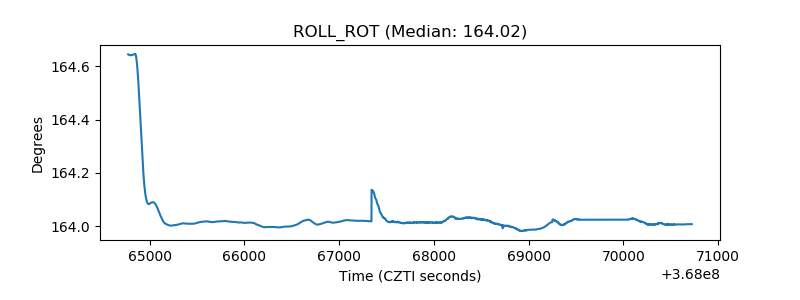 |
| _Roll_DEC | 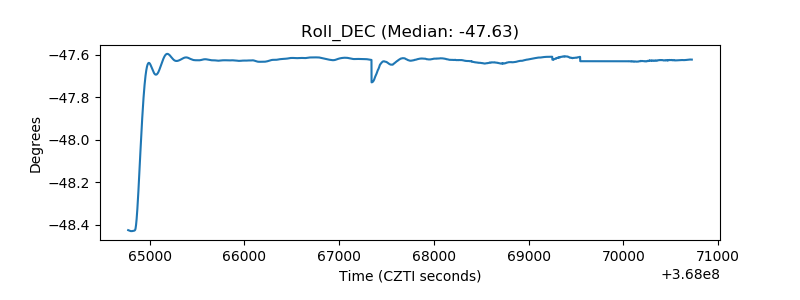 |
| _Roll_RA | 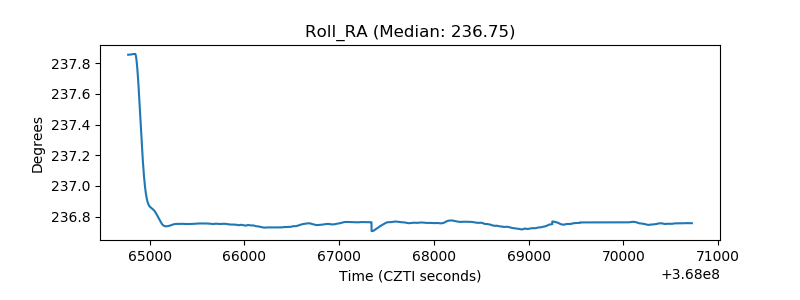 |
| Veto Counter | 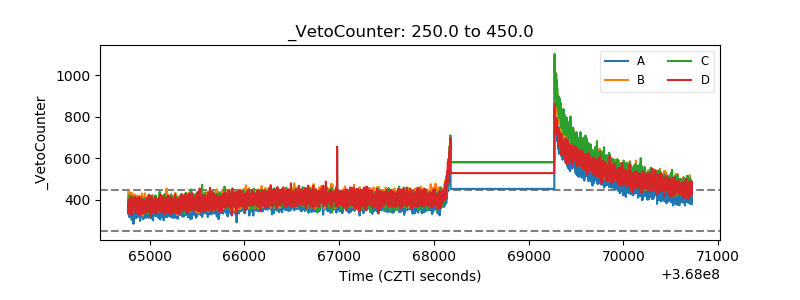 |