| Param | Original file | Final file |
|---|---|---|
| Filename | modeM0/AS1T04_046T01_9000004680_32031cztM0_level2.evt | modeM0/AS1T04_046T01_9000004680_32031cztM0_level2_quad_clean.evt |
| Size (bytes) | 665,216,640 | 66,029,760 |
| Size | 634.4 MB | 63.0 MB |
| Events in quadrant A | 3,218,036 | 406,020 |
| Events in quadrant B | 8,035,284 | 371,134 |
| Events in quadrant C | 4,331,117 | 390,897 |
| Events in quadrant D | 4,134,652 | 389,779 |
| Mode M0 | |||
|---|---|---|---|
| Quadrant | BADHDUFLAG | Total packets | Discarded packets |
| A | 0 | 13295 | 1 |
| B | 0 | 28116 | 1 |
| C | 0 | 17004 | 1 |
| D | 0 | 16098 | 1 |
| Mode M9 | |||
|---|---|---|---|
| Quadrant | BADHDUFLAG | Total packets | Discarded packets |
| A | 0 | 12 | 0 |
| B | 0 | 12 | 0 |
| C | 0 | 12 | 0 |
| D | 0 | 12 | 0 |
| Mode SS | |||
|---|---|---|---|
| Quadrant | BADHDUFLAG | Total packets | Discarded packets |
| A | 0 | 130 | 0 |
| B | 0 | 130 | 0 |
| C | 0 | 130 | 0 |
| D | 0 | 130 | 0 |
| Quadrant | Total seconds | Saturated seconds | Saturation percentage |
|---|---|---|---|
| A | 6313 | 26 | 0.411849% |
| B | 6313 | 1404 | 22.239823% |
| C | 6313 | 229 | 3.627435% |
| D | 6314 | 118 | 1.868863% |
Noise dominated data is calculated using 1-second bins in cleaned event files. If a bin has >2000 counts, and if more than 50% of those come from <1% of pixels, then it is considered to be noise-dominated and hence unusable.
| Quadrant | # 1 sec bins | Bins with >0 counts | Bins with >2000 counts | High rate bins dominated by noise | Noise dominated (total time) | Noise dominated (detector-on time) | Marked lightcurve |
|---|---|---|---|---|---|---|---|
| A | 7528 | 6313 | 0 | 0 | 0.00% | 0.00% | 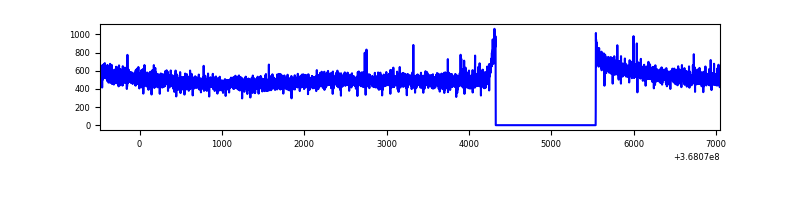 |
| B | 7528 | 6313 | 1046 | 1046 | 13.89% | 16.57% | 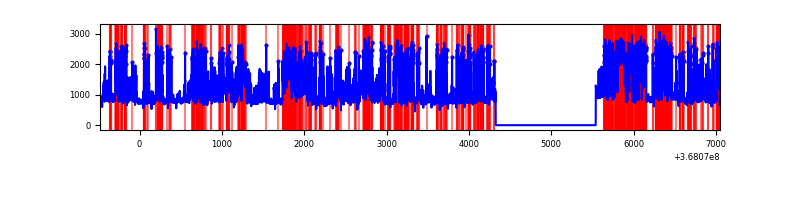 |
| C | 7528 | 6313 | 108 | 108 | 1.43% | 1.71% | 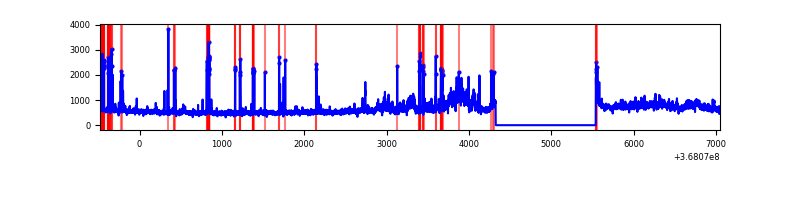 |
| D | 7529 | 6314 | 92 | 92 | 1.22% | 1.46% | 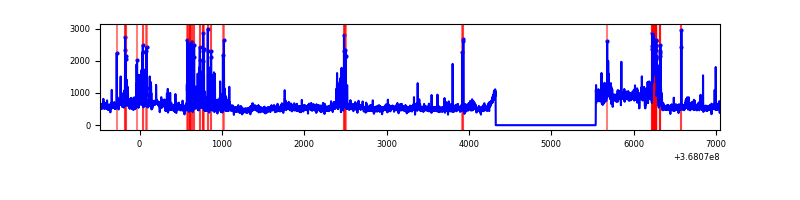 |
Top three noisy pixels from each quadrant. If the there are fewer than three noisy pixels in the level2.evt file, extra rows are filled as -1
| Pixel properties | Quadrant properties | ||||||
|---|---|---|---|---|---|---|---|
| Quadrant | DetID | PixID | Counts | Sigma | Mean | Median | Sigma |
| A | 13 | 6 | 15096 | 87.26 | 830 | 814 | 163.7 |
| A | 13 | 254 | 11036 | 62.45 | 830 | 814 | 163.7 |
| A | 3 | 137 | 7777 | 42.54 | 830 | 814 | 163.7 |
| B | 12 | 18 | 2650763 | 19233.94 | 743 | 728 | 137.8 |
| B | 6 | 159 | 1584978 | 11498.48 | 743 | 728 | 137.8 |
| B | 10 | 245 | 788212 | 5715.55 | 743 | 728 | 137.8 |
| C | 3 | 233 | 743763 | 4093.49 | 792 | 799 | 181.5 |
| C | 0 | 10 | 329287 | 1809.86 | 792 | 799 | 181.5 |
| C | 14 | 238 | 131138 | 718.13 | 792 | 799 | 181.5 |
| D | 8 | 195 | 561530 | 3001.12 | 801 | 782 | 186.8 |
| D | 12 | 218 | 345715 | 1846.08 | 801 | 782 | 186.8 |
| D | 2 | 250 | 109236 | 580.45 | 801 | 782 | 186.8 |
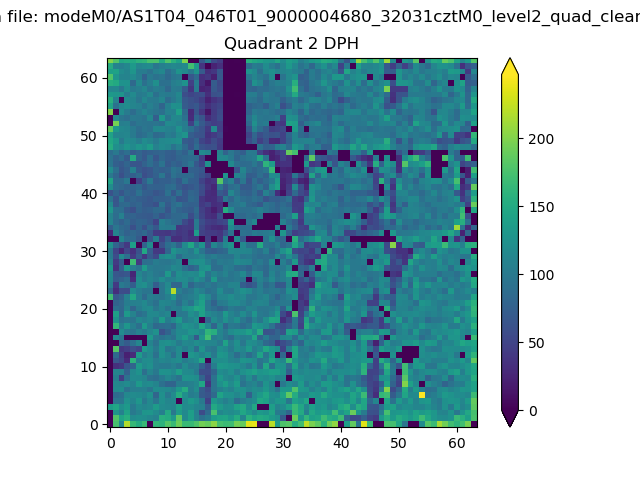
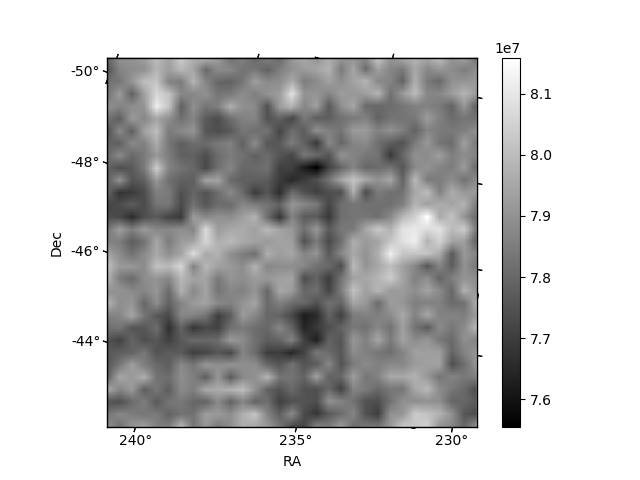
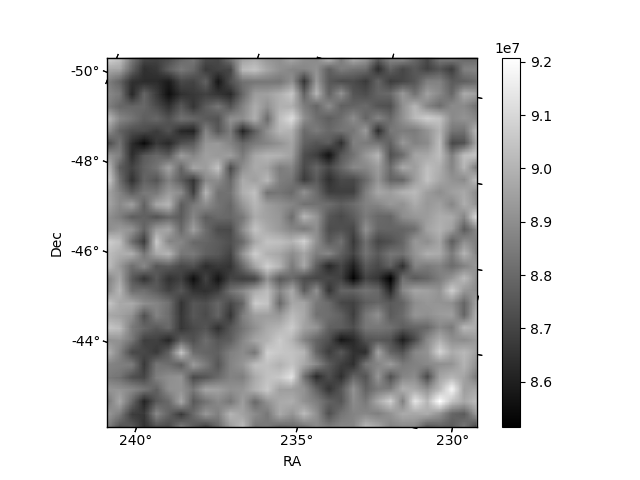
Histogram calculated using DETX and DETY for each event in the final _common_clean file
| Quadrant A | 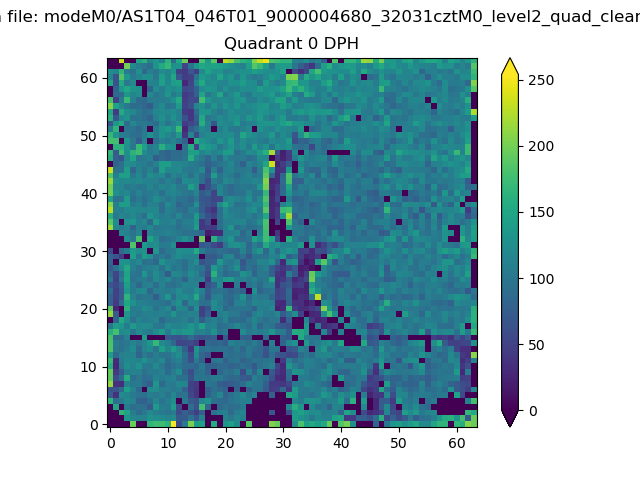 |
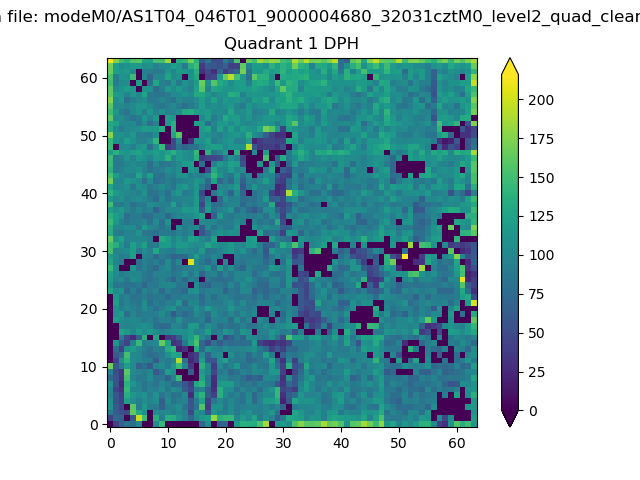 |
Quadrant B |
|---|---|---|---|
| Quadrant D | 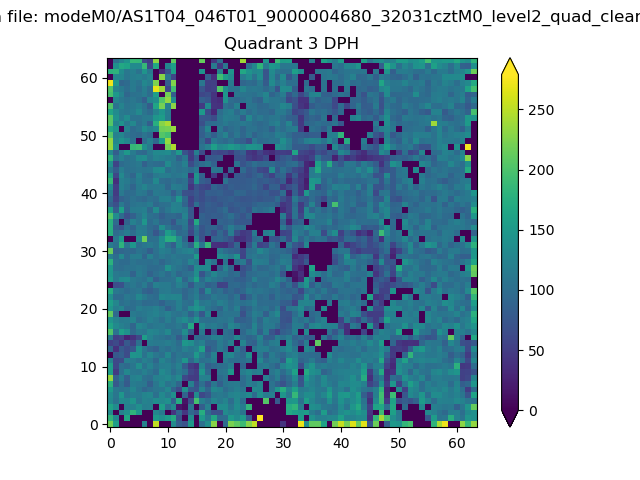 |
 |
Quadrant C |
| Plot type | Count rate plots | Images |
|---|---|---|
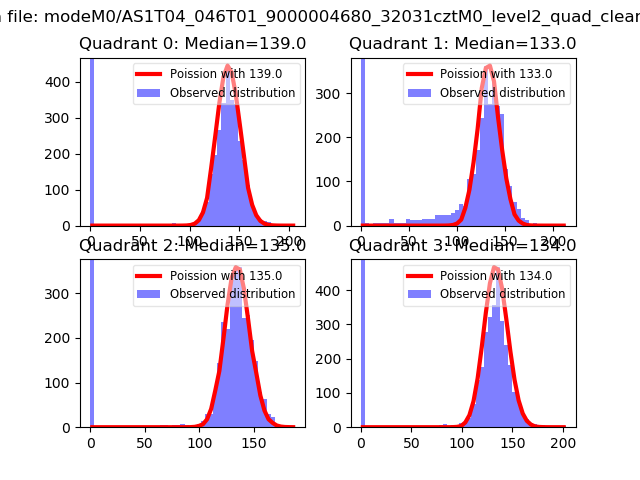
| Comparison with Poisson distribution Blue bars denote a histogram of data divided into 1 sec bins. Red curve is a Poisson curve with rate = median count rate of data. |
 |
 |
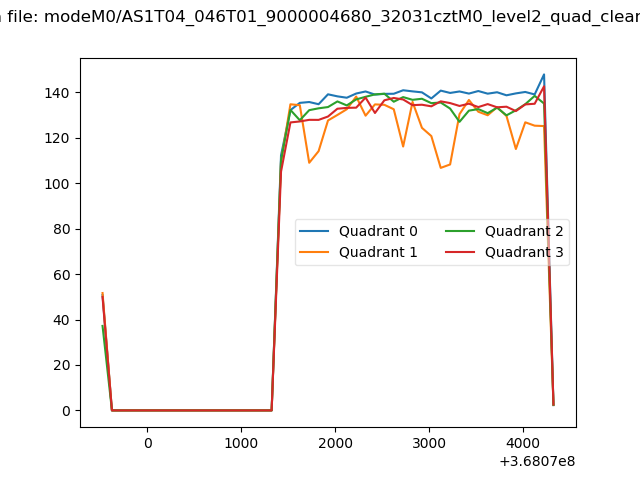
| Quadrant-wise count rates Data is divided into 100 sec bins |
 |
|
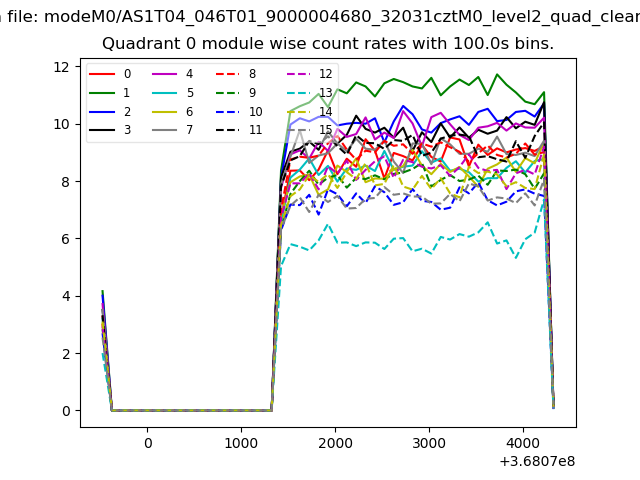
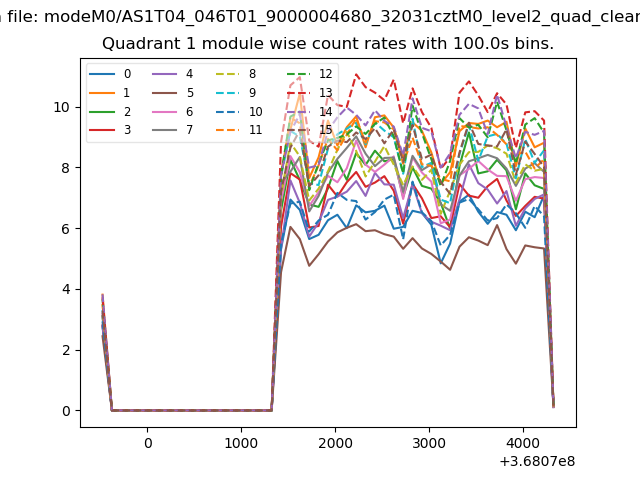
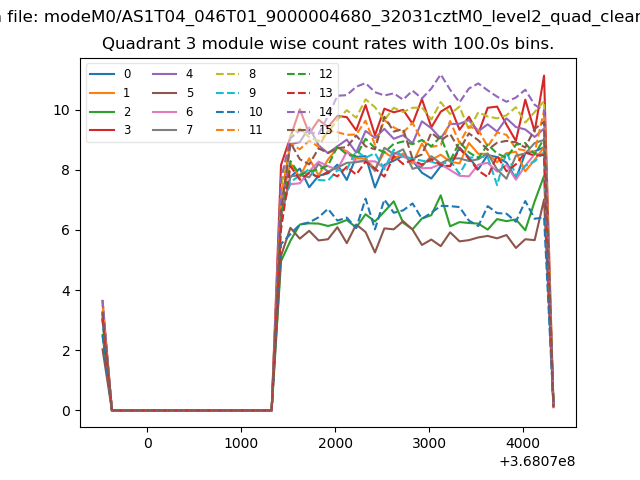
| Module-wise count rates for Quadrant A Data is divided into 100 sec bins |
 |
 |
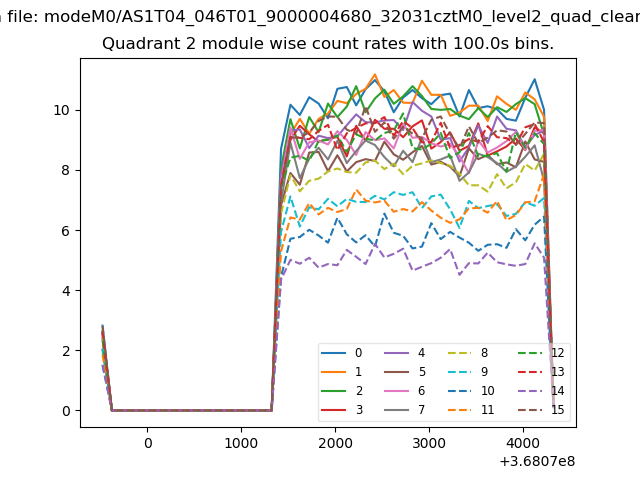
| Module-wise count rates for Quadrant B Data is divided into 100 sec bins |
 |
 |
| Module-wise count rates for Quadrant C Data is divided into 100 sec bins |
 |
 |
| Module-wise count rates for Quadrant D Data is divided into 100 sec bins |
 |
 |
| Parameter | Plot |
|---|---|
| CZT HV Monitor | 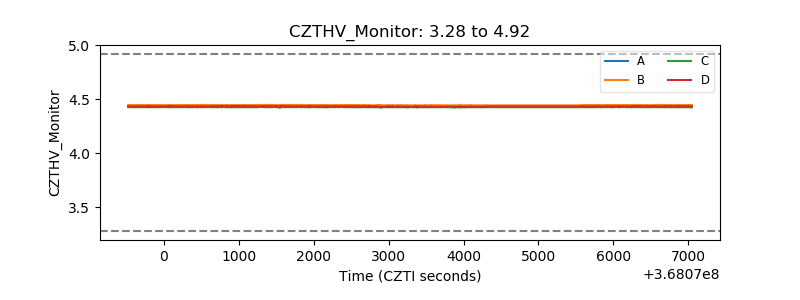 |
| D_VDD | 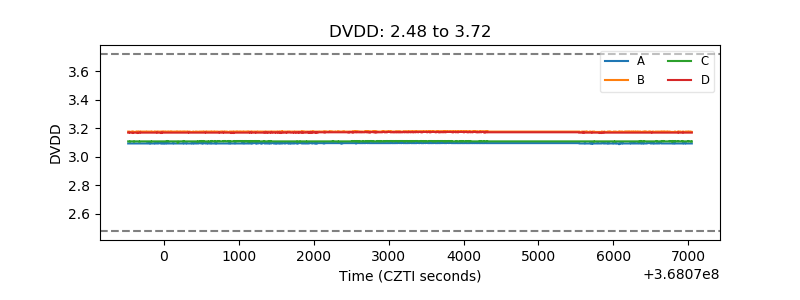 |
| Temperature 1 | 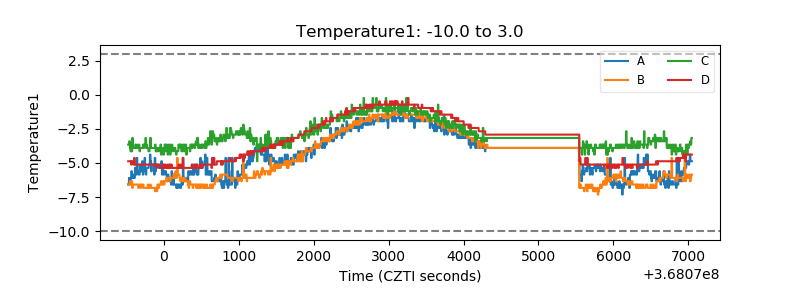 |
| Veto HV Monitor | 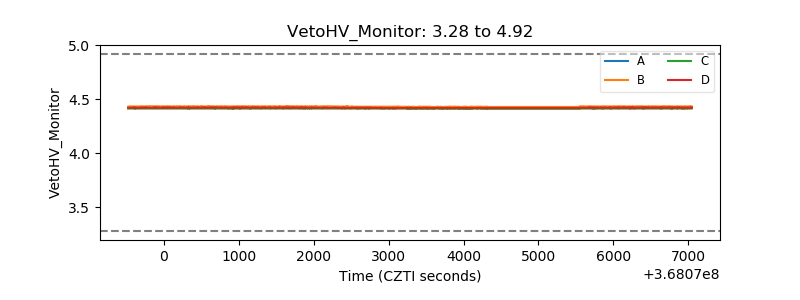 |
| Veto LLD | 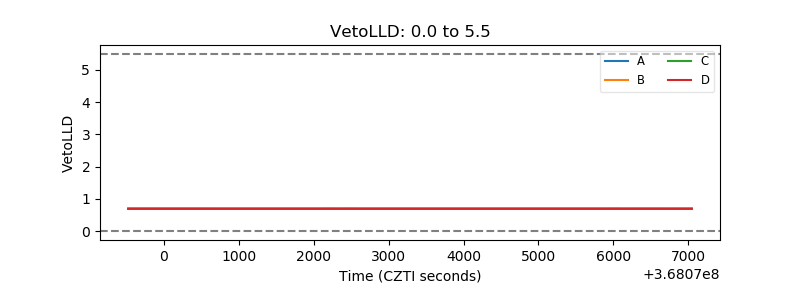 |
| Alpha Counter | 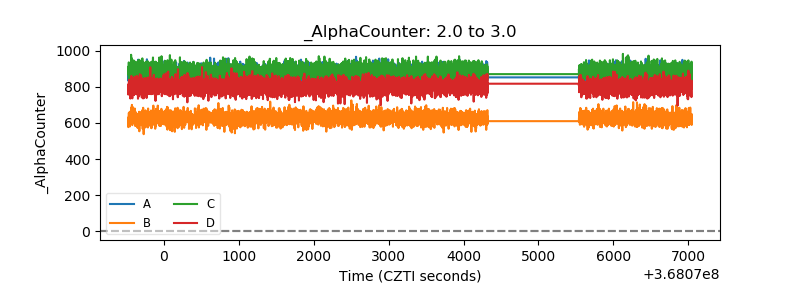 |
| _CPM_Rate | 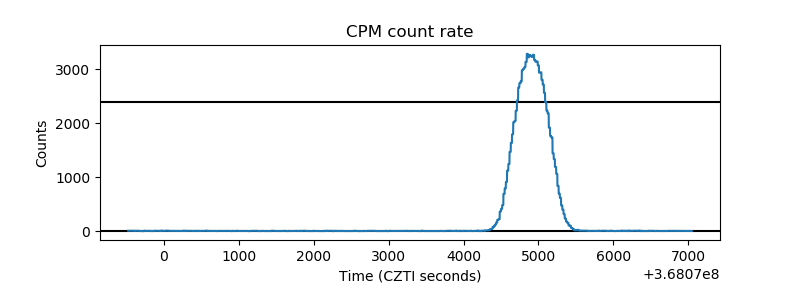 |
| CZT Counter | 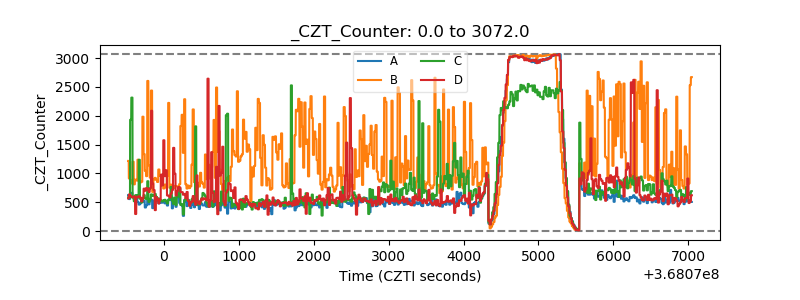 |
| +2.5 Volts monitor |  |
| +5 Volts monitor |  |
| _ROLL_ROT | 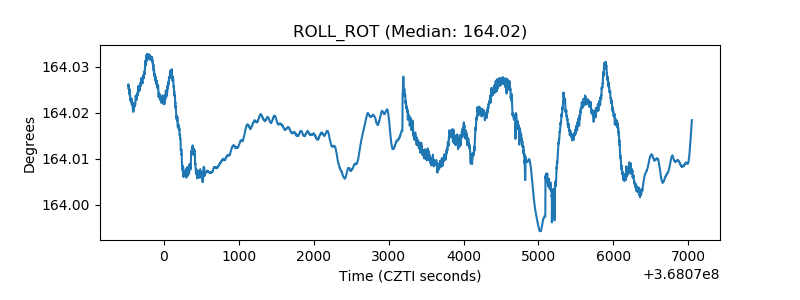 |
| _Roll_DEC | 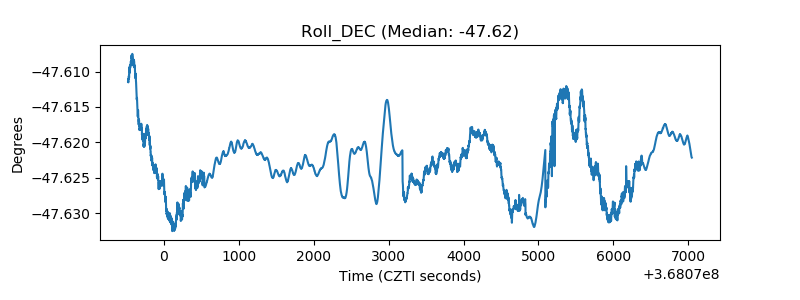 |
| _Roll_RA | 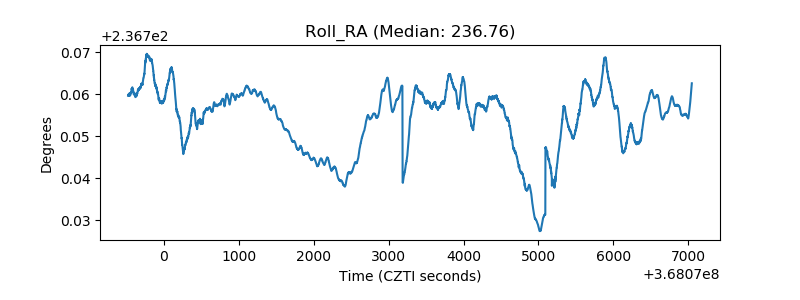 |
| Veto Counter | 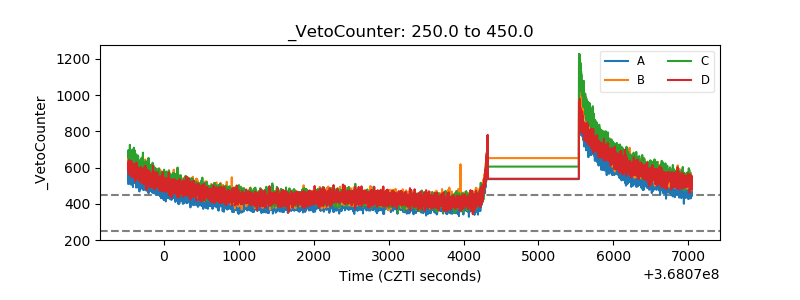 |