| Param | Original file | Final file |
|---|---|---|
| Filename | modeM0/AS1T04_046T01_9000004680_32032cztM0_level2.evt | modeM0/AS1T04_046T01_9000004680_32032cztM0_level2_quad_clean.evt |
| Size (bytes) | 681,068,160 | 76,510,080 |
| Size | 649.5 MB | 73.0 MB |
| Events in quadrant A | 3,486,269 | 480,921 |
| Events in quadrant B | 7,277,948 | 458,496 |
| Events in quadrant C | 4,467,267 | 469,475 |
| Events in quadrant D | 4,964,784 | 463,346 |
| Mode M0 | |||
|---|---|---|---|
| Quadrant | BADHDUFLAG | Total packets | Discarded packets |
| A | 0 | 14196 | 2 |
| B | 0 | 25805 | 2 |
| C | 0 | 18026 | 2 |
| D | 0 | 18959 | 2 |
| Mode M9 | |||
|---|---|---|---|
| Quadrant | BADHDUFLAG | Total packets | Discarded packets |
| A | 0 | 13 | 0 |
| B | 0 | 14 | 0 |
| C | 0 | 14 | 0 |
| D | 0 | 14 | 0 |
| Mode SS | |||
|---|---|---|---|
| Quadrant | BADHDUFLAG | Total packets | Discarded packets |
| A | 0 | 130 | 0 |
| B | 0 | 130 | 0 |
| C | 0 | 130 | 0 |
| D | 0 | 130 | 0 |
| Quadrant | Total seconds | Saturated seconds | Saturation percentage |
|---|---|---|---|
| A | 6366 | 40 | 0.628338% |
| B | 6366 | 1167 | 18.331762% |
| C | 6366 | 213 | 3.345900% |
| D | 6366 | 229 | 3.597235% |
Noise dominated data is calculated using 1-second bins in cleaned event files. If a bin has >2000 counts, and if more than 50% of those come from <1% of pixels, then it is considered to be noise-dominated and hence unusable.
| Quadrant | # 1 sec bins | Bins with >0 counts | Bins with >2000 counts | High rate bins dominated by noise | Noise dominated (total time) | Noise dominated (detector-on time) | Marked lightcurve |
|---|---|---|---|---|---|---|---|
| A | 7651 | 6366 | 0 | 0 | 0.00% | 0.00% | 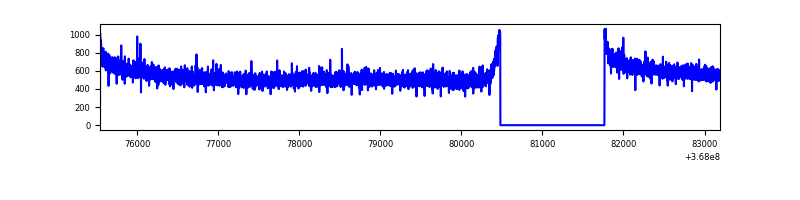 |
| B | 7650 | 6365 | 860 | 860 | 11.24% | 13.51% | 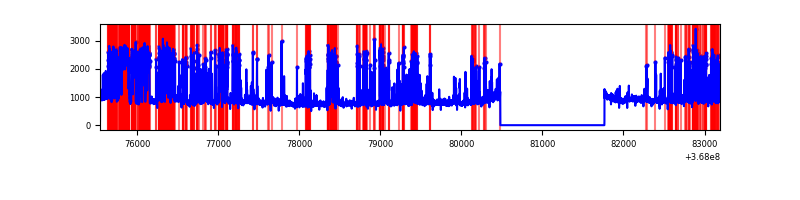 |
| C | 7651 | 6366 | 38 | 38 | 0.50% | 0.60% | 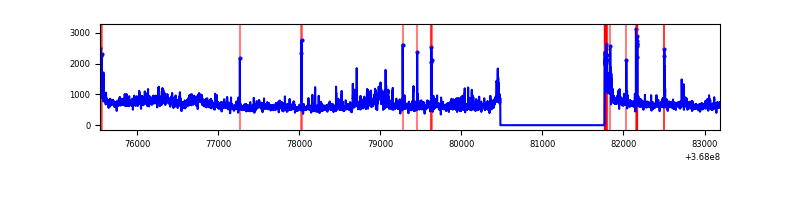 |
| D | 7651 | 6366 | 177 | 177 | 2.31% | 2.78% | 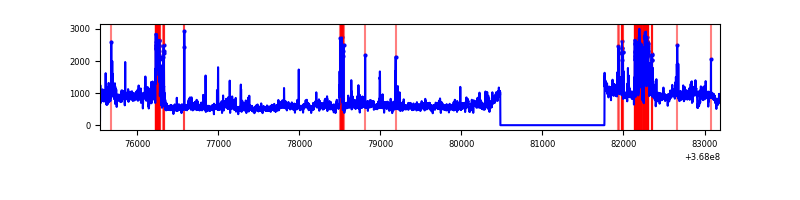 |
Top three noisy pixels from each quadrant. If the there are fewer than three noisy pixels in the level2.evt file, extra rows are filled as -1
| Pixel properties | Quadrant properties | ||||||
|---|---|---|---|---|---|---|---|
| Quadrant | DetID | PixID | Counts | Sigma | Mean | Median | Sigma |
| A | 13 | 254 | 12068 | 62.75 | 901 | 885 | 178.2 |
| A | 13 | 6 | 11135 | 57.51 | 901 | 885 | 178.2 |
| A | 3 | 137 | 7921 | 39.48 | 901 | 885 | 178.2 |
| B | 12 | 18 | 2116799 | 14284.63 | 811 | 795 | 148.1 |
| B | 6 | 159 | 1569223 | 10588.08 | 811 | 795 | 148.1 |
| B | 0 | 190 | 189892 | 1276.55 | 811 | 795 | 148.1 |
| C | 3 | 233 | 710368 | 3601.7 | 866 | 874 | 197.0 |
| C | 0 | 10 | 190291 | 961.56 | 866 | 874 | 197.0 |
| C | 14 | 238 | 143994 | 726.54 | 866 | 874 | 197.0 |
| D | 8 | 195 | 1031543 | 5121.29 | 867 | 847 | 201.3 |
| D | 12 | 218 | 546518 | 2711.31 | 867 | 847 | 201.3 |
| D | 2 | 250 | 41081 | 199.91 | 867 | 847 | 201.3 |
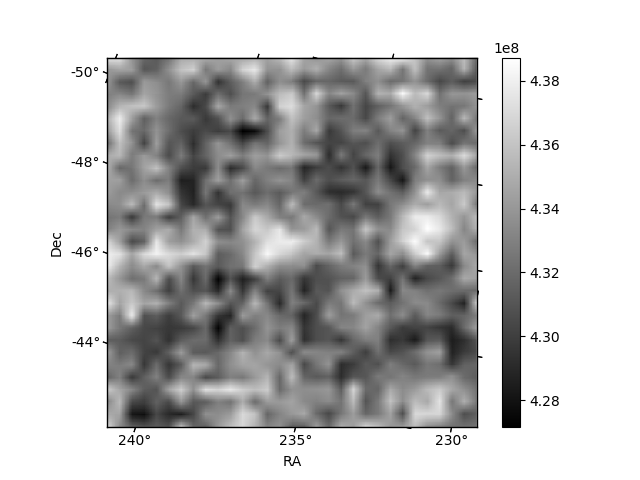
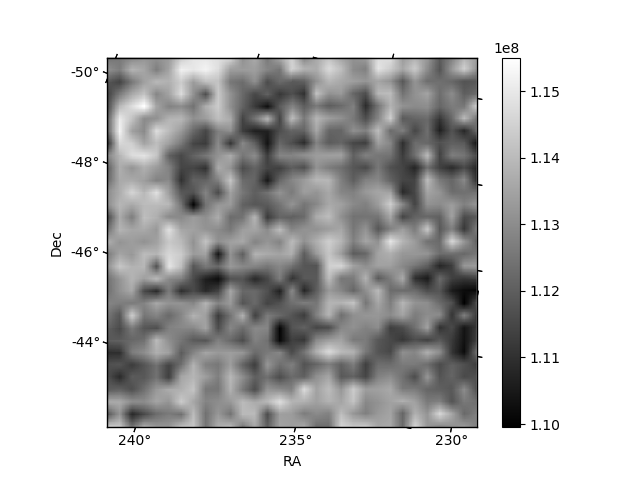
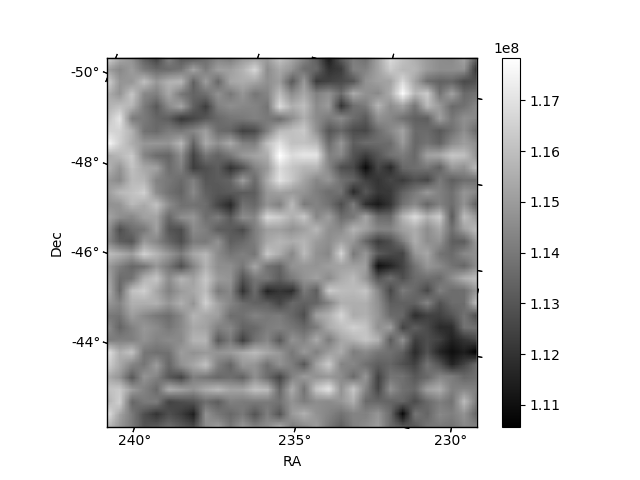
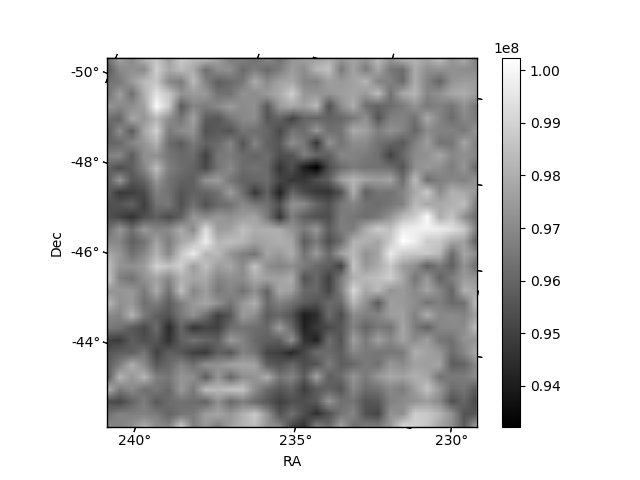
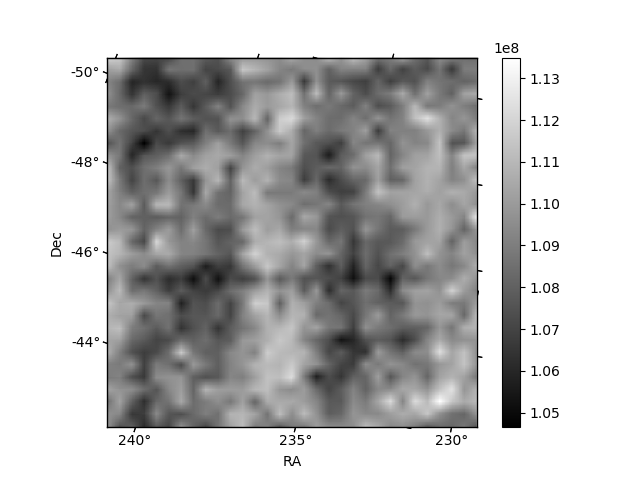
Histogram calculated using DETX and DETY for each event in the final _common_clean file
| Quadrant A | 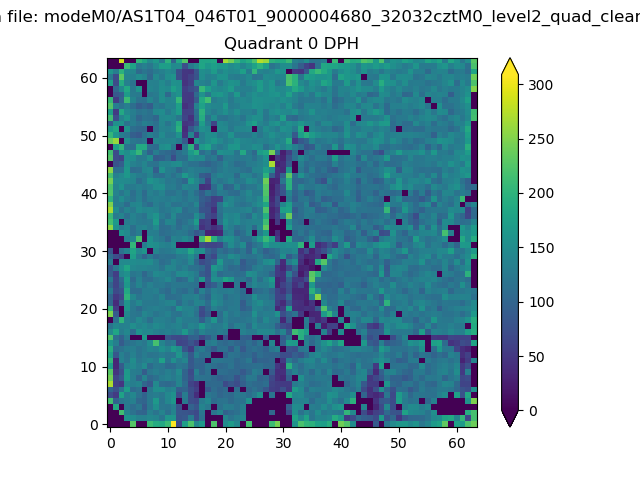 |
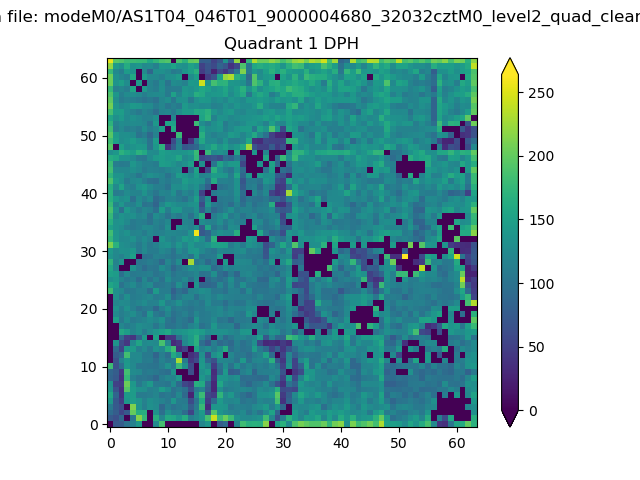 |
Quadrant B |
|---|---|---|---|
| Quadrant D | 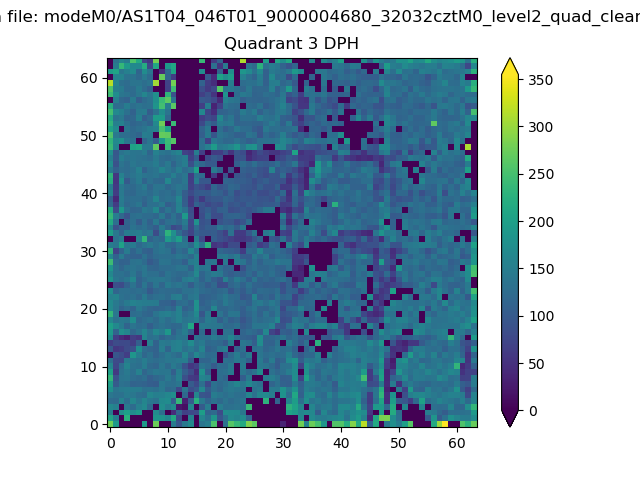 |
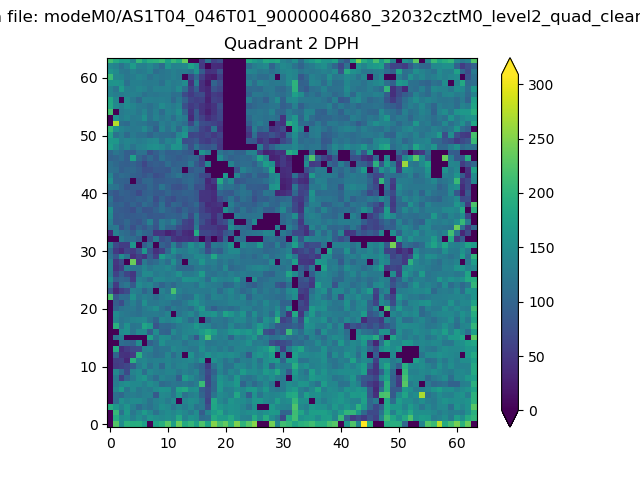 |
Quadrant C |
| Plot type | Count rate plots | Images |
|---|---|---|
| Comparison with Poisson distribution Blue bars denote a histogram of data divided into 1 sec bins. Red curve is a Poisson curve with rate = median count rate of data. |
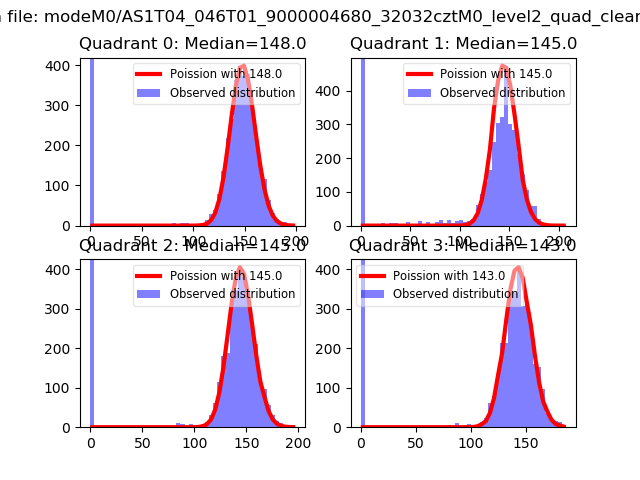 |
 |
| Quadrant-wise count rates Data is divided into 100 sec bins |
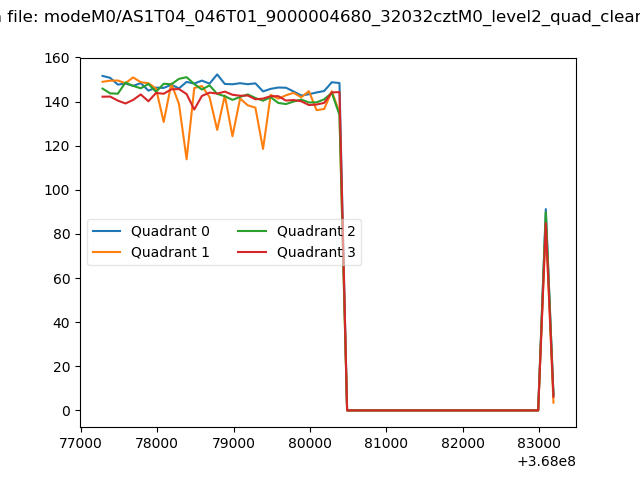 |
|
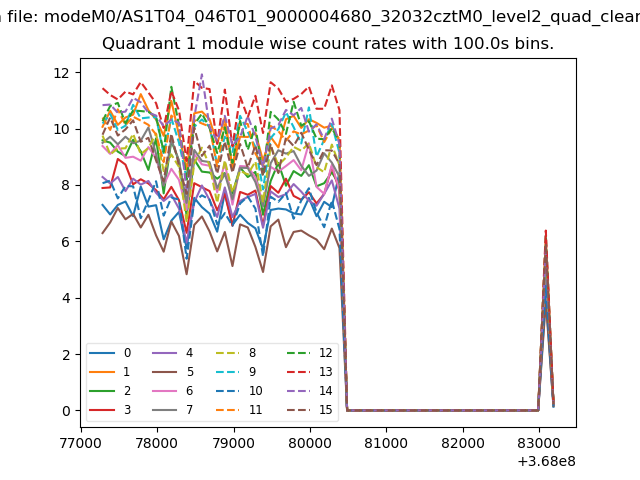
| Module-wise count rates for Quadrant A Data is divided into 100 sec bins |
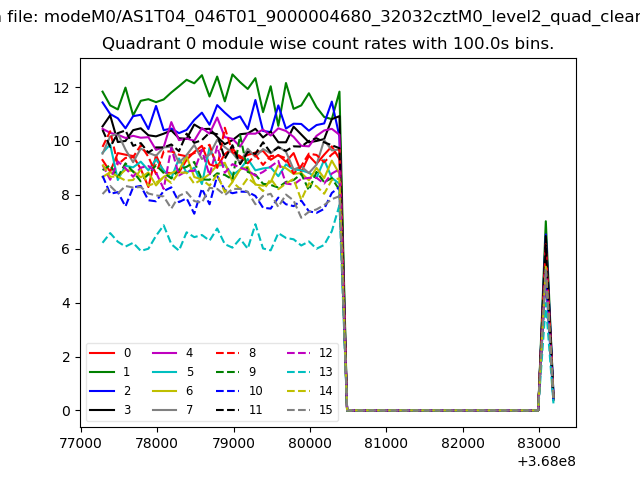 |
 |
| Module-wise count rates for Quadrant B Data is divided into 100 sec bins |
 |
 |
| Module-wise count rates for Quadrant C Data is divided into 100 sec bins |
 |
 |
| Module-wise count rates for Quadrant D Data is divided into 100 sec bins |
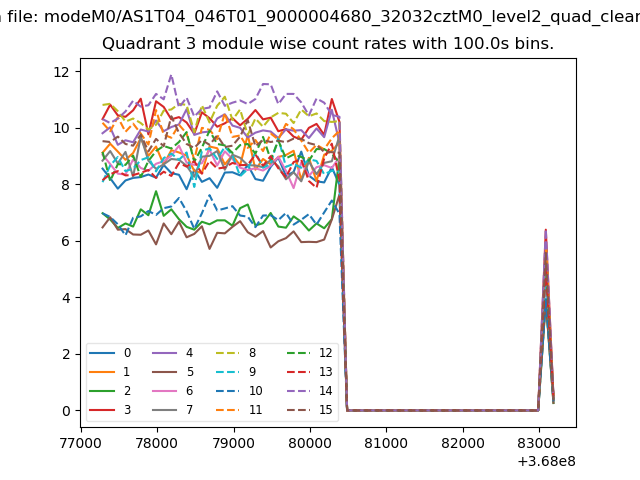 |
 |
| Parameter | Plot |
|---|---|
| CZT HV Monitor | 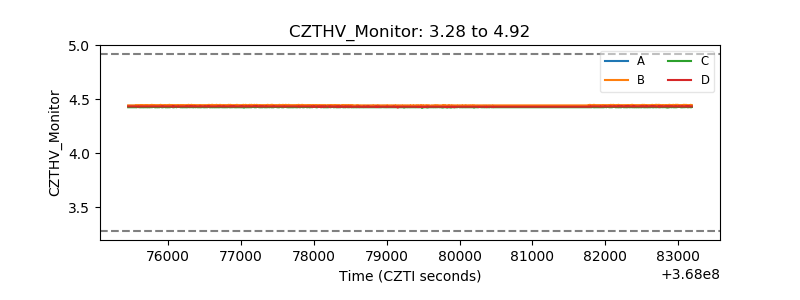 |
| D_VDD | 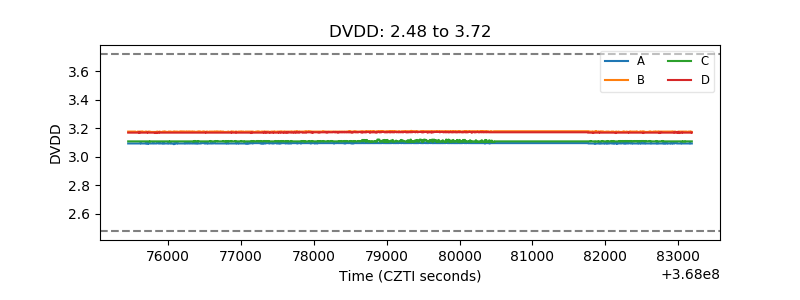 |
| Temperature 1 | 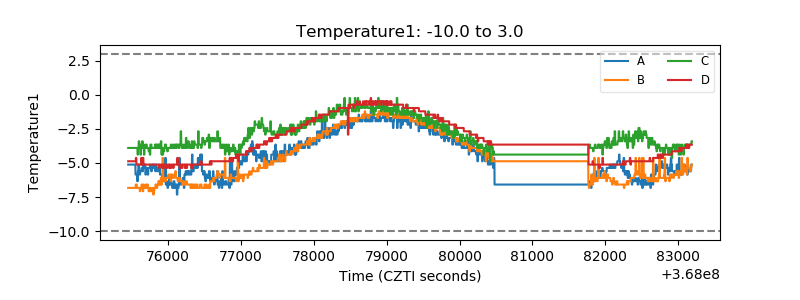 |
| Veto HV Monitor | 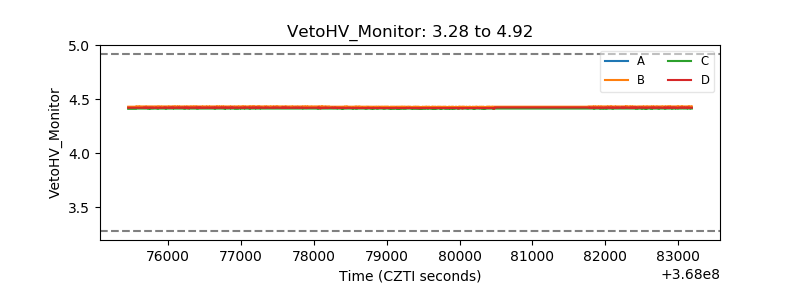 |
| Veto LLD | 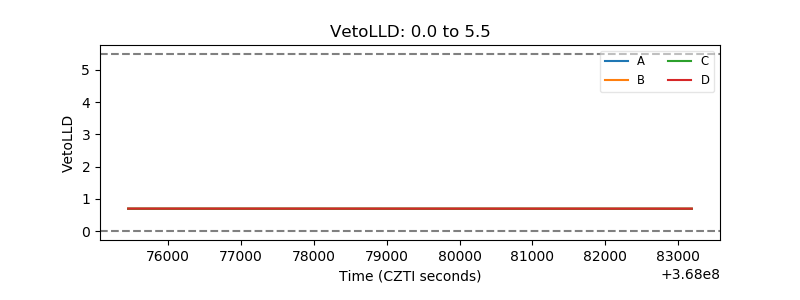 |
| Alpha Counter | 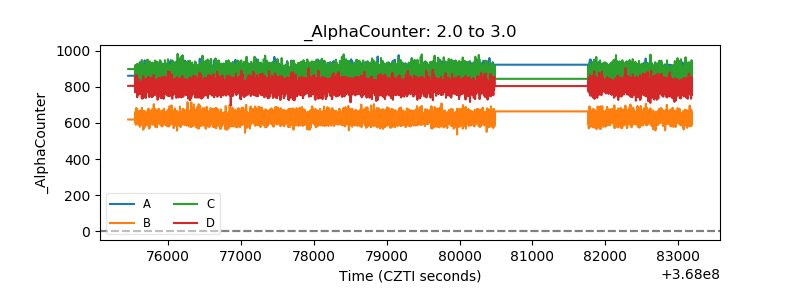 |
| _CPM_Rate |  |
| CZT Counter | 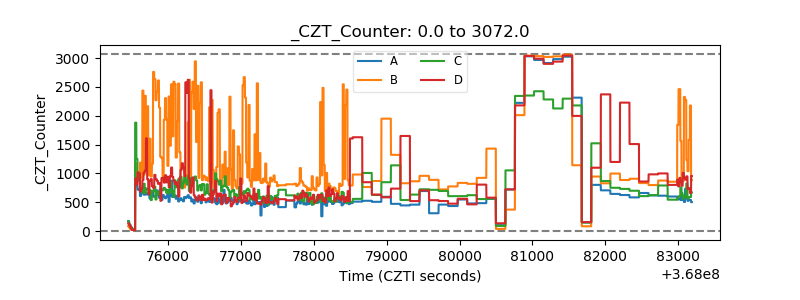 |
| +2.5 Volts monitor |  |
| +5 Volts monitor |  |
| _ROLL_ROT | 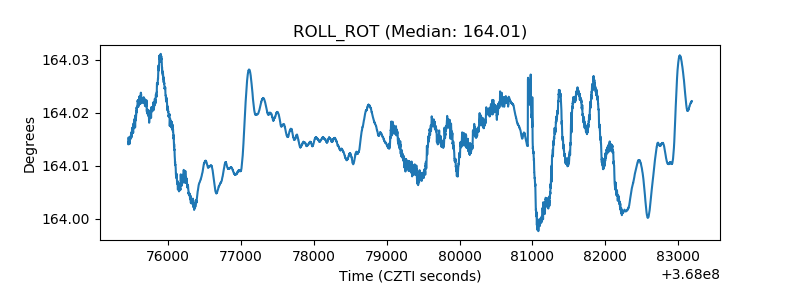 |
| _Roll_DEC | 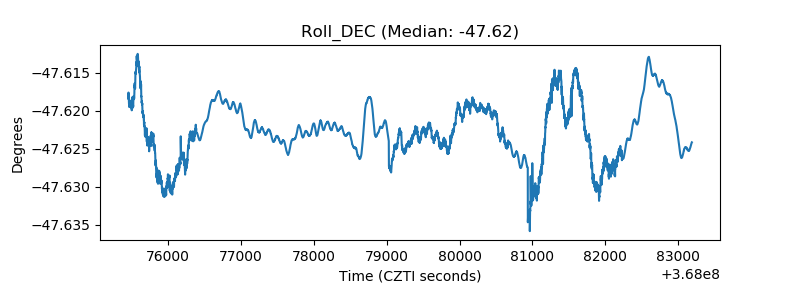 |
| _Roll_RA | 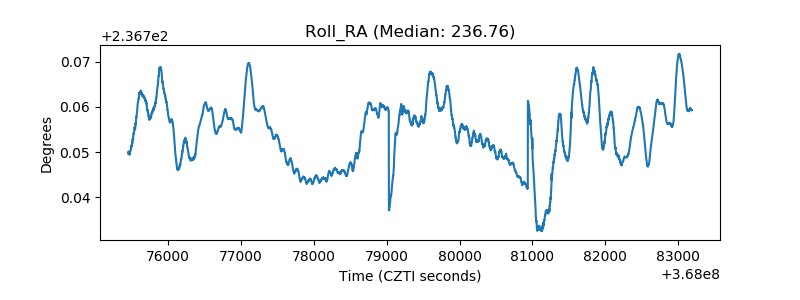 |
| Veto Counter | 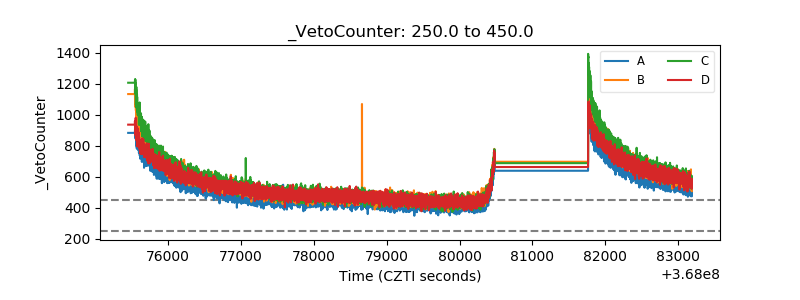 |