| Param | Original file | Final file |
|---|---|---|
| Filename | modeM0/AS1T04_046T01_9000004680_32033cztM0_level2.evt | modeM0/AS1T04_046T01_9000004680_32033cztM0_level2_quad_clean.evt |
| Size (bytes) | 579,853,440 | 73,840,320 |
| Size | 553.0 MB | 70.4 MB |
| Events in quadrant A | 3,099,470 | 482,247 |
| Events in quadrant B | 5,416,489 | 453,481 |
| Events in quadrant C | 3,887,858 | 469,025 |
| Events in quadrant D | 4,794,694 | 455,274 |
| Mode M0 | |||
|---|---|---|---|
| Quadrant | BADHDUFLAG | Total packets | Discarded packets |
| A | 0 | 12654 | 91 |
| B | 0 | 19723 | 194 |
| C | 0 | 15577 | 112 |
| D | 0 | 17900 | 103 |
| Mode M9 | |||
|---|---|---|---|
| Quadrant | BADHDUFLAG | Total packets | Discarded packets |
| A | 0 | 17 | 1 |
| B | 0 | 17 | 0 |
| C | 0 | 17 | 0 |
| D | 0 | 17 | 0 |
| Mode SS | |||
|---|---|---|---|
| Quadrant | BADHDUFLAG | Total packets | Discarded packets |
| A | 0 | 109 | 1 |
| B | 0 | 108 | 0 |
| C | 0 | 108 | 0 |
| D | 0 | 108 | 0 |
| Quadrant | Total seconds | Saturated seconds | Saturation percentage |
|---|---|---|---|
| A | 5377 | 82 | 1.525014% |
| B | 5356 | 628 | 11.725168% |
| C | 5374 | 309 | 5.749907% |
| D | 5371 | 237 | 4.412586% |
Noise dominated data is calculated using 1-second bins in cleaned event files. If a bin has >2000 counts, and if more than 50% of those come from <1% of pixels, then it is considered to be noise-dominated and hence unusable.
| Quadrant | # 1 sec bins | Bins with >0 counts | Bins with >2000 counts | High rate bins dominated by noise | Noise dominated (total time) | Noise dominated (detector-on time) | Marked lightcurve |
|---|---|---|---|---|---|---|---|
| A | 7573 | 5387 | 0 | 0 | 0.00% | 0.00% | 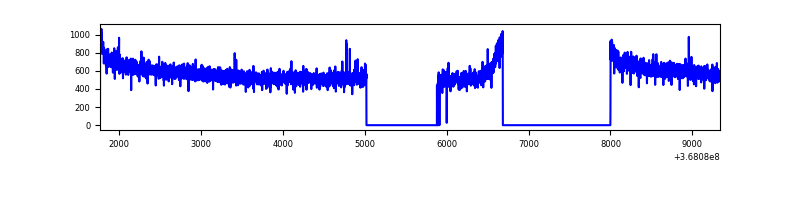 |
| B | 7573 | 5373 | 326 | 326 | 4.30% | 6.07% | 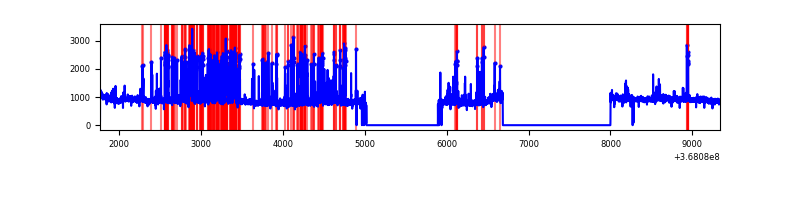 |
| C | 7573 | 5388 | 32 | 32 | 0.42% | 0.59% | 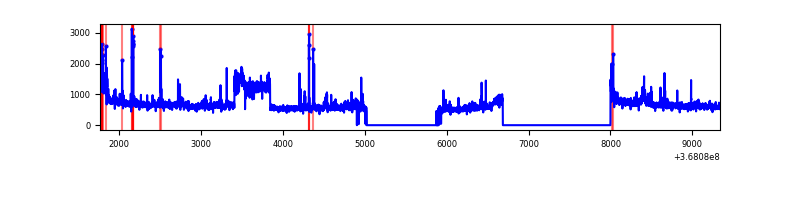 |
| D | 7573 | 5382 | 159 | 159 | 2.10% | 2.95% | 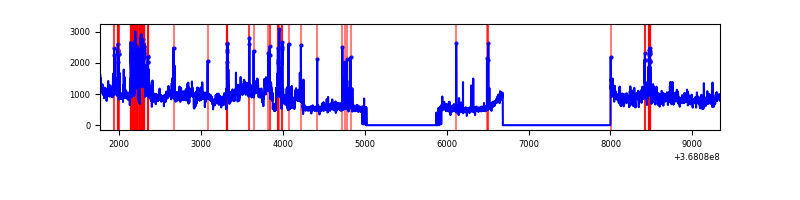 |
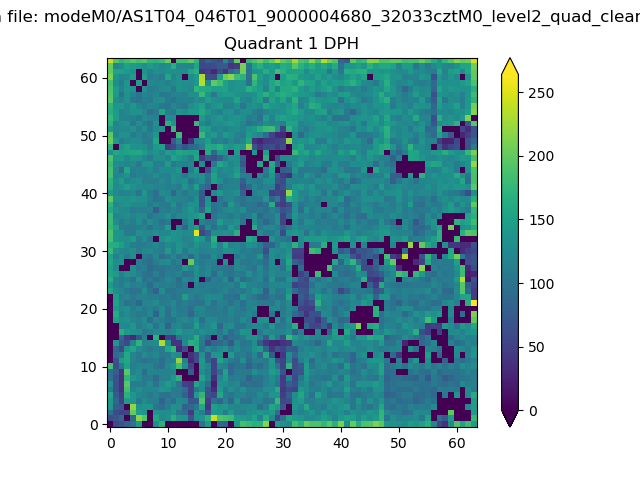
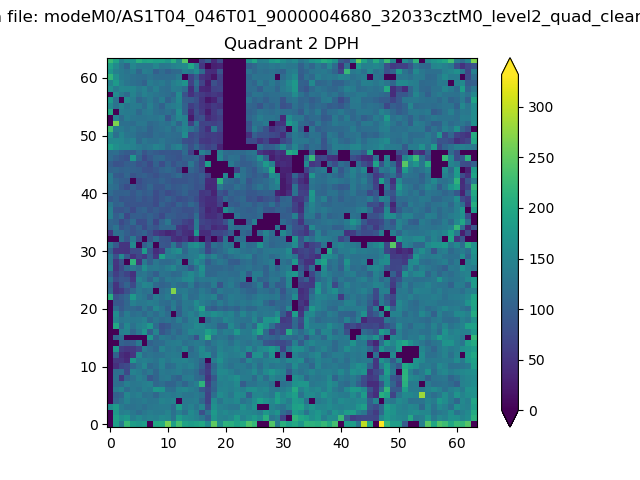
Top three noisy pixels from each quadrant. If the there are fewer than three noisy pixels in the level2.evt file, extra rows are filled as -1
| Pixel properties | Quadrant properties | ||||||
|---|---|---|---|---|---|---|---|
| Quadrant | DetID | PixID | Counts | Sigma | Mean | Median | Sigma |
| A | 13 | 6 | 14445 | 87.54 | 799 | 787 | 156.0 |
| A | 13 | 254 | 10100 | 59.69 | 799 | 787 | 156.0 |
| A | 3 | 137 | 6992 | 39.77 | 799 | 787 | 156.0 |
| B | 6 | 159 | 1360077 | 9887.89 | 750 | 734 | 137.5 |
| B | 12 | 18 | 937340 | 6812.89 | 750 | 734 | 137.5 |
| B | 0 | 190 | 79431 | 572.44 | 750 | 734 | 137.5 |
| C | 3 | 233 | 539362 | 3083.68 | 767 | 775 | 174.7 |
| C | 0 | 10 | 157619 | 898.01 | 767 | 775 | 174.7 |
| C | 14 | 238 | 128979 | 734.03 | 767 | 775 | 174.7 |
| D | 8 | 195 | 1280801 | 7141.45 | 772 | 755 | 179.2 |
| D | 12 | 218 | 392019 | 2182.89 | 772 | 755 | 179.2 |
| D | 2 | 250 | 173792 | 965.38 | 772 | 755 | 179.2 |
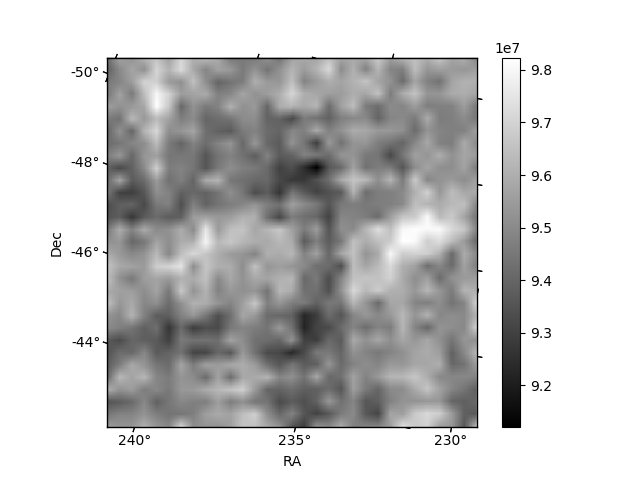
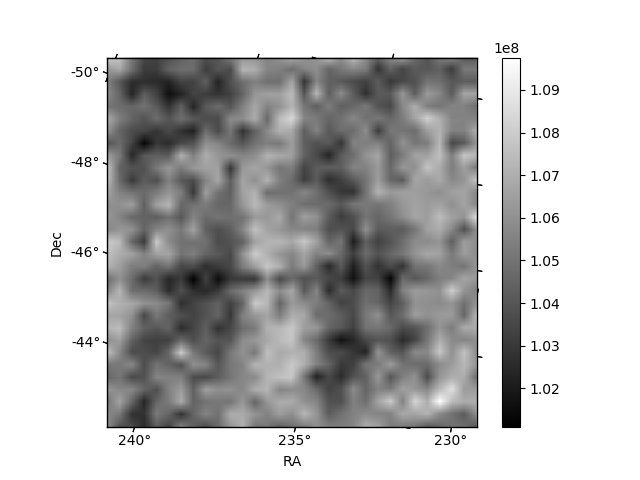
Histogram calculated using DETX and DETY for each event in the final _common_clean file
| Quadrant A | 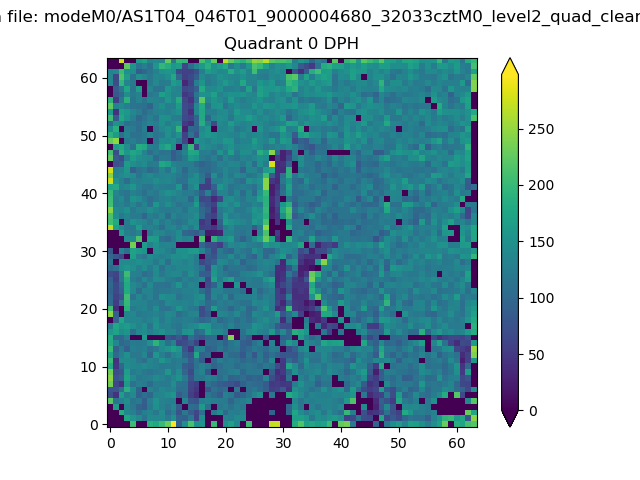 |
 |
Quadrant B |
|---|---|---|---|
| Quadrant D | 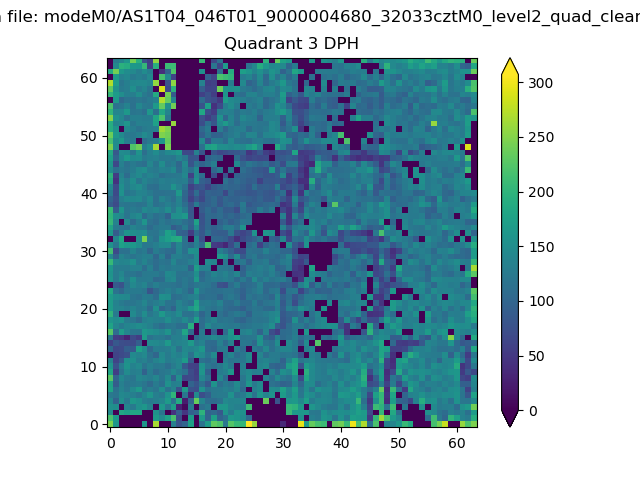 |
 |
Quadrant C |
| Plot type | Count rate plots | Images |
|---|---|---|
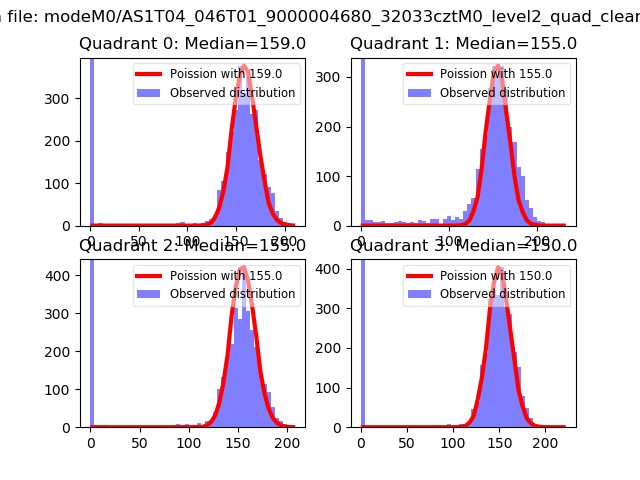
| Comparison with Poisson distribution Blue bars denote a histogram of data divided into 1 sec bins. Red curve is a Poisson curve with rate = median count rate of data. |
 |
 |
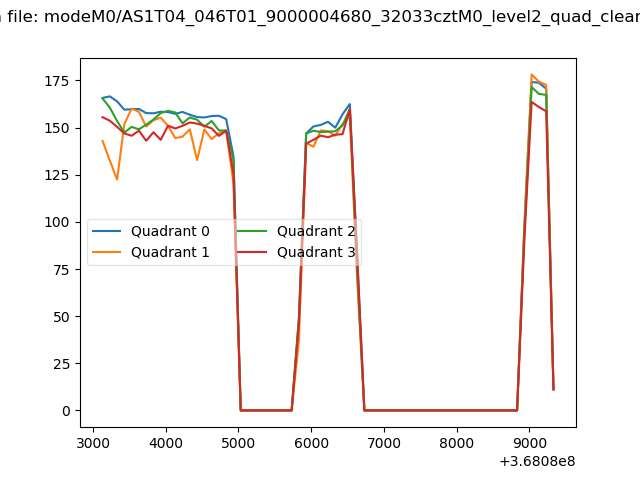
| Quadrant-wise count rates Data is divided into 100 sec bins |
 |
|
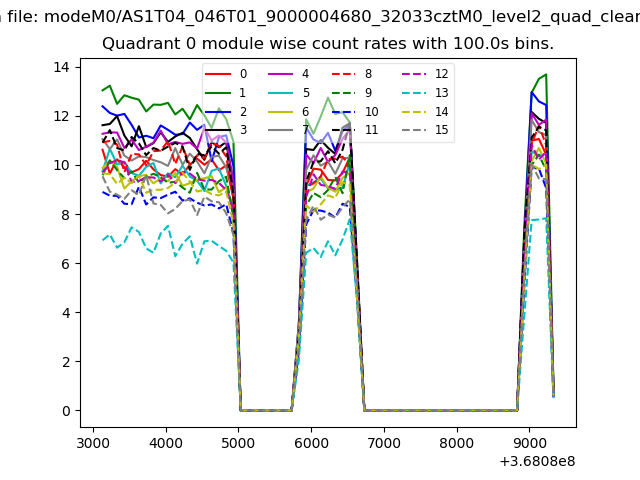
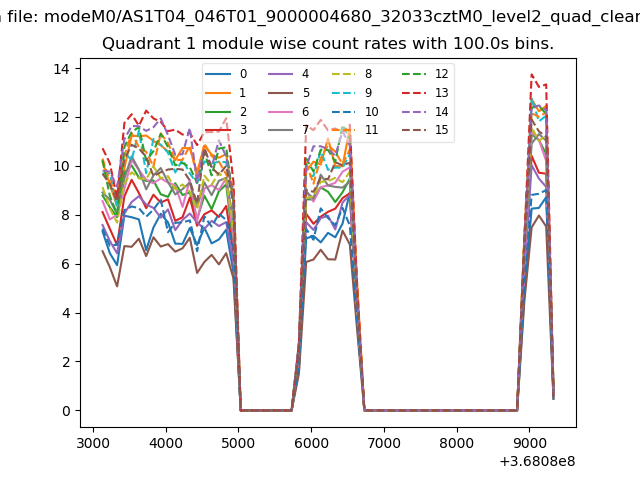
| Module-wise count rates for Quadrant A Data is divided into 100 sec bins |
 |
 |
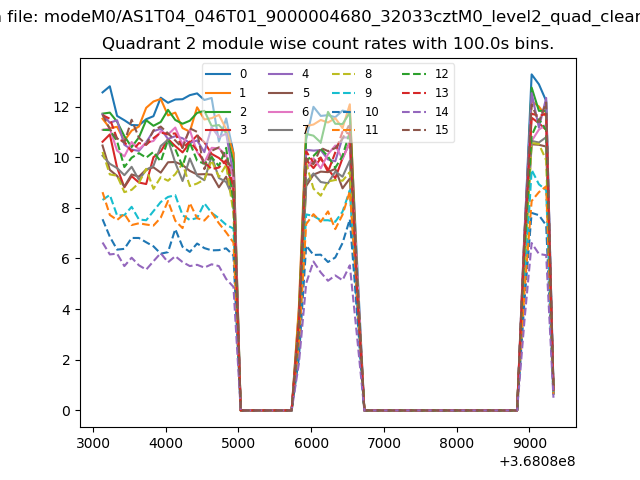
| Module-wise count rates for Quadrant B Data is divided into 100 sec bins |
 |
 |
| Module-wise count rates for Quadrant C Data is divided into 100 sec bins |
 |
 |
| Module-wise count rates for Quadrant D Data is divided into 100 sec bins |
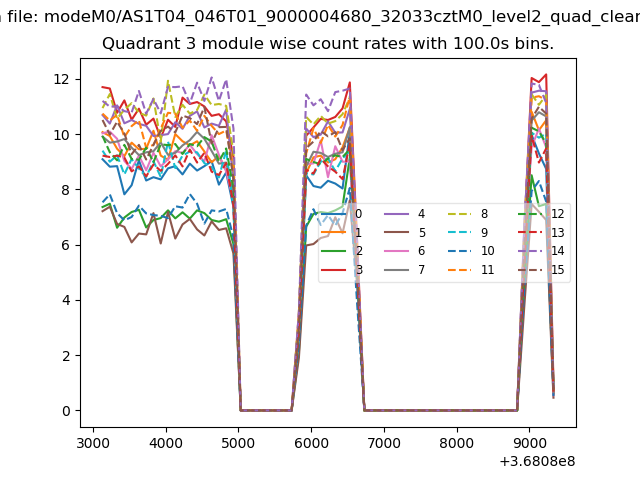 |
 |
| Parameter | Plot |
|---|---|
| CZT HV Monitor |  |
| D_VDD | 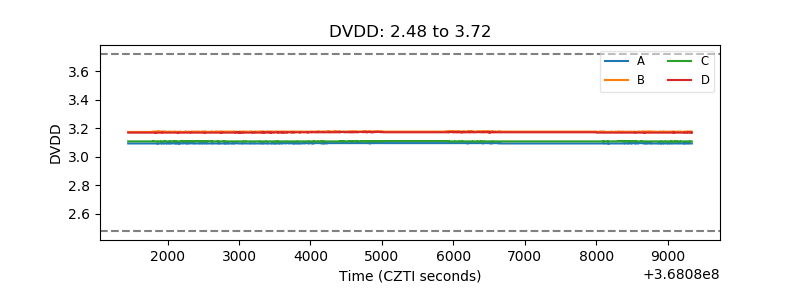 |
| Temperature 1 | 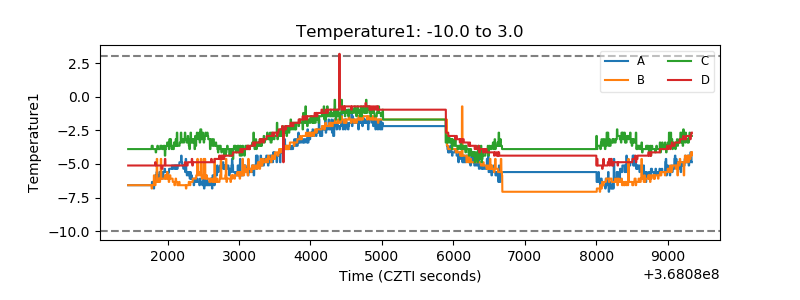 |
| Veto HV Monitor | 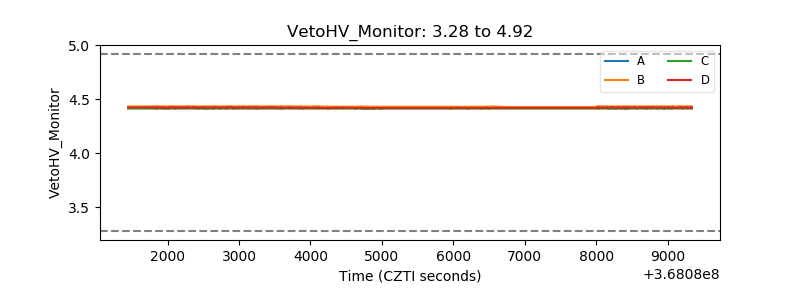 |
| Veto LLD |  |
| Alpha Counter | 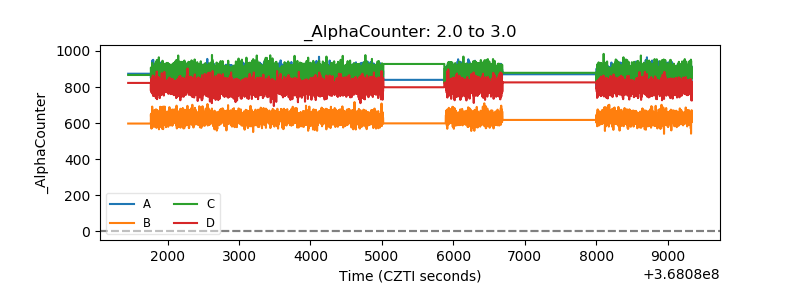 |
| _CPM_Rate | 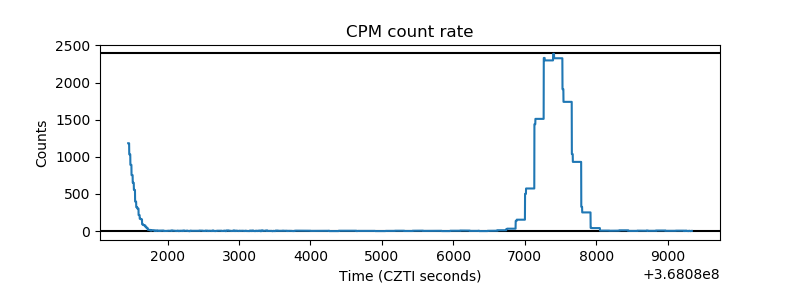 |
| CZT Counter | 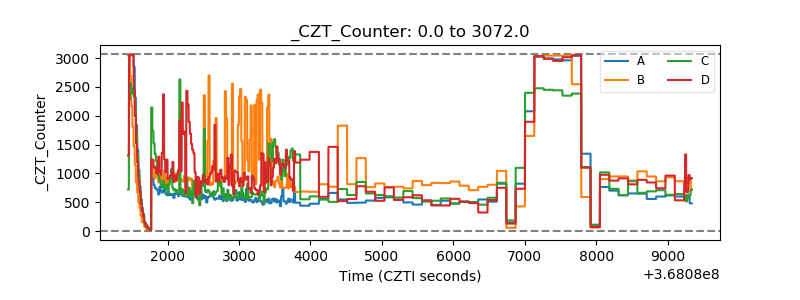 |
| +2.5 Volts monitor |  |
| +5 Volts monitor |  |
| _ROLL_ROT |  |
| _Roll_DEC | 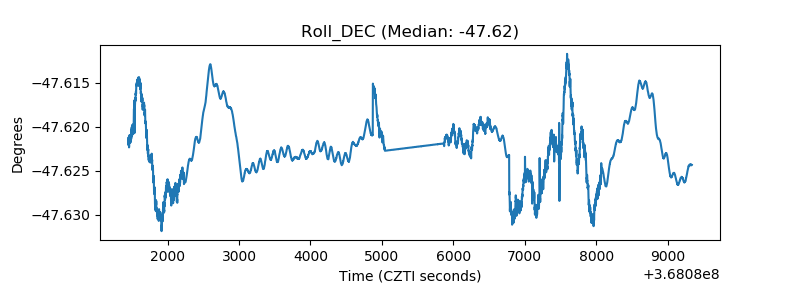 |
| _Roll_RA | 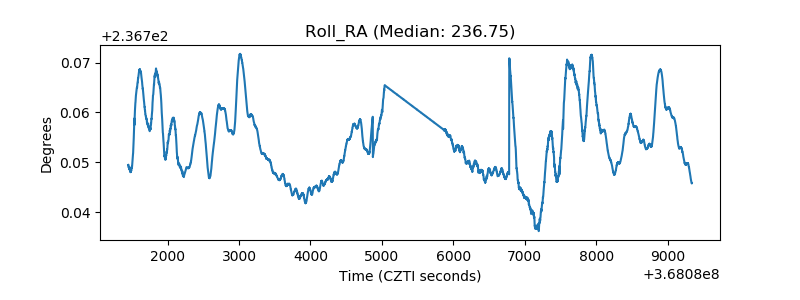 |
| Veto Counter | 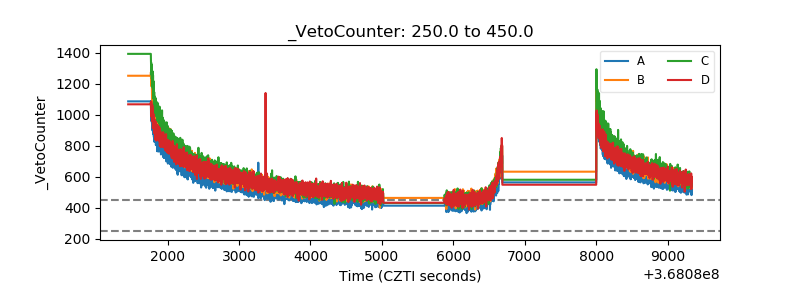 |