| Param | Original file | Final file |
|---|---|---|
| Filename | modeM0/AS1T04_046T01_9000004680_32035cztM0_level2.evt | modeM0/AS1T04_046T01_9000004680_32035cztM0_level2_quad_clean.evt |
| Size (bytes) | 1,118,416,320 | 226,650,240 |
| Size | 1.0 GB | 216.2 MB |
| Events in quadrant A | 6,255,016 | 1,563,808 |
| Events in quadrant B | 10,355,444 | 1,509,242 |
| Events in quadrant C | 7,201,782 | 1,512,068 |
| Events in quadrant D | 9,261,286 | 1,460,877 |
| Mode M0 | |||
|---|---|---|---|
| Quadrant | BADHDUFLAG | Total packets | Discarded packets |
| A | 0 | 26194 | 845 |
| B | 0 | 39964 | 1384 |
| C | 0 | 29712 | 970 |
| D | 0 | 36353 | 1136 |
| Mode M9 | |||
|---|---|---|---|
| Quadrant | BADHDUFLAG | Total packets | Discarded packets |
| A | 0 | 20 | 1 |
| B | 0 | 20 | 1 |
| C | 0 | 21 | 2 |
| D | 0 | 20 | 1 |
| Mode SS | |||
|---|---|---|---|
| Quadrant | BADHDUFLAG | Total packets | Discarded packets |
| A | 0 | 248 | 6 |
| B | 0 | 249 | 5 |
| C | 0 | 251 | 9 |
| D | 0 | 251 | 5 |
| Quadrant | Total seconds | Saturated seconds | Saturation percentage |
|---|---|---|---|
| A | 11851 | 136 | 1.147582% |
| B | 11811 | 626 | 5.300144% |
| C | 11844 | 410 | 3.461668% |
| D | 11841 | 430 | 3.631450% |
Noise dominated data is calculated using 1-second bins in cleaned event files. If a bin has >2000 counts, and if more than 50% of those come from <1% of pixels, then it is considered to be noise-dominated and hence unusable.
| Quadrant | # 1 sec bins | Bins with >0 counts | Bins with >2000 counts | High rate bins dominated by noise | Noise dominated (total time) | Noise dominated (detector-on time) | Marked lightcurve |
|---|---|---|---|---|---|---|---|
| A | 18487 | 11913 | 0 | 0 | 0.00% | 0.00% | 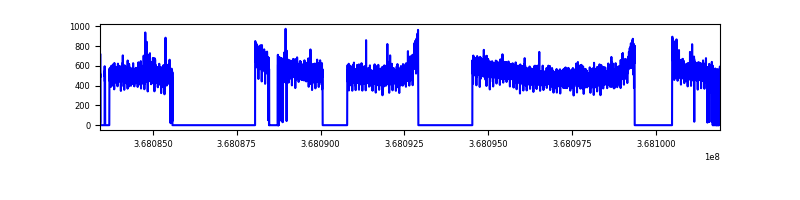 |
| B | 18484 | 11881 | 276 | 276 | 1.49% | 2.32% | 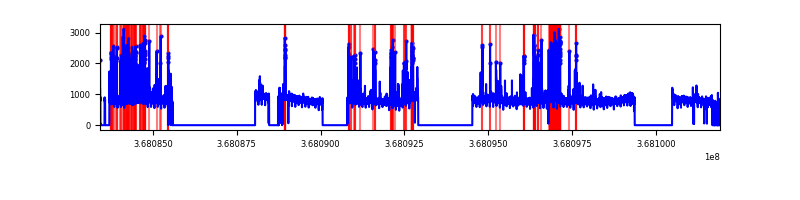 |
| C | 18485 | 11905 | 50 | 50 | 0.27% | 0.42% | 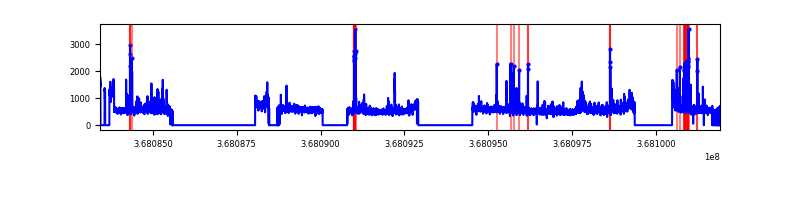 |
| D | 18485 | 11906 | 227 | 227 | 1.23% | 1.91% | 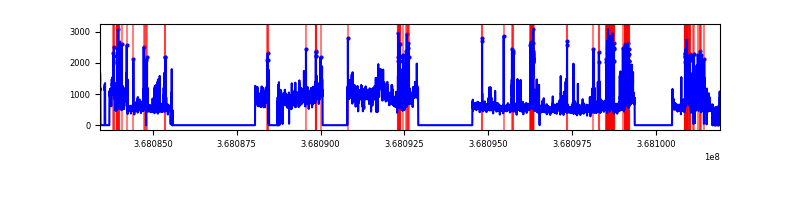 |
Top three noisy pixels from each quadrant. If the there are fewer than three noisy pixels in the level2.evt file, extra rows are filled as -1
| Pixel properties | Quadrant properties | ||||||
|---|---|---|---|---|---|---|---|
| Quadrant | DetID | PixID | Counts | Sigma | Mean | Median | Sigma |
| A | 13 | 6 | 36284 | 109.88 | 1610 | 1585 | 315.8 |
| A | 13 | 254 | 23116 | 68.18 | 1610 | 1585 | 315.8 |
| A | 3 | 137 | 14913 | 42.2 | 1610 | 1585 | 315.8 |
| B | 6 | 159 | 3111299 | 10951.76 | 1544 | 1508 | 284.0 |
| B | 12 | 18 | 762093 | 2678.55 | 1544 | 1508 | 284.0 |
| B | 0 | 190 | 174395 | 608.86 | 1544 | 1508 | 284.0 |
| C | 3 | 233 | 677588 | 1945.96 | 1525 | 1541 | 347.4 |
| C | 14 | 238 | 253701 | 725.83 | 1525 | 1541 | 347.4 |
| C | 0 | 10 | 199048 | 568.51 | 1525 | 1541 | 347.4 |
| D | 8 | 195 | 2080437 | 5755.4 | 1545 | 1506 | 361.2 |
| D | 2 | 250 | 583324 | 1610.73 | 1545 | 1506 | 361.2 |
| D | 12 | 218 | 555278 | 1533.09 | 1545 | 1506 | 361.2 |
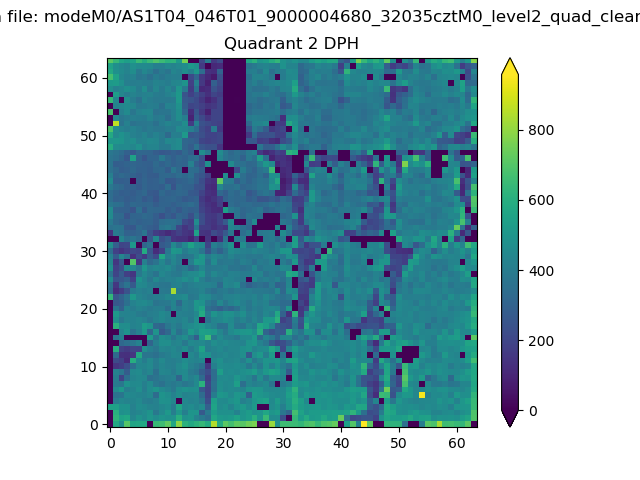
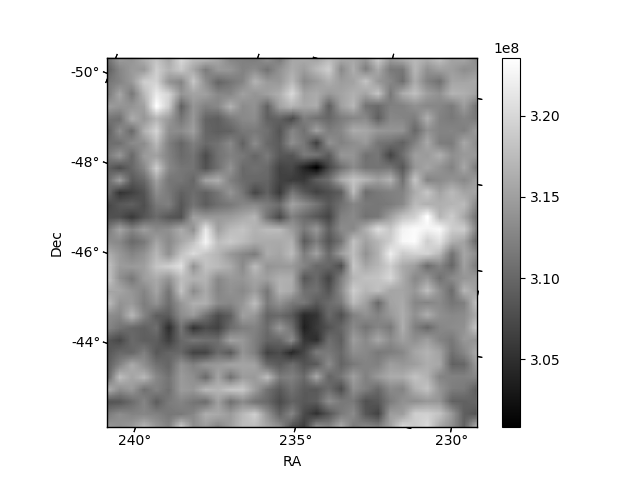
Histogram calculated using DETX and DETY for each event in the final _common_clean file
| Quadrant A |  |
 |
Quadrant B |
|---|---|---|---|
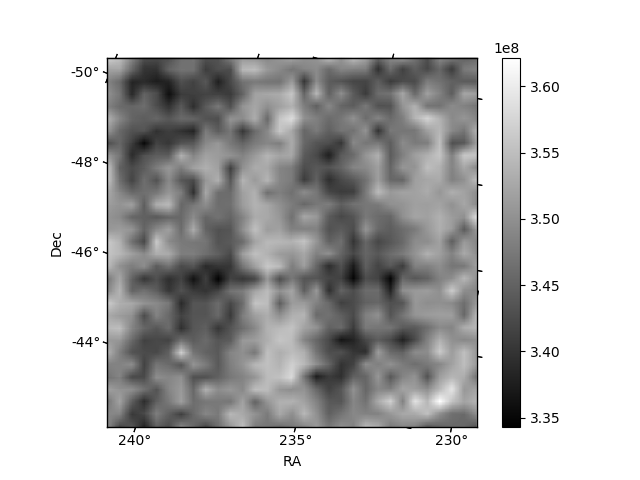
| Quadrant D | 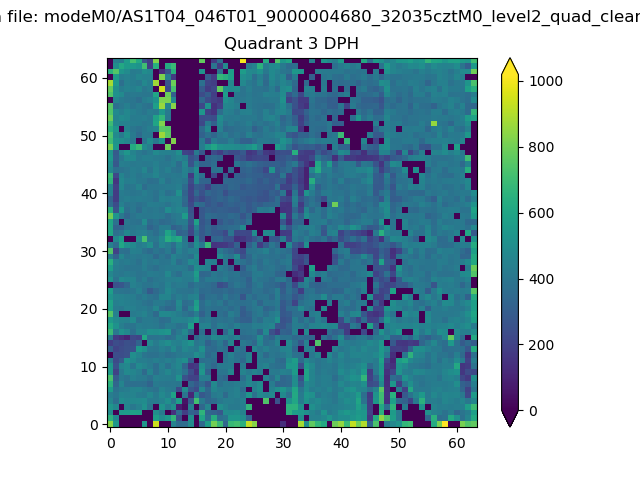 |
 |
Quadrant C |
| Plot type | Count rate plots | Images |
|---|---|---|
| Comparison with Poisson distribution Blue bars denote a histogram of data divided into 1 sec bins. Red curve is a Poisson curve with rate = median count rate of data. |
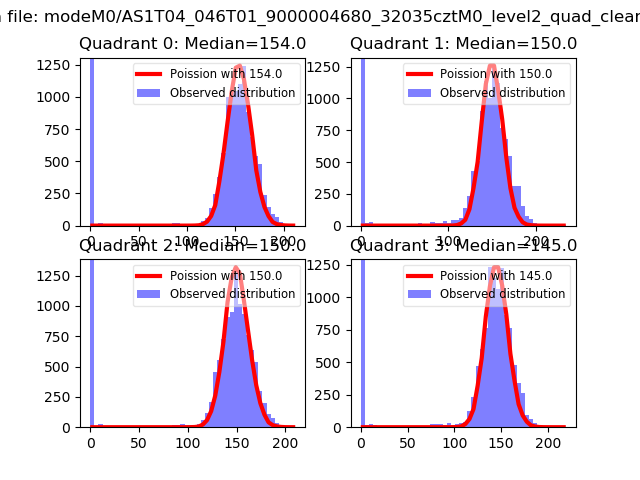 |
 |
| Quadrant-wise count rates Data is divided into 100 sec bins |
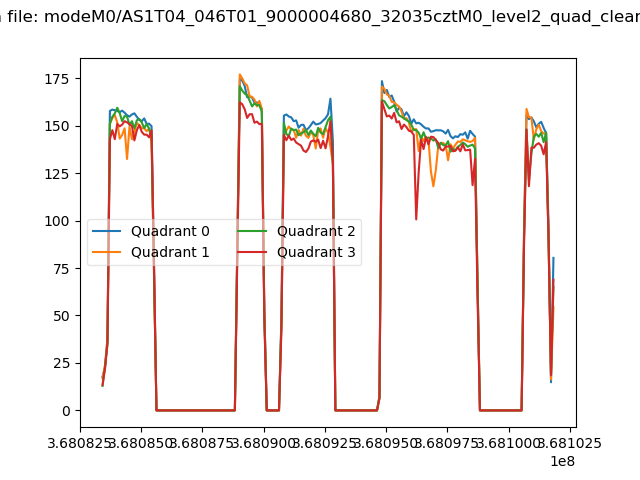 |
|
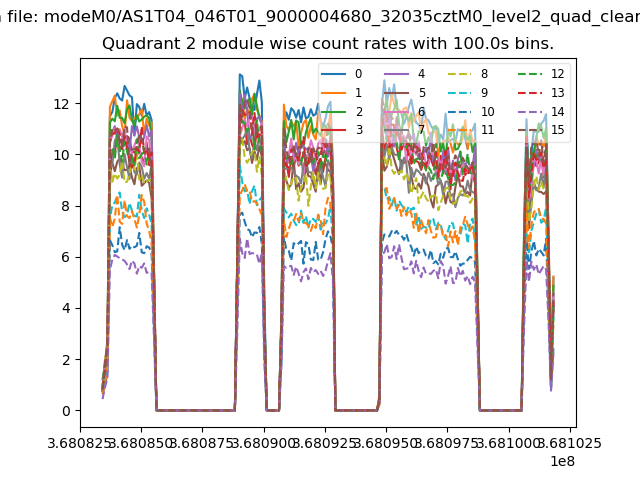
| Module-wise count rates for Quadrant A Data is divided into 100 sec bins |
 |
 |
| Module-wise count rates for Quadrant B Data is divided into 100 sec bins |
 |
 |
| Module-wise count rates for Quadrant C Data is divided into 100 sec bins |
 |
 |
| Module-wise count rates for Quadrant D Data is divided into 100 sec bins |
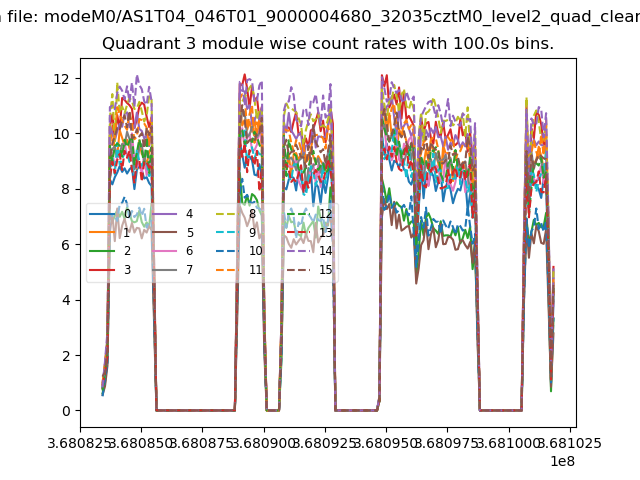 |
 |
| Parameter | Plot |
|---|---|
| CZT HV Monitor |  |
| D_VDD | 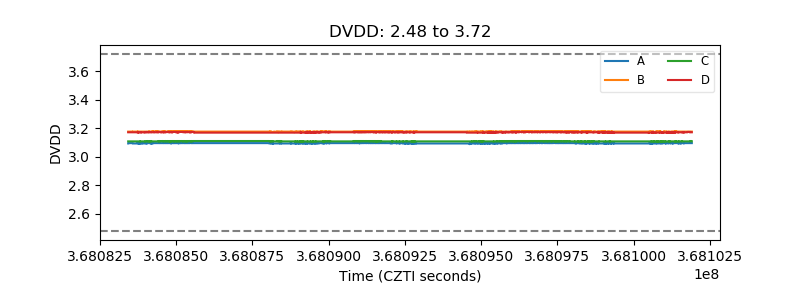 |
| Temperature 1 | 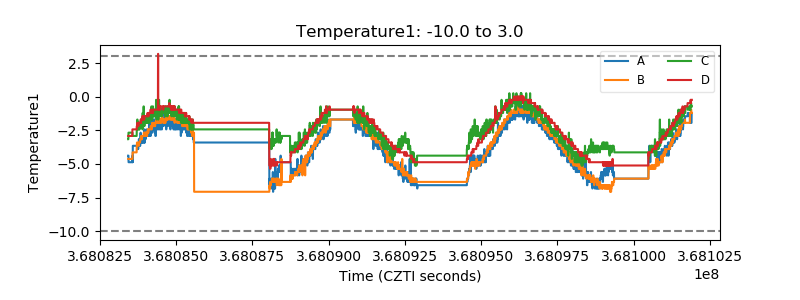 |
| Veto HV Monitor | 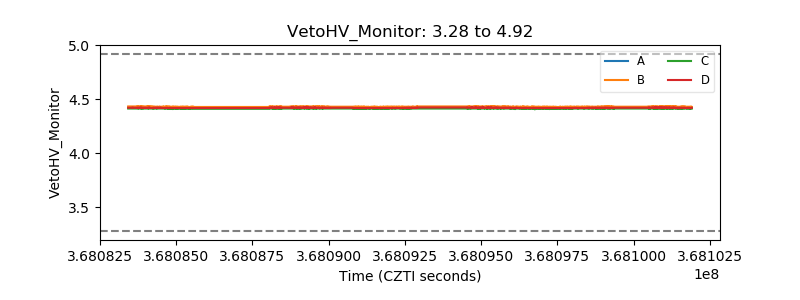 |
| Veto LLD | 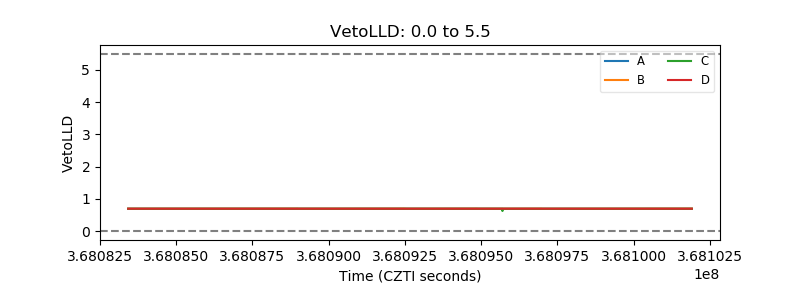 |
| Alpha Counter | 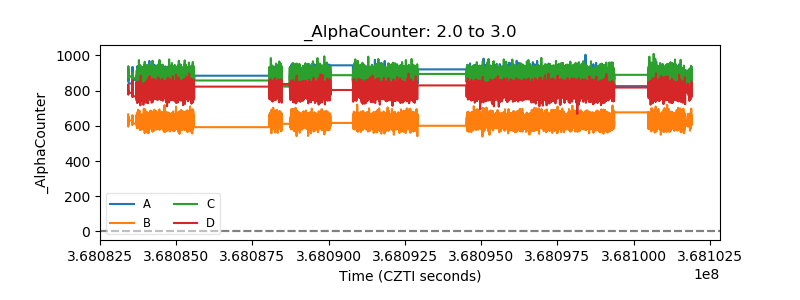 |
| _CPM_Rate | 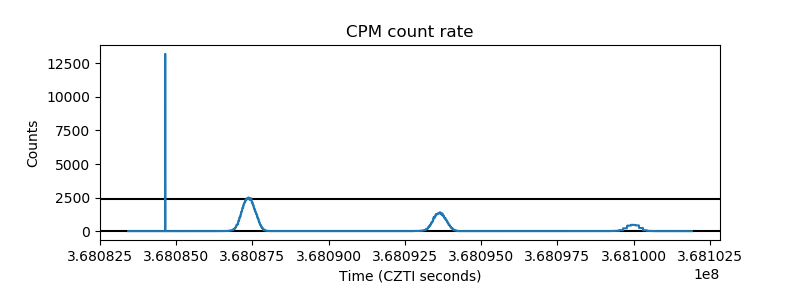 |
| CZT Counter | 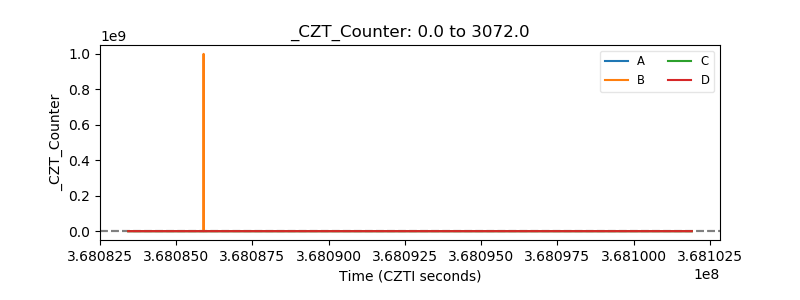 |
| +2.5 Volts monitor |  |
| +5 Volts monitor | 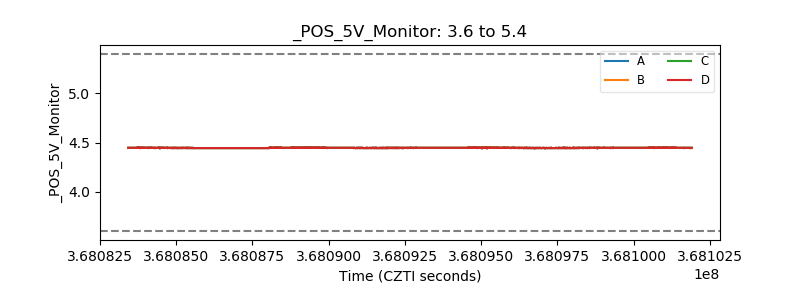 |
| _ROLL_ROT | 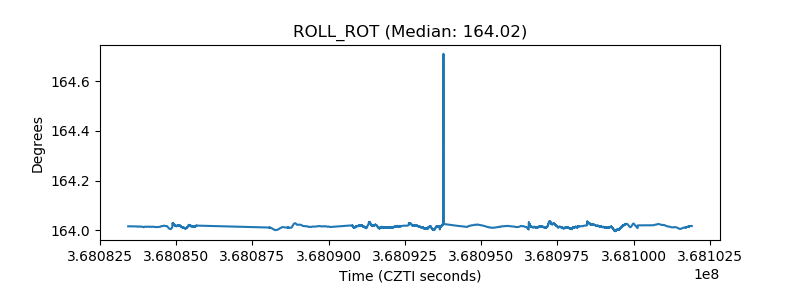 |
| _Roll_DEC | 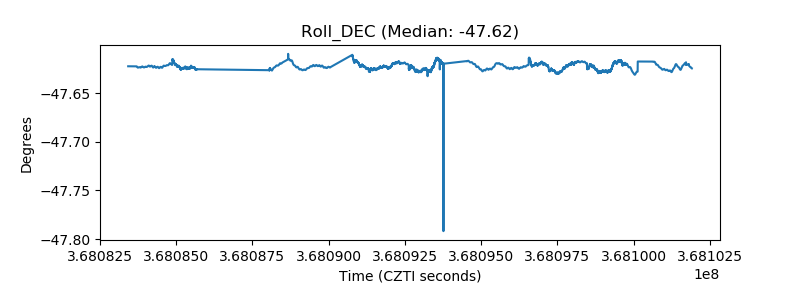 |
| _Roll_RA | 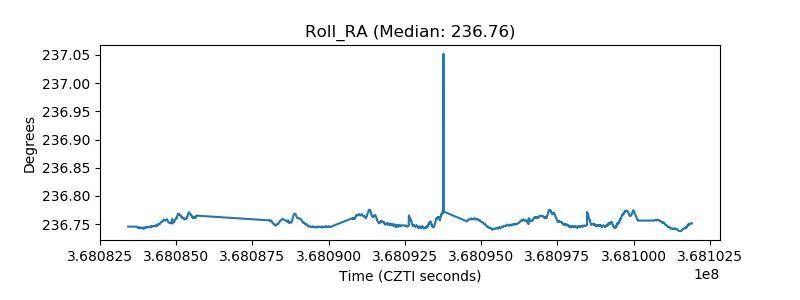 |
| Veto Counter | 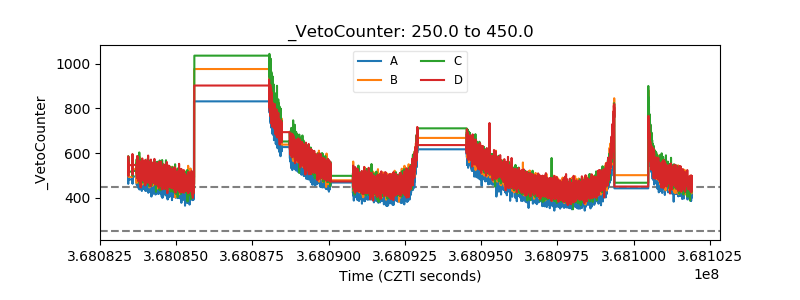 |