| Param | Original file | Final file |
|---|---|---|
| Filename | modeM0/AS1T04_046T01_9000004680_32036cztM0_level2.evt | modeM0/AS1T04_046T01_9000004680_32036cztM0_level2_quad_clean.evt |
| Size (bytes) | 598,340,160 | 108,872,640 |
| Size | 570.6 MB | 103.8 MB |
| Events in quadrant A | 3,206,724 | 737,161 |
| Events in quadrant B | 5,530,874 | 712,120 |
| Events in quadrant C | 3,970,152 | 704,420 |
| Events in quadrant D | 4,973,154 | 690,048 |
| Mode M0 | |||
|---|---|---|---|
| Quadrant | BADHDUFLAG | Total packets | Discarded packets |
| A | 0 | 13421 | 8 |
| B | 0 | 21003 | 19 |
| C | 0 | 15728 | 1 |
| D | 0 | 19007 | 6 |
| Mode M9 | |||
|---|---|---|---|
| Quadrant | BADHDUFLAG | Total packets | Discarded packets |
| A | 0 | 8 | 0 |
| B | 0 | 8 | 0 |
| C | 0 | 8 | 0 |
| D | 0 | 8 | 0 |
| Mode SS | |||
|---|---|---|---|
| Quadrant | BADHDUFLAG | Total packets | Discarded packets |
| A | 0 | 132 | 0 |
| B | 0 | 132 | 0 |
| C | 0 | 132 | 0 |
| D | 0 | 132 | 0 |
| Quadrant | Total seconds | Saturated seconds | Saturation percentage |
|---|---|---|---|
| A | 6500 | 84 | 1.292308% |
| B | 6501 | 318 | 4.891555% |
| C | 6504 | 317 | 4.873924% |
| D | 6502 | 263 | 4.044909% |
Noise dominated data is calculated using 1-second bins in cleaned event files. If a bin has >2000 counts, and if more than 50% of those come from <1% of pixels, then it is considered to be noise-dominated and hence unusable.
| Quadrant | # 1 sec bins | Bins with >0 counts | Bins with >2000 counts | High rate bins dominated by noise | Noise dominated (total time) | Noise dominated (detector-on time) | Marked lightcurve |
|---|---|---|---|---|---|---|---|
| A | 7303 | 6503 | 0 | 0 | 0.00% | 0.00% | 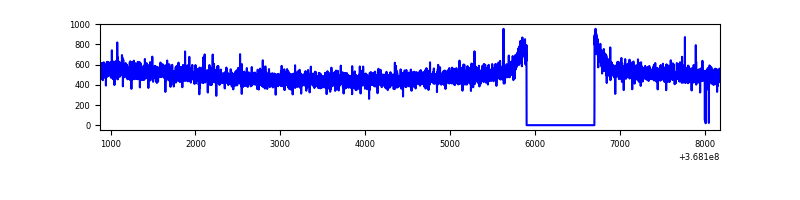 |
| B | 7304 | 6503 | 151 | 151 | 2.07% | 2.32% |  |
| C | 7304 | 6504 | 100 | 100 | 1.37% | 1.54% |  |
| D | 7304 | 6504 | 160 | 160 | 2.19% | 2.46% | 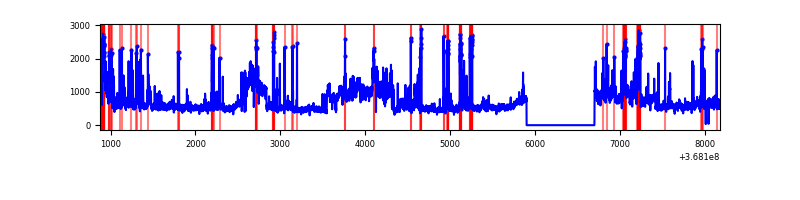 |
Top three noisy pixels from each quadrant. If the there are fewer than three noisy pixels in the level2.evt file, extra rows are filled as -1
| Pixel properties | Quadrant properties | ||||||
|---|---|---|---|---|---|---|---|
| Quadrant | DetID | PixID | Counts | Sigma | Mean | Median | Sigma |
| A | 13 | 254 | 12570 | 71.54 | 827 | 811 | 164.4 |
| A | 13 | 6 | 11034 | 62.2 | 827 | 811 | 164.4 |
| A | 3 | 137 | 8080 | 44.22 | 827 | 811 | 164.4 |
| B | 6 | 159 | 1726819 | 11404.56 | 797 | 778 | 151.3 |
| B | 5 | 172 | 361129 | 2380.97 | 797 | 778 | 151.3 |
| B | 10 | 245 | 163762 | 1076.89 | 797 | 778 | 151.3 |
| C | 0 | 10 | 363682 | 2017.75 | 775 | 780 | 179.9 |
| C | 3 | 233 | 360624 | 2000.75 | 775 | 780 | 179.9 |
| C | 14 | 238 | 137097 | 757.93 | 775 | 780 | 179.9 |
| D | 8 | 195 | 1127015 | 6061.69 | 792 | 772 | 185.8 |
| D | 12 | 218 | 453477 | 2436.56 | 792 | 772 | 185.8 |
| D | 2 | 250 | 127513 | 682.15 | 792 | 772 | 185.8 |
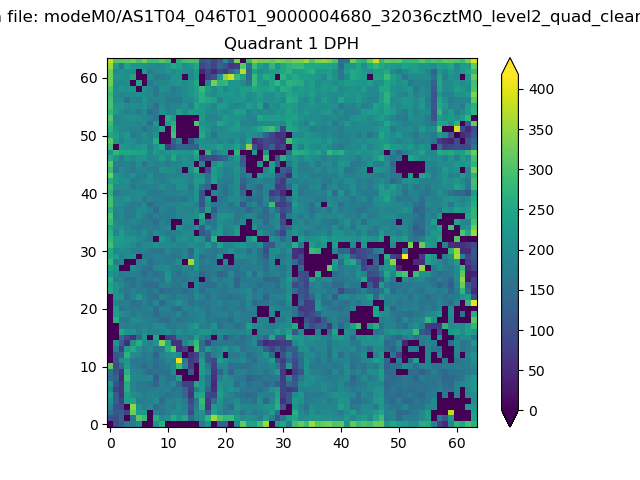
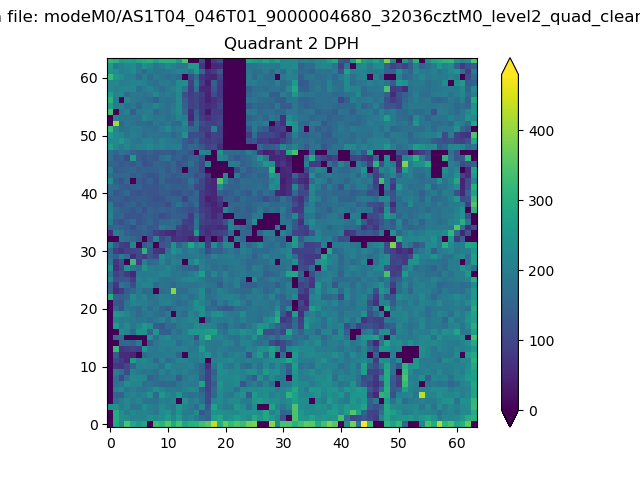
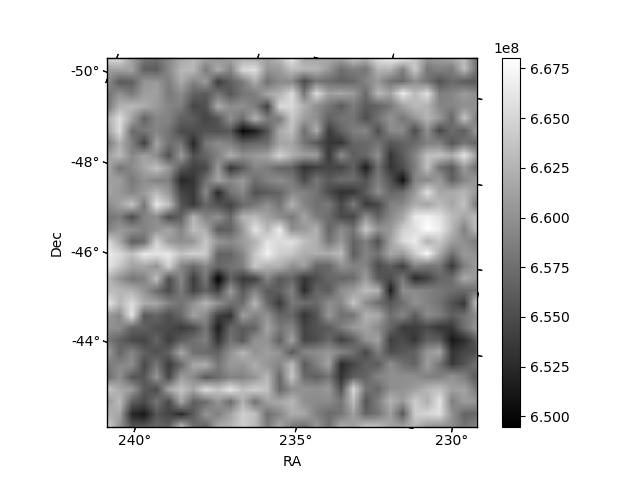
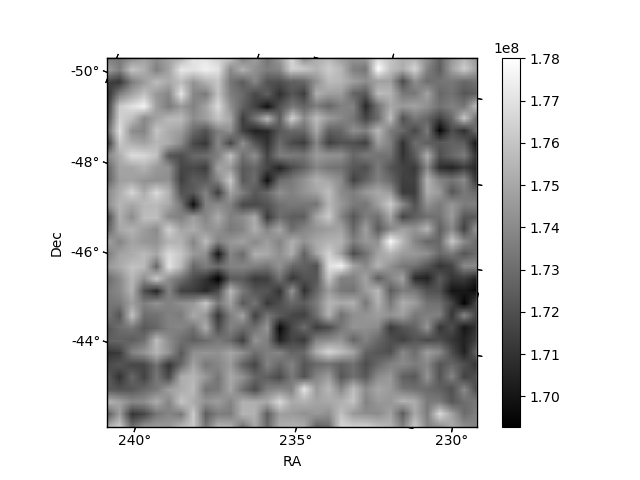
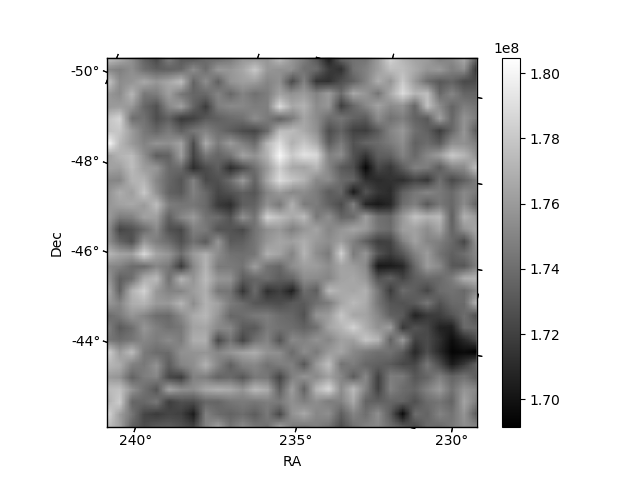
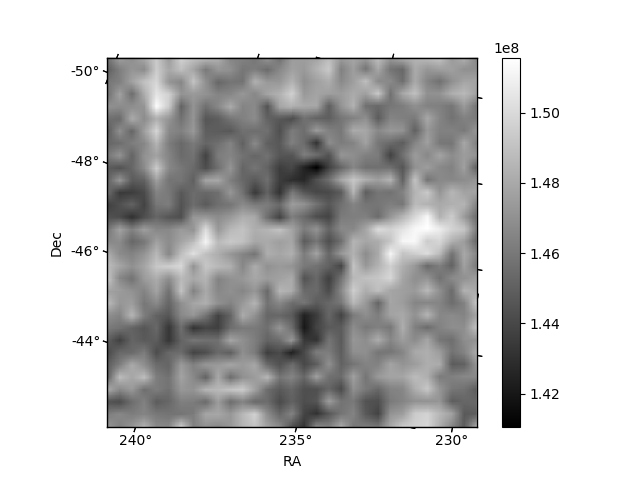
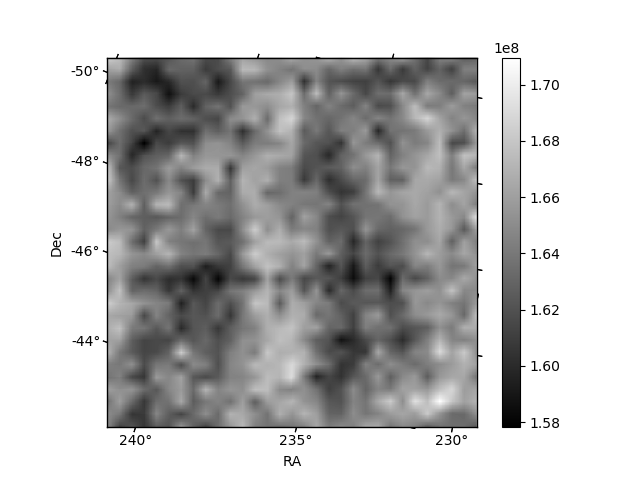
Histogram calculated using DETX and DETY for each event in the final _common_clean file
| Quadrant A |  |
 |
Quadrant B |
|---|---|---|---|
| Quadrant D |  |
 |
Quadrant C |
| Plot type | Count rate plots | Images |
|---|---|---|
| Comparison with Poisson distribution Blue bars denote a histogram of data divided into 1 sec bins. Red curve is a Poisson curve with rate = median count rate of data. |
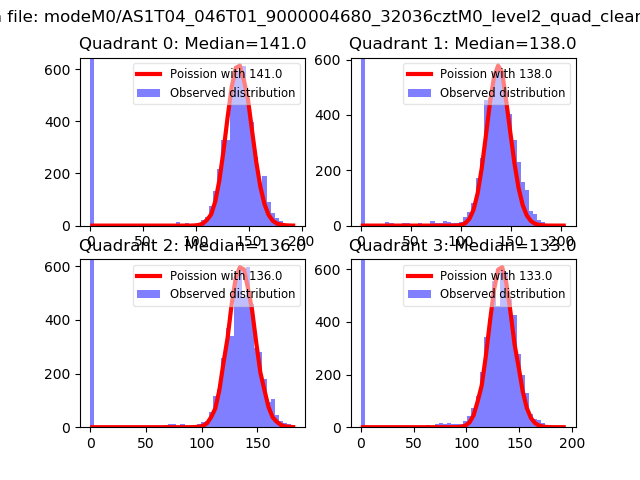 |
 |
| Quadrant-wise count rates Data is divided into 100 sec bins |
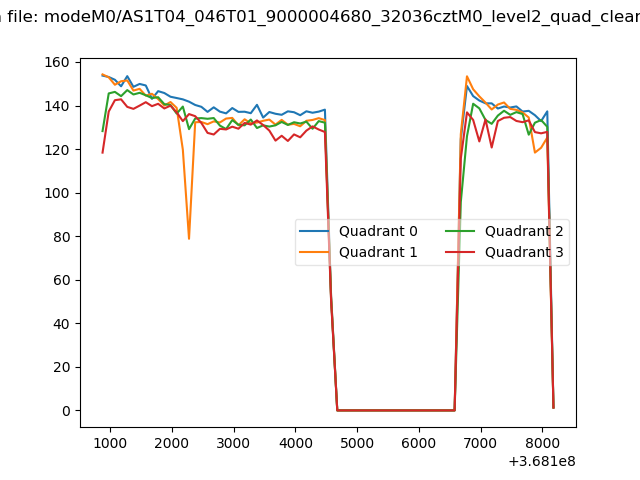 |
|
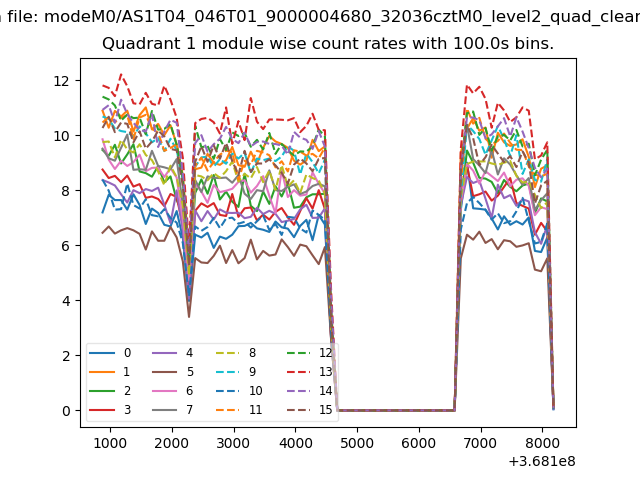
| Module-wise count rates for Quadrant A Data is divided into 100 sec bins |
 |
 |
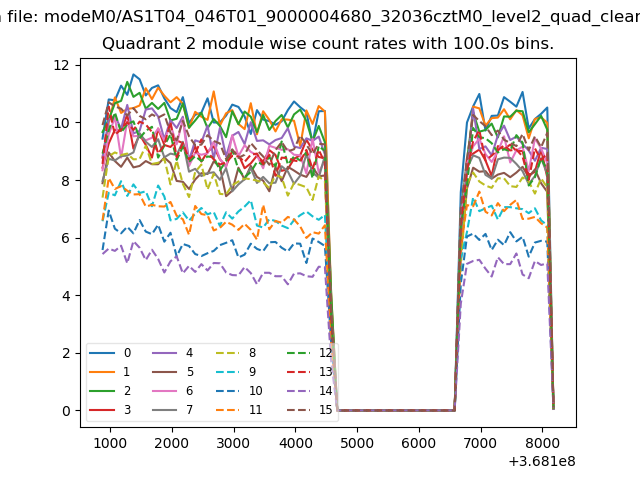
| Module-wise count rates for Quadrant B Data is divided into 100 sec bins |
 |
 |
| Module-wise count rates for Quadrant C Data is divided into 100 sec bins |
 |
 |
| Module-wise count rates for Quadrant D Data is divided into 100 sec bins |
 |
 |
| Parameter | Plot |
|---|---|
| CZT HV Monitor |  |
| D_VDD | 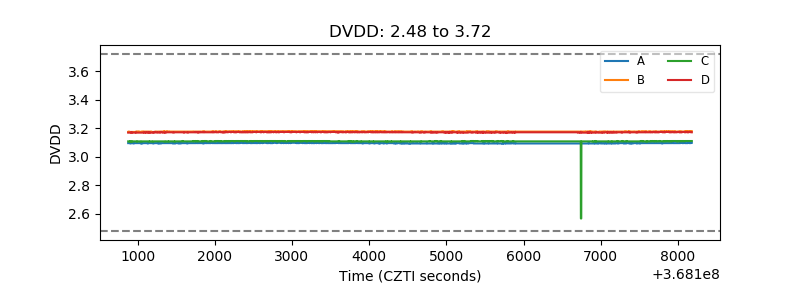 |
| Temperature 1 | 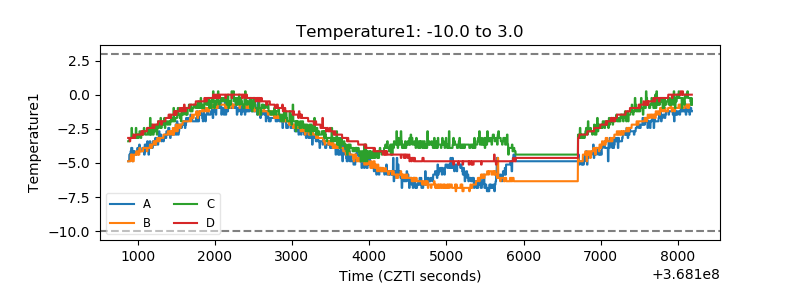 |
| Veto HV Monitor | 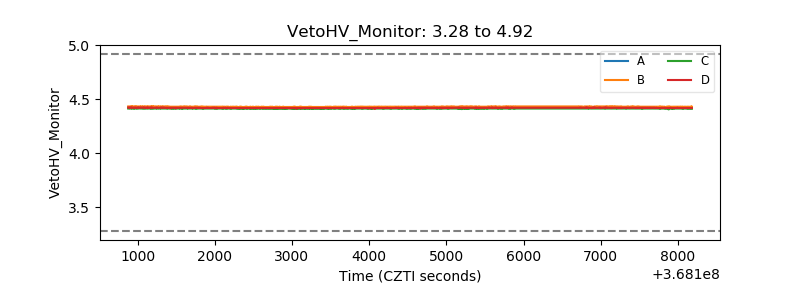 |
| Veto LLD | 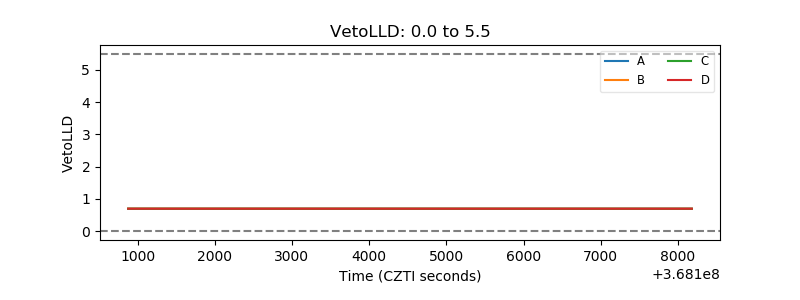 |
| Alpha Counter | 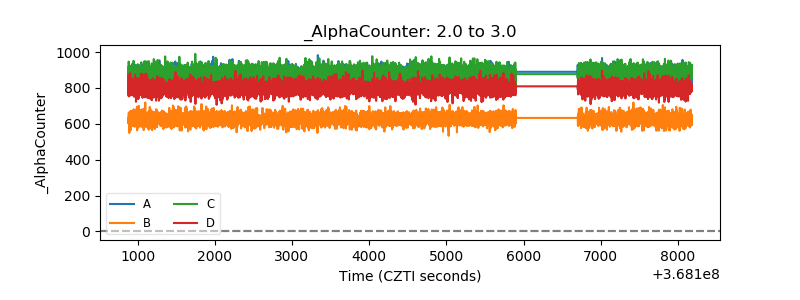 |
| _CPM_Rate | 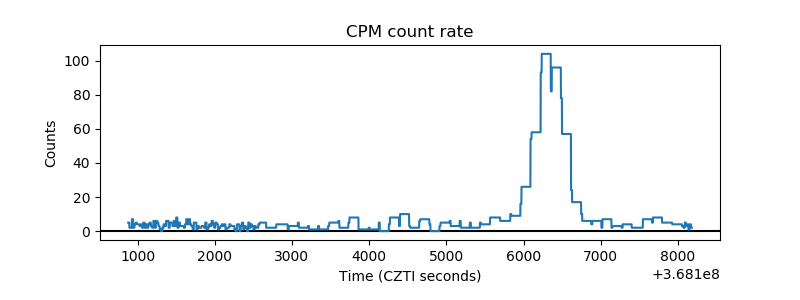 |
| CZT Counter | 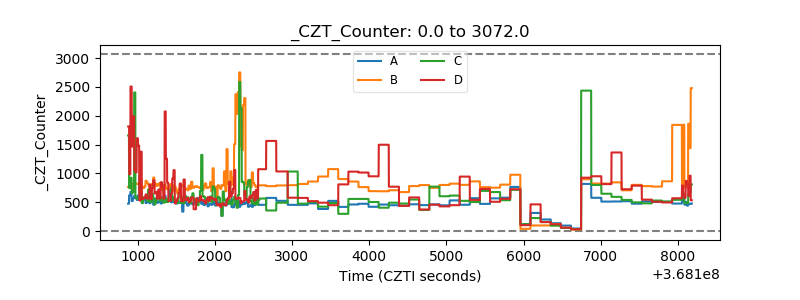 |
| +2.5 Volts monitor |  |
| +5 Volts monitor |  |
| _ROLL_ROT | 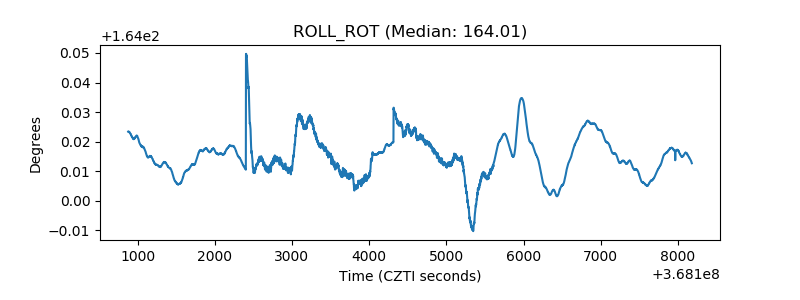 |
| _Roll_DEC | 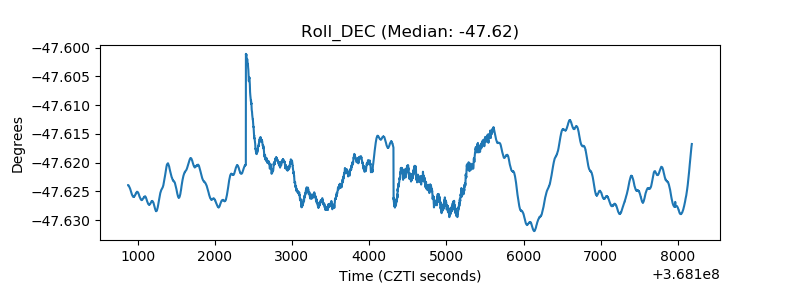 |
| _Roll_RA | 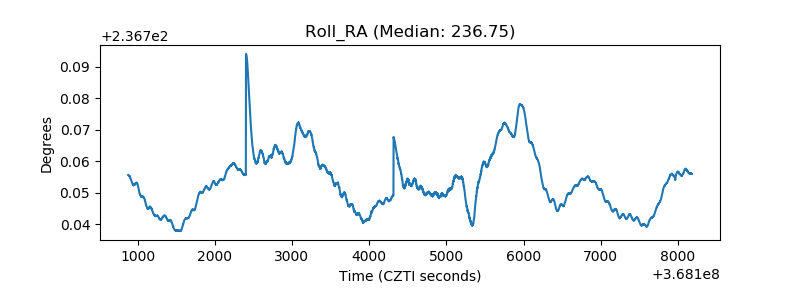 |
| Veto Counter | 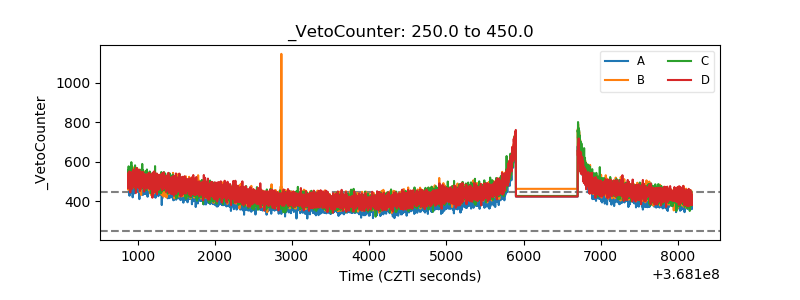 |