| Param | Original file | Final file |
|---|---|---|
| Filename | modeM0/AS1T04_046T01_9000004680_32037cztM0_level2.evt | modeM0/AS1T04_046T01_9000004680_32037cztM0_level2_quad_clean.evt |
| Size (bytes) | 660,205,440 | 110,119,680 |
| Size | 629.6 MB | 105.0 MB |
| Events in quadrant A | 3,558,579 | 728,845 |
| Events in quadrant B | 6,041,948 | 712,201 |
| Events in quadrant C | 4,794,629 | 694,125 |
| Events in quadrant D | 5,105,317 | 691,271 |
| Mode M0 | |||
|---|---|---|---|
| Quadrant | BADHDUFLAG | Total packets | Discarded packets |
| A | 0 | 15142 | 1 |
| B | 0 | 23185 | 1 |
| C | 0 | 18883 | 1 |
| D | 0 | 19935 | 1 |
| Mode M9 | |||
|---|---|---|---|
| Quadrant | BADHDUFLAG | Total packets | Discarded packets |
| A | 0 | 3 | 0 |
| B | 0 | 3 | 0 |
| C | 0 | 3 | 0 |
| D | 0 | 3 | 0 |
| Mode SS | |||
|---|---|---|---|
| Quadrant | BADHDUFLAG | Total packets | Discarded packets |
| A | 0 | 148 | 0 |
| B | 0 | 148 | 0 |
| C | 0 | 148 | 0 |
| D | 0 | 148 | 0 |
| Quadrant | Total seconds | Saturated seconds | Saturation percentage |
|---|---|---|---|
| A | 7300 | 126 | 1.726027% |
| B | 7301 | 337 | 4.615806% |
| C | 7301 | 392 | 5.369128% |
| D | 7301 | 373 | 5.108889% |
Noise dominated data is calculated using 1-second bins in cleaned event files. If a bin has >2000 counts, and if more than 50% of those come from <1% of pixels, then it is considered to be noise-dominated and hence unusable.
| Quadrant | # 1 sec bins | Bins with >0 counts | Bins with >2000 counts | High rate bins dominated by noise | Noise dominated (total time) | Noise dominated (detector-on time) | Marked lightcurve |
|---|---|---|---|---|---|---|---|
| A | 7600 | 7300 | 0 | 0 | 0.00% | 0.00% | 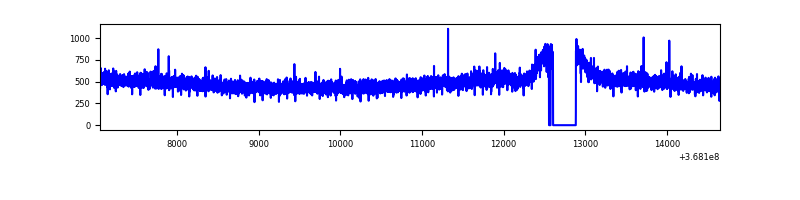 |
| B | 7601 | 7301 | 82 | 82 | 1.08% | 1.12% | 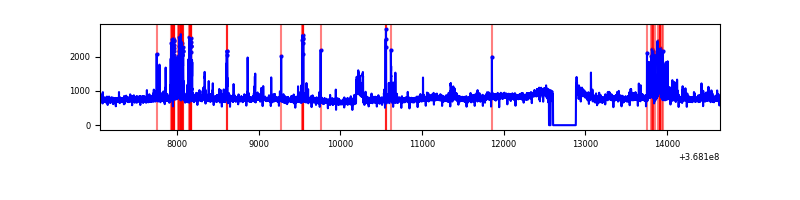 |
| C | 7601 | 7301 | 155 | 155 | 2.04% | 2.12% | 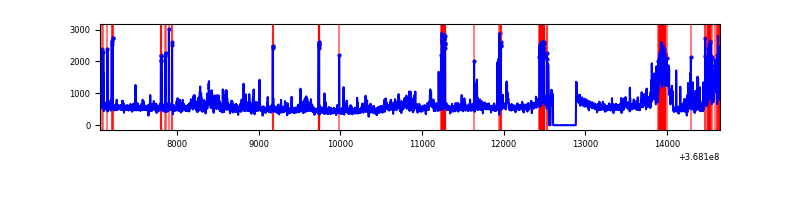 |
| D | 7601 | 7301 | 240 | 240 | 3.16% | 3.29% | 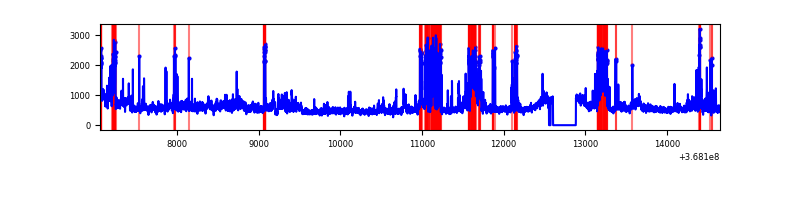 |
Top three noisy pixels from each quadrant. If the there are fewer than three noisy pixels in the level2.evt file, extra rows are filled as -1
| Pixel properties | Quadrant properties | ||||||
|---|---|---|---|---|---|---|---|
| Quadrant | DetID | PixID | Counts | Sigma | Mean | Median | Sigma |
| A | 13 | 6 | 14723 | 75.34 | 916 | 895 | 183.5 |
| A | 13 | 254 | 13846 | 70.56 | 916 | 895 | 183.5 |
| A | 3 | 137 | 9053 | 44.44 | 916 | 895 | 183.5 |
| B | 6 | 159 | 2001119 | 11841.92 | 889 | 868 | 168.9 |
| B | 5 | 172 | 187859 | 1107.03 | 889 | 868 | 168.9 |
| B | 0 | 190 | 166520 | 980.69 | 889 | 868 | 168.9 |
| C | 3 | 233 | 977689 | 4890.75 | 855 | 858 | 199.7 |
| C | 0 | 10 | 276680 | 1380.97 | 855 | 858 | 199.7 |
| C | 14 | 238 | 138856 | 690.92 | 855 | 858 | 199.7 |
| D | 8 | 195 | 690007 | 3313.65 | 875 | 852 | 208.0 |
| D | 10 | 199 | 424729 | 2038.12 | 875 | 852 | 208.0 |
| D | 2 | 250 | 355100 | 1703.32 | 875 | 852 | 208.0 |
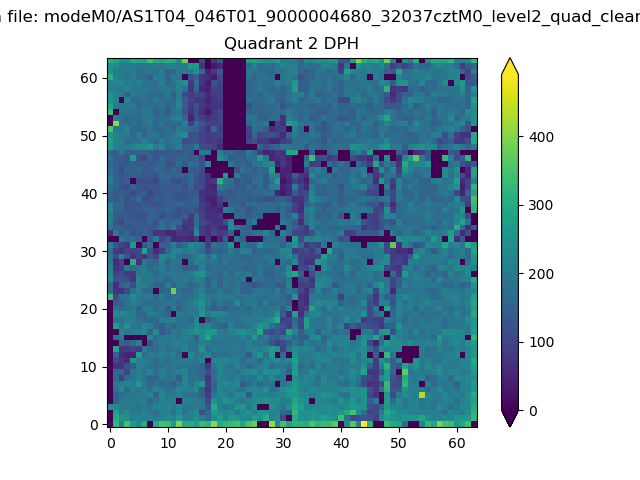
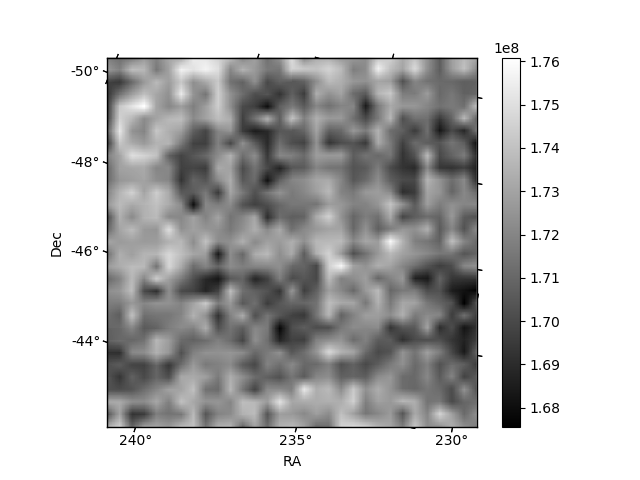
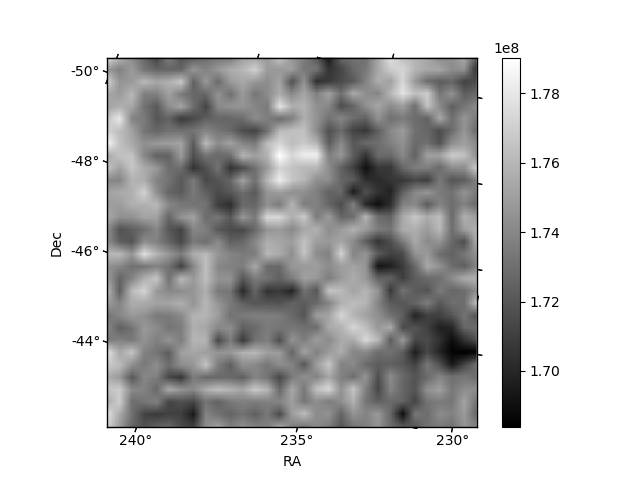
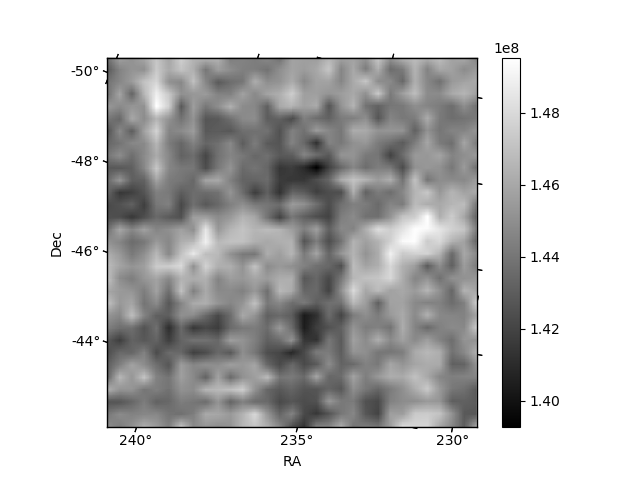
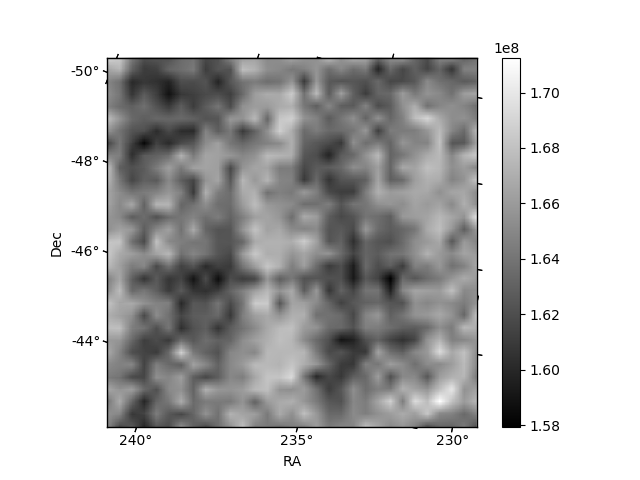
Histogram calculated using DETX and DETY for each event in the final _common_clean file
| Quadrant A |  |
 |
Quadrant B |
|---|---|---|---|
| Quadrant D | 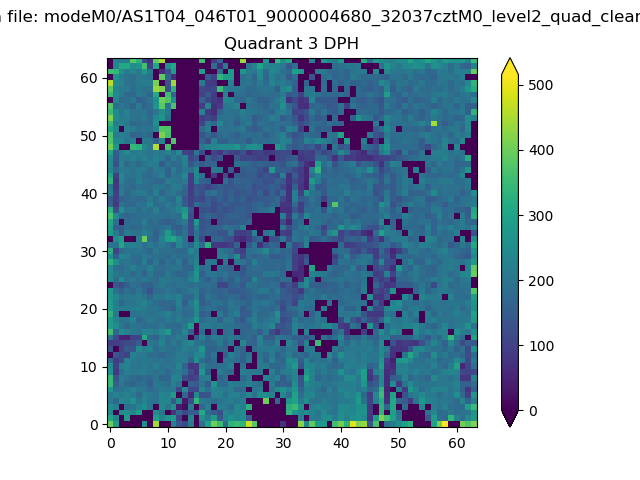 |
 |
Quadrant C |
| Plot type | Count rate plots | Images |
|---|---|---|
| Comparison with Poisson distribution Blue bars denote a histogram of data divided into 1 sec bins. Red curve is a Poisson curve with rate = median count rate of data. |
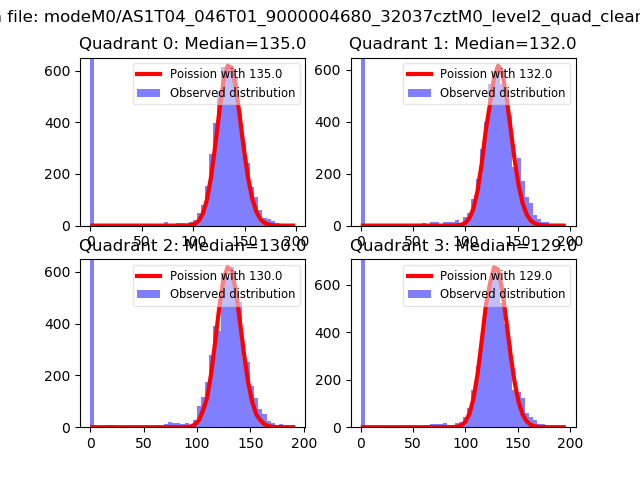 |
 |
| Quadrant-wise count rates Data is divided into 100 sec bins |
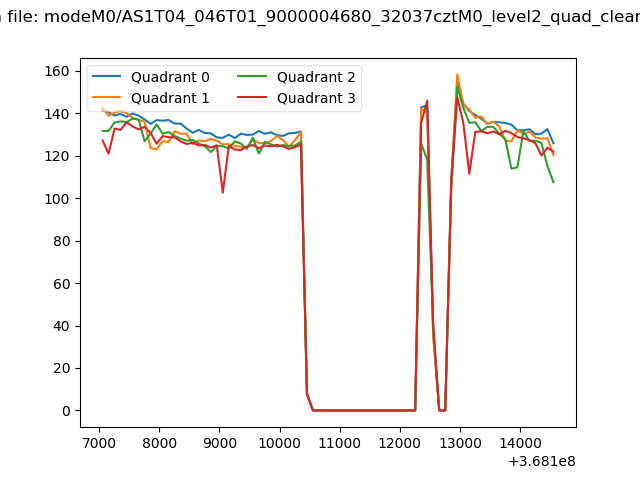 |
|
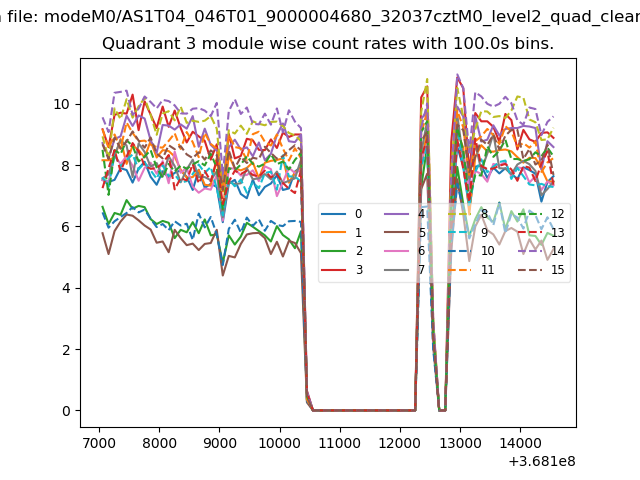
| Module-wise count rates for Quadrant A Data is divided into 100 sec bins |
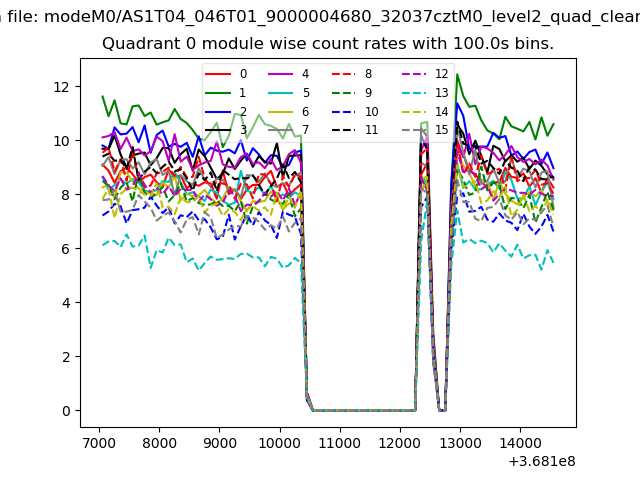 |
 |
| Module-wise count rates for Quadrant B Data is divided into 100 sec bins |
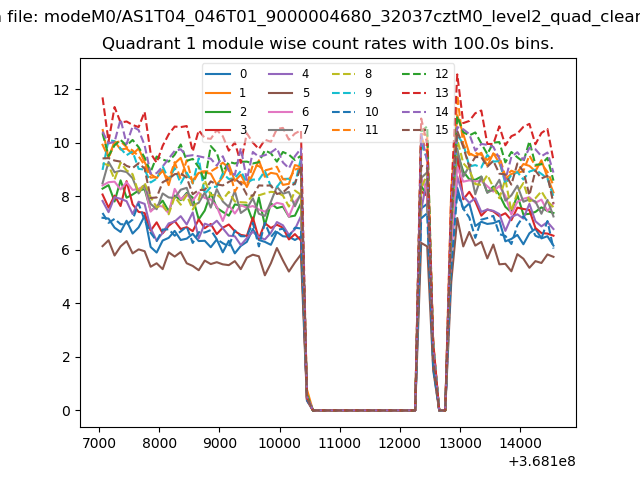 |
 |
| Module-wise count rates for Quadrant C Data is divided into 100 sec bins |
 |
 |
| Module-wise count rates for Quadrant D Data is divided into 100 sec bins |
 |
 |
| Parameter | Plot |
|---|---|
| CZT HV Monitor |  |
| D_VDD | 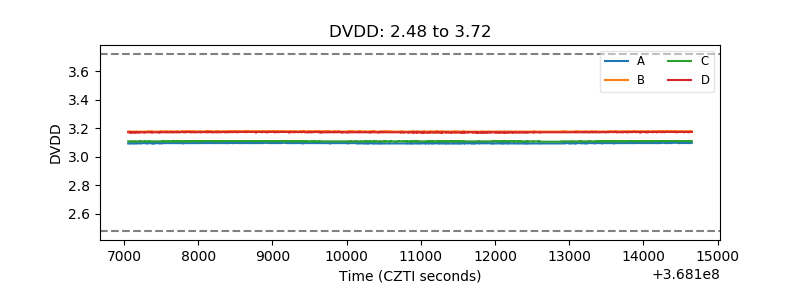 |
| Temperature 1 |  |
| Veto HV Monitor | 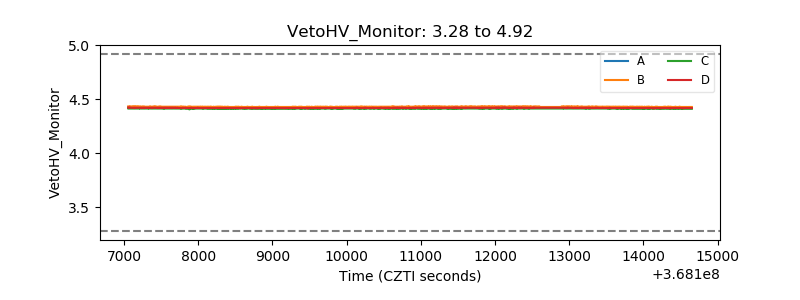 |
| Veto LLD | 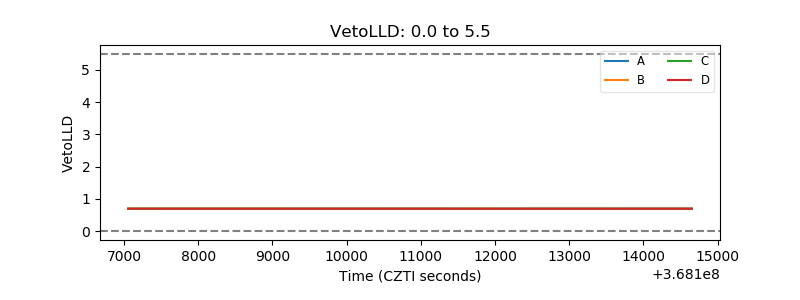 |
| Alpha Counter | 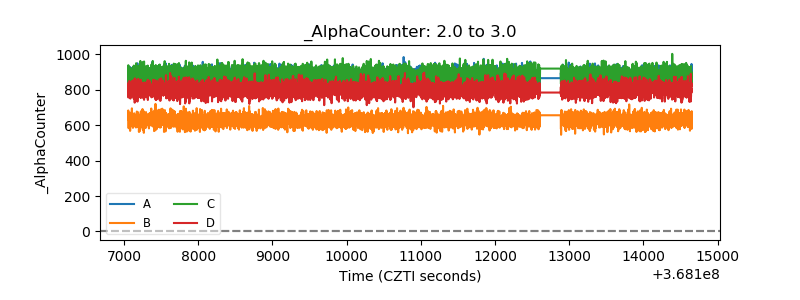 |
| _CPM_Rate | 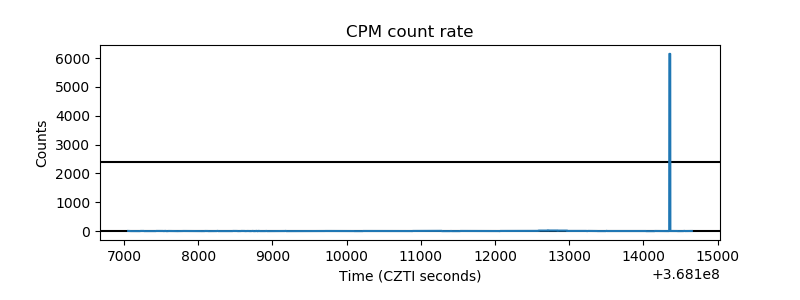 |
| CZT Counter | 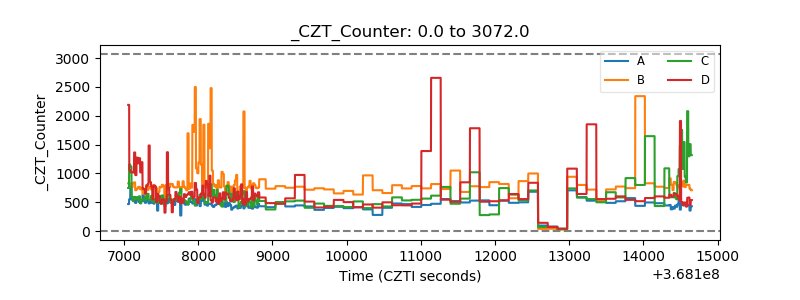 |
| +2.5 Volts monitor |  |
| +5 Volts monitor | 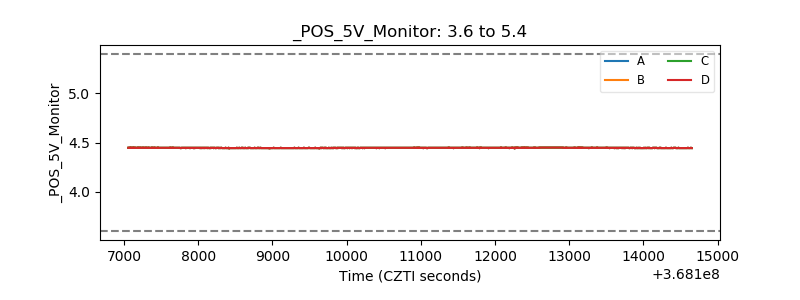 |
| _ROLL_ROT | 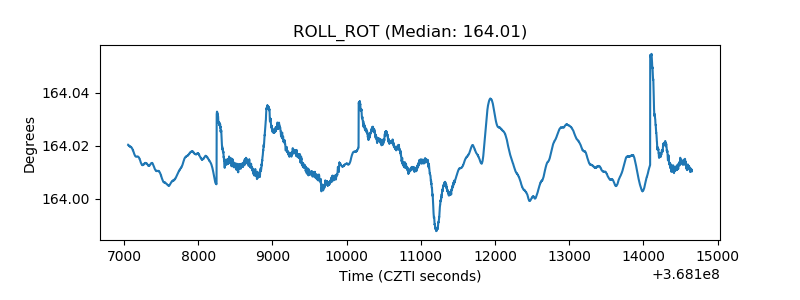 |
| _Roll_DEC | 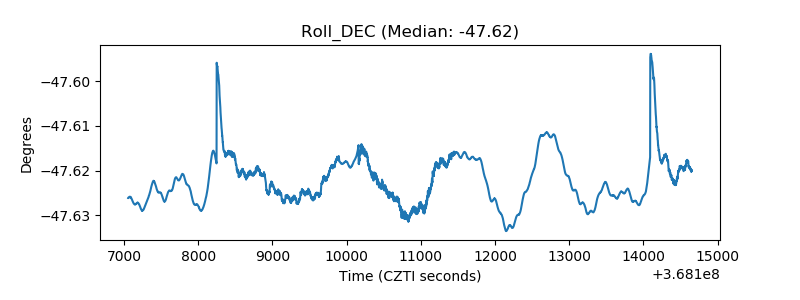 |
| _Roll_RA | 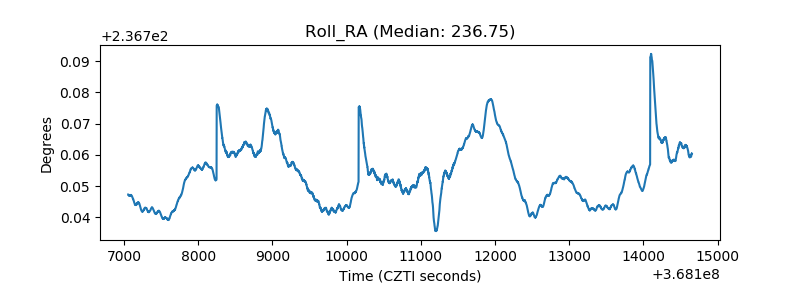 |
| Veto Counter | 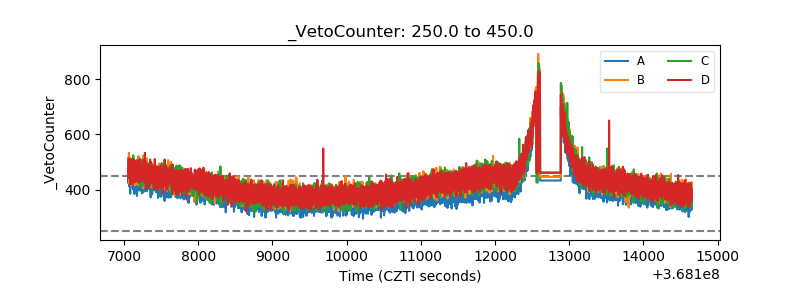 |