| Param | Original file | Final file |
|---|---|---|
| Filename | modeM0/AS1T04_046T01_9000004680_32038cztM0_level2.evt | modeM0/AS1T04_046T01_9000004680_32038cztM0_level2_quad_clean.evt |
| Size (bytes) | 596,413,440 | 98,084,160 |
| Size | 568.8 MB | 93.5 MB |
| Events in quadrant A | 3,247,171 | 646,994 |
| Events in quadrant B | 5,440,256 | 631,918 |
| Events in quadrant C | 4,715,282 | 604,911 |
| Events in quadrant D | 4,201,971 | 614,959 |
| Mode M0 | |||
|---|---|---|---|
| Quadrant | BADHDUFLAG | Total packets | Discarded packets |
| A | 0 | 14024 | 1 |
| B | 0 | 20913 | 1 |
| C | 0 | 18421 | 2 |
| D | 0 | 16690 | 1 |
| Mode M9 | |||
|---|---|---|---|
| Quadrant | BADHDUFLAG | Total packets | Discarded packets |
| A | 0 | 1 | 0 |
| B | 0 | 1 | 0 |
| C | 0 | 1 | 0 |
| D | 0 | 1 | 0 |
| Mode SS | |||
|---|---|---|---|
| Quadrant | BADHDUFLAG | Total packets | Discarded packets |
| A | 0 | 138 | 0 |
| B | 0 | 138 | 0 |
| C | 0 | 138 | 0 |
| D | 0 | 138 | 0 |
| Quadrant | Total seconds | Saturated seconds | Saturation percentage |
|---|---|---|---|
| A | 6762 | 78 | 1.153505% |
| B | 6762 | 224 | 3.312629% |
| C | 6761 | 462 | 6.833309% |
| D | 6761 | 97 | 1.434699% |
Noise dominated data is calculated using 1-second bins in cleaned event files. If a bin has >2000 counts, and if more than 50% of those come from <1% of pixels, then it is considered to be noise-dominated and hence unusable.
| Quadrant | # 1 sec bins | Bins with >0 counts | Bins with >2000 counts | High rate bins dominated by noise | Noise dominated (total time) | Noise dominated (detector-on time) | Marked lightcurve |
|---|---|---|---|---|---|---|---|
| A | 6877 | 6762 | 0 | 0 | 0.00% | 0.00% | 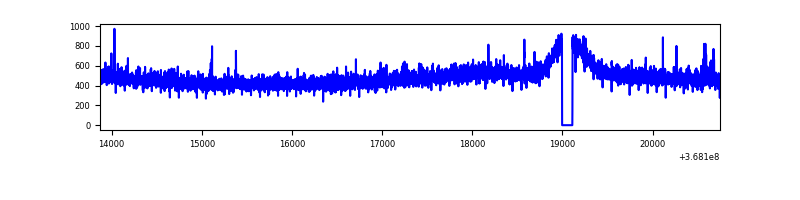 |
| B | 6877 | 6763 | 27 | 27 | 0.39% | 0.40% | 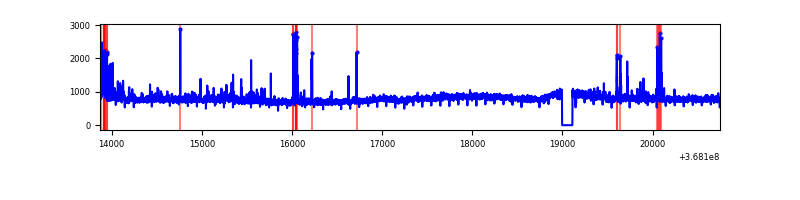 |
| C | 6876 | 6762 | 228 | 228 | 3.32% | 3.37% |  |
| D | 6876 | 6762 | 54 | 54 | 0.79% | 0.80% | 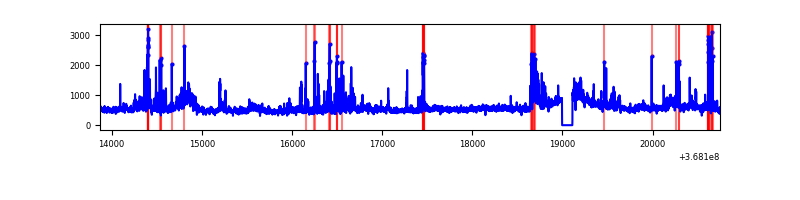 |
Top three noisy pixels from each quadrant. If the there are fewer than three noisy pixels in the level2.evt file, extra rows are filled as -1
| Pixel properties | Quadrant properties | ||||||
|---|---|---|---|---|---|---|---|
| Quadrant | DetID | PixID | Counts | Sigma | Mean | Median | Sigma |
| A | 13 | 254 | 13279 | 73.81 | 835 | 817 | 168.8 |
| A | 15 | 174 | 10531 | 57.53 | 835 | 817 | 168.8 |
| A | 13 | 6 | 9448 | 51.12 | 835 | 817 | 168.8 |
| B | 6 | 159 | 1936546 | 12404.58 | 818 | 796 | 156.1 |
| B | 10 | 245 | 100765 | 640.62 | 818 | 796 | 156.1 |
| B | 5 | 172 | 87275 | 554.17 | 818 | 796 | 156.1 |
| C | 3 | 233 | 997564 | 5457.62 | 777 | 781 | 182.6 |
| C | 0 | 10 | 516476 | 2823.55 | 777 | 781 | 182.6 |
| C | 14 | 238 | 125822 | 684.63 | 777 | 781 | 182.6 |
| D | 8 | 195 | 687421 | 3571.56 | 803 | 779 | 192.3 |
| D | 2 | 250 | 181652 | 940.81 | 803 | 779 | 192.3 |
| D | 10 | 199 | 88053 | 453.95 | 803 | 779 | 192.3 |
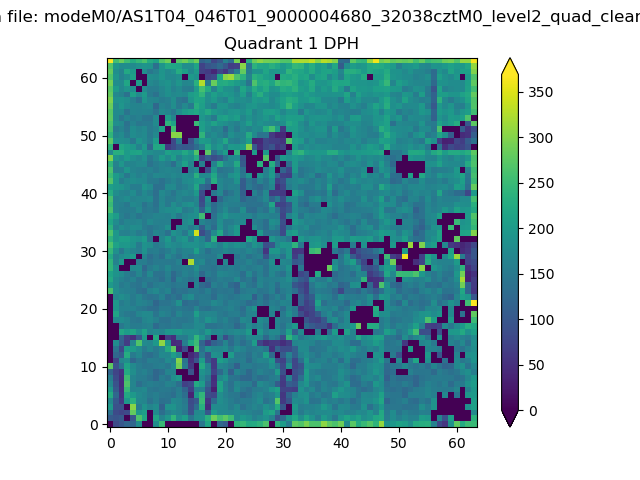
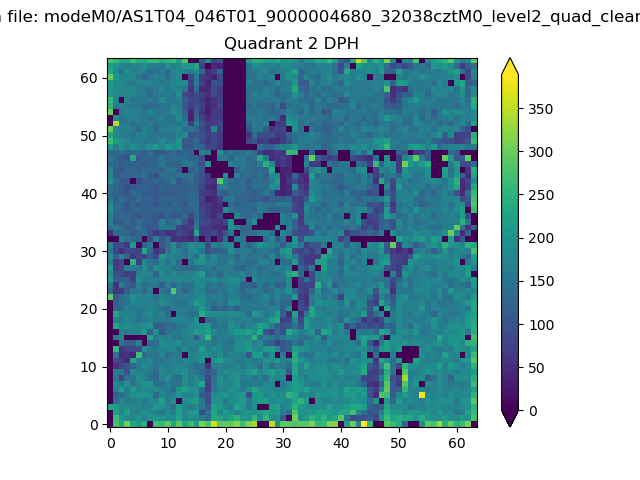
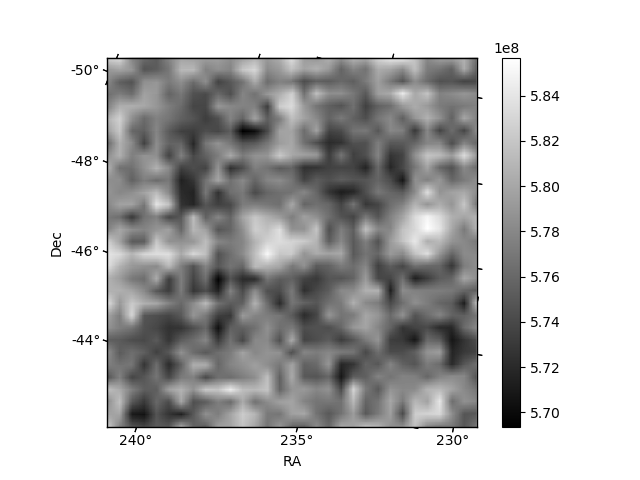
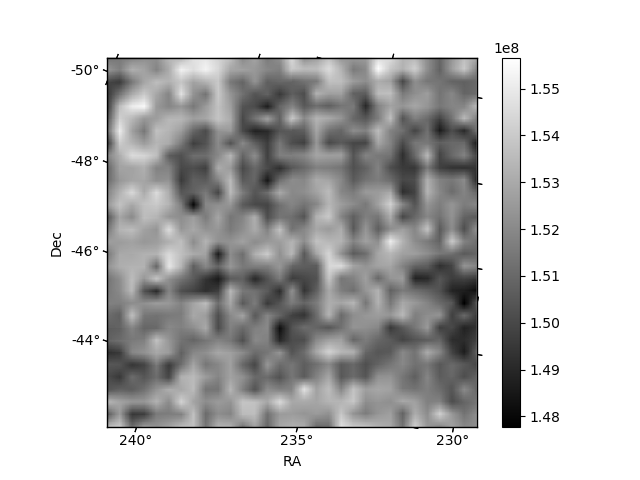
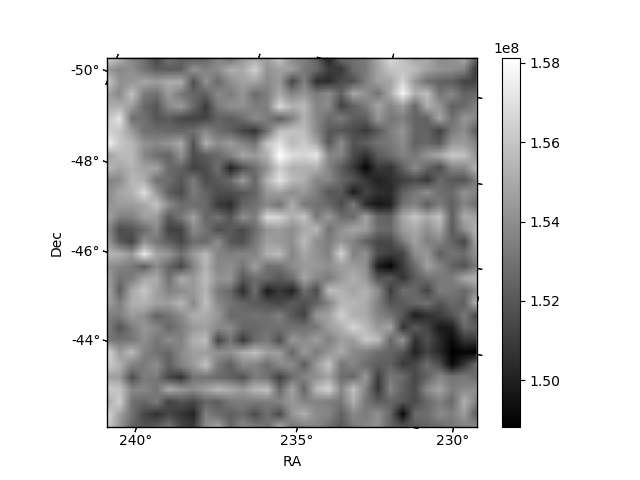
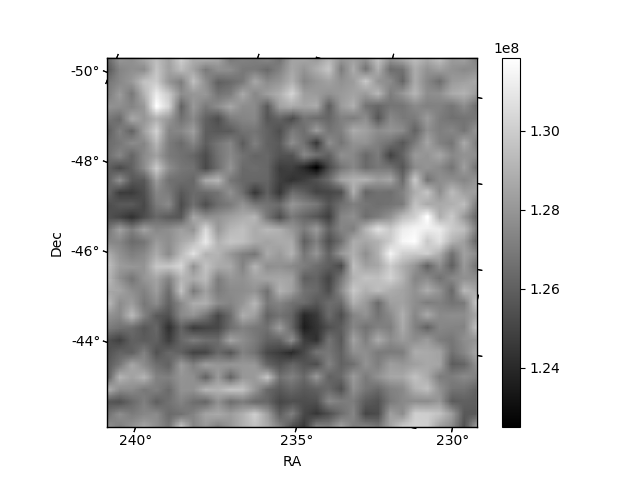
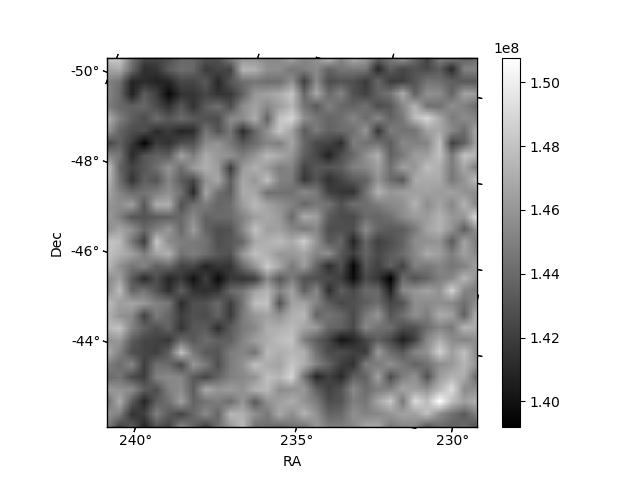
Histogram calculated using DETX and DETY for each event in the final _common_clean file
| Quadrant A | 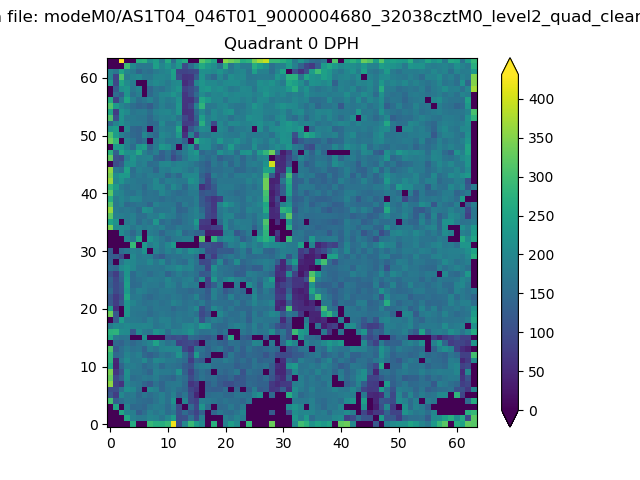 |
 |
Quadrant B |
|---|---|---|---|
| Quadrant D | 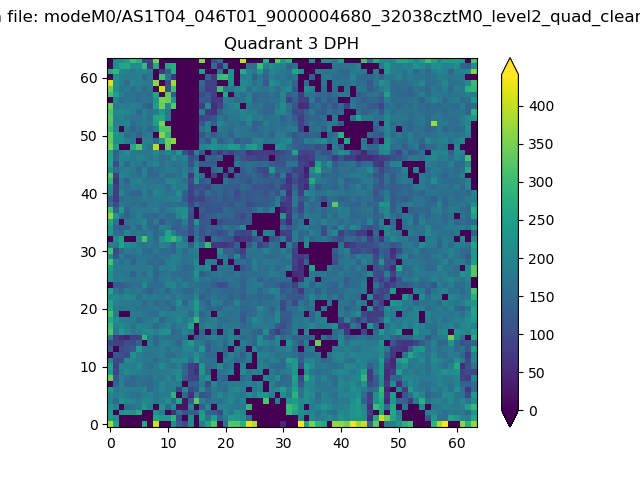 |
 |
Quadrant C |
| Plot type | Count rate plots | Images |
|---|---|---|
| Comparison with Poisson distribution Blue bars denote a histogram of data divided into 1 sec bins. Red curve is a Poisson curve with rate = median count rate of data. |
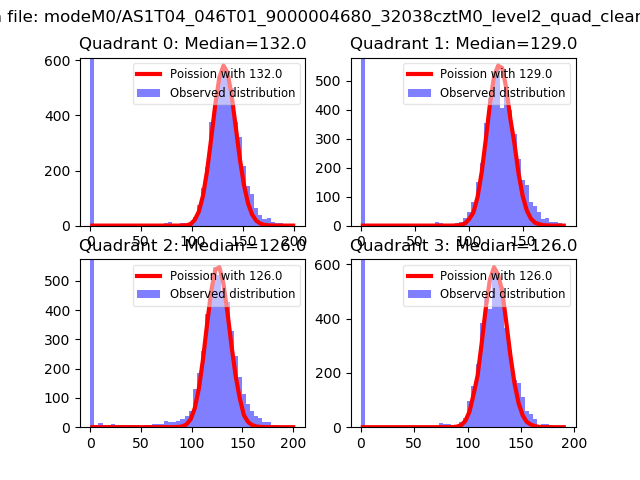 |
 |
| Quadrant-wise count rates Data is divided into 100 sec bins |
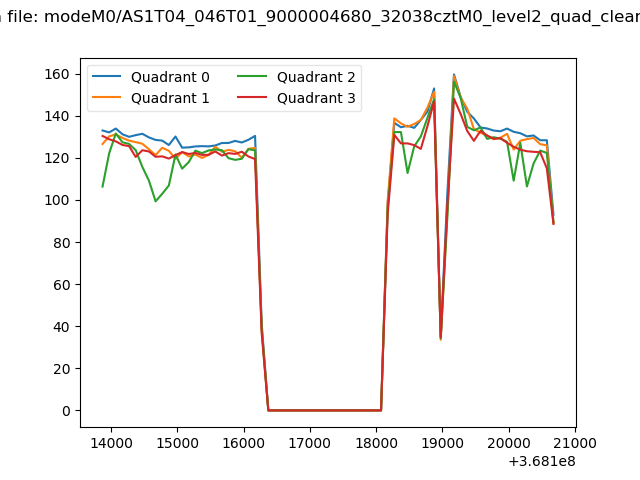 |
|
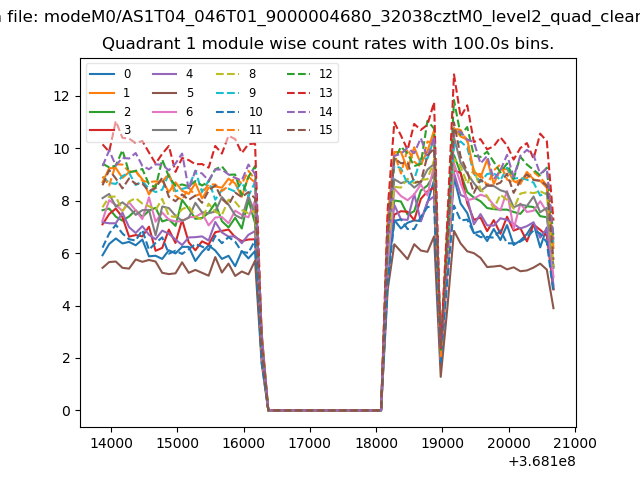
| Module-wise count rates for Quadrant A Data is divided into 100 sec bins |
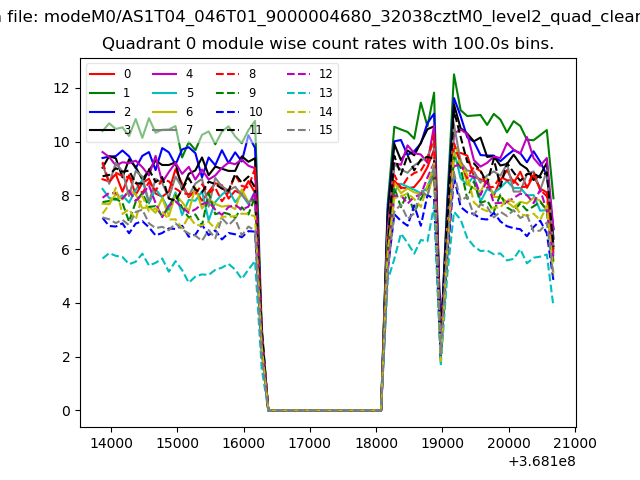 |
 |
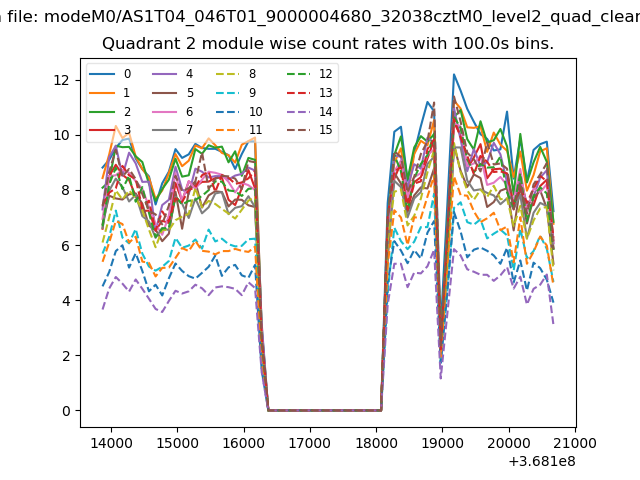
| Module-wise count rates for Quadrant B Data is divided into 100 sec bins |
 |
 |
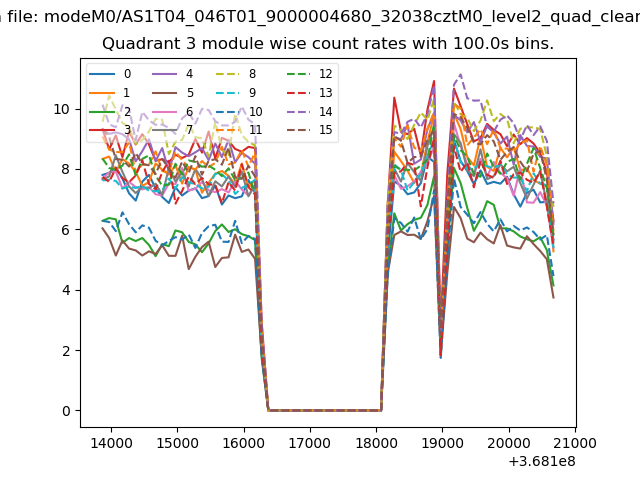
| Module-wise count rates for Quadrant C Data is divided into 100 sec bins |
 |
 |
| Module-wise count rates for Quadrant D Data is divided into 100 sec bins |
 |
 |
| Parameter | Plot |
|---|---|
| CZT HV Monitor | 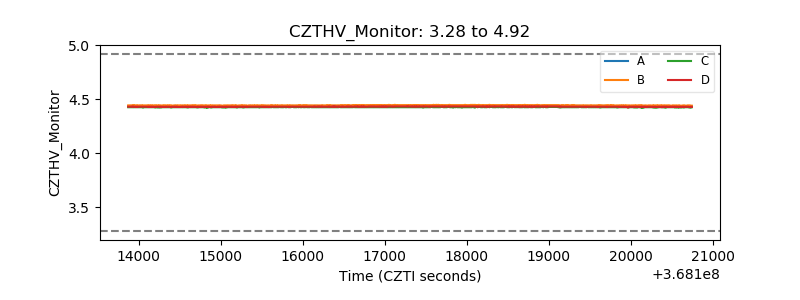 |
| D_VDD | 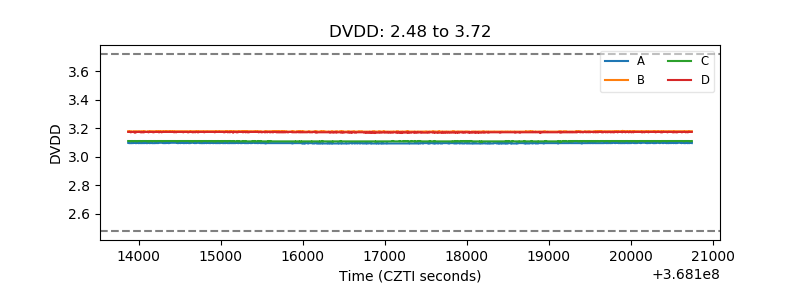 |
| Temperature 1 | 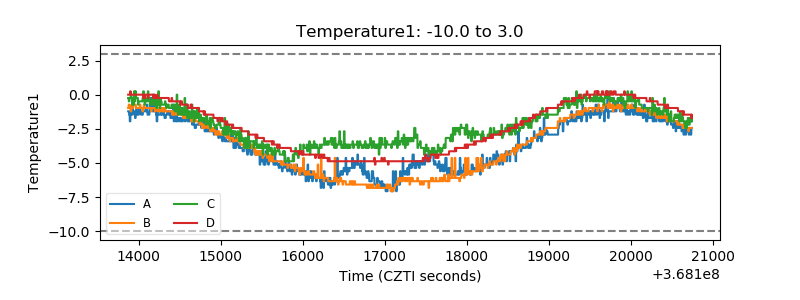 |
| Veto HV Monitor | 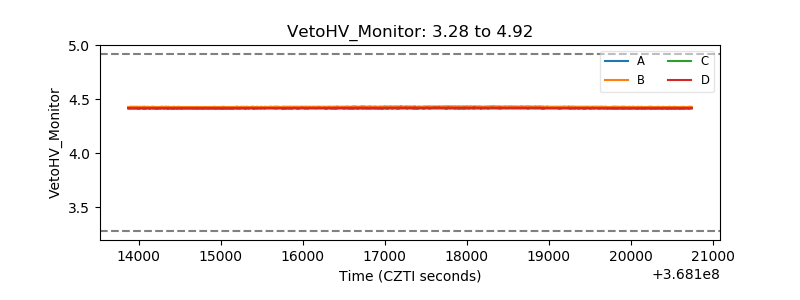 |
| Veto LLD | 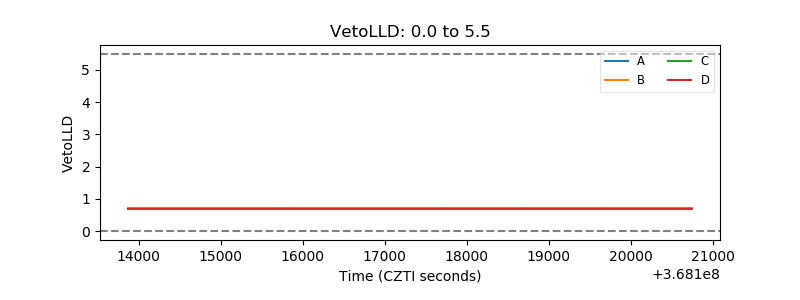 |
| Alpha Counter | 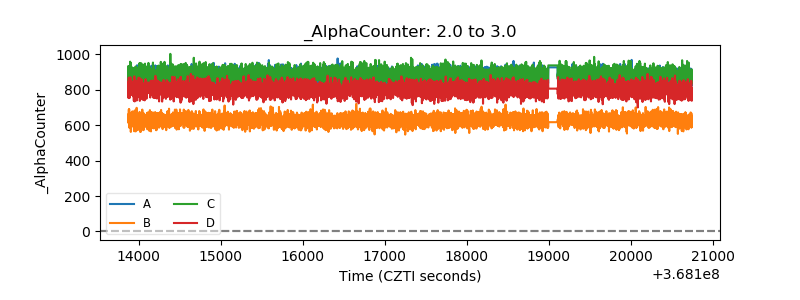 |
| _CPM_Rate | 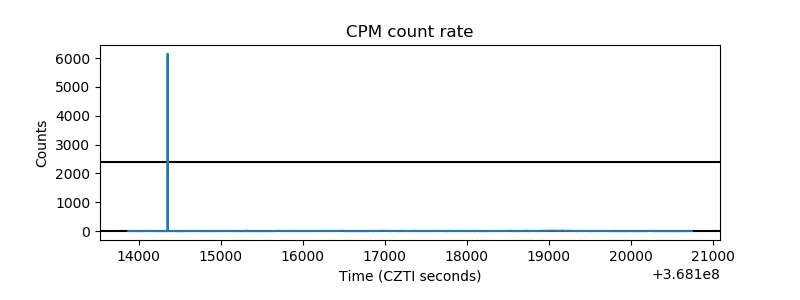 |
| CZT Counter | 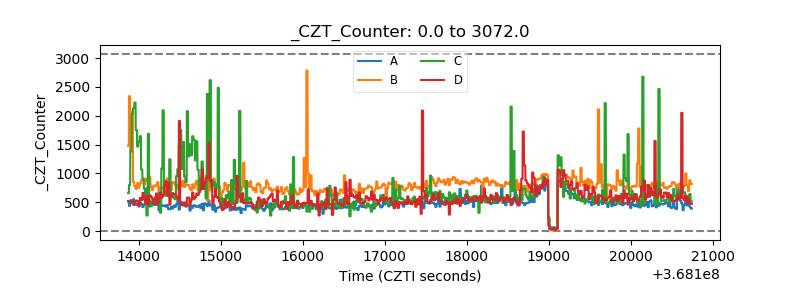 |
| +2.5 Volts monitor |  |
| +5 Volts monitor |  |
| _ROLL_ROT | 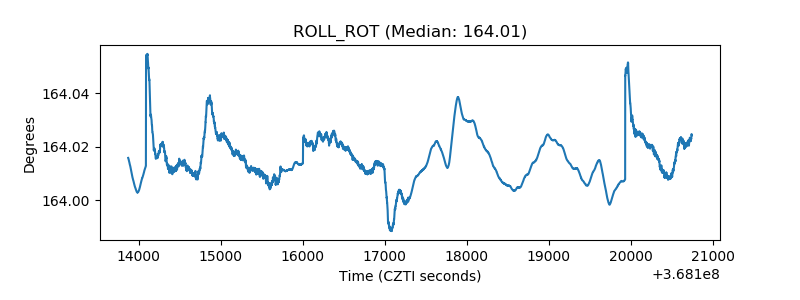 |
| _Roll_DEC | 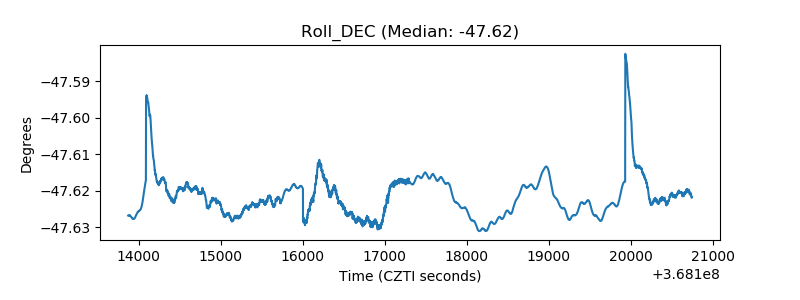 |
| _Roll_RA | 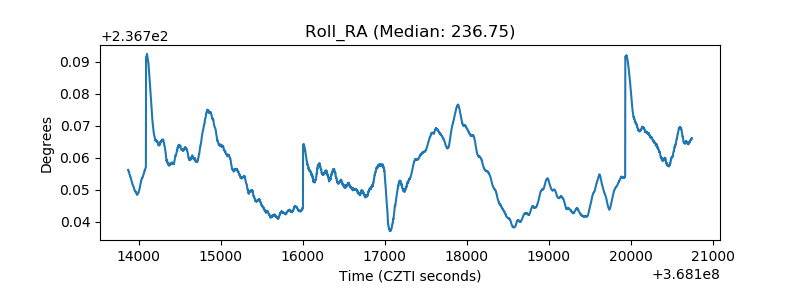 |
| Veto Counter | 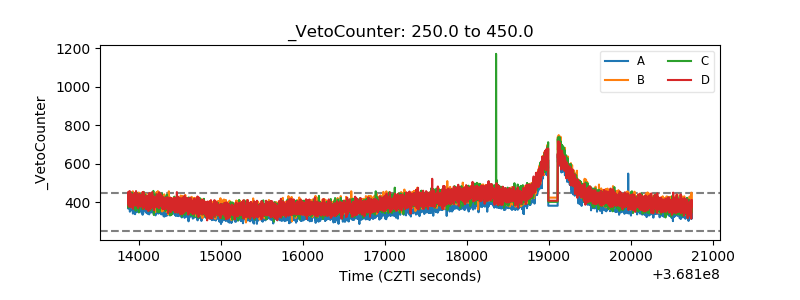 |