| Param | Original file | Final file |
|---|---|---|
| Filename | modeM0/AS1T04_046T01_9000004680_32039cztM0_level2.evt | modeM0/AS1T04_046T01_9000004680_32039cztM0_level2_quad_clean.evt |
| Size (bytes) | 622,975,680 | 96,606,720 |
| Size | 594.1 MB | 92.1 MB |
| Events in quadrant A | 3,222,068 | 636,302 |
| Events in quadrant B | 5,285,552 | 625,480 |
| Events in quadrant C | 5,688,580 | 589,668 |
| Events in quadrant D | 4,213,993 | 603,418 |
| Mode M0 | |||
|---|---|---|---|
| Quadrant | BADHDUFLAG | Total packets | Discarded packets |
| A | 0 | 13915 | 1 |
| B | 0 | 20674 | 1 |
| C | 0 | 21667 | 1 |
| D | 0 | 16918 | 2 |
| Mode M9 | |||
|---|---|---|---|
| Quadrant | BADHDUFLAG | Total packets | Discarded packets |
| A | 0 | 4 | 0 |
| B | 0 | 4 | 0 |
| C | 0 | 4 | 0 |
| D | 0 | 4 | 0 |
| Mode SS | |||
|---|---|---|---|
| Quadrant | BADHDUFLAG | Total packets | Discarded packets |
| A | 0 | 136 | 0 |
| B | 0 | 136 | 0 |
| C | 0 | 136 | 0 |
| D | 0 | 136 | 0 |
| Quadrant | Total seconds | Saturated seconds | Saturation percentage |
|---|---|---|---|
| A | 6758 | 13 | 0.192365% |
| B | 6759 | 85 | 1.257582% |
| C | 6759 | 508 | 7.515905% |
| D | 6758 | 147 | 2.175200% |
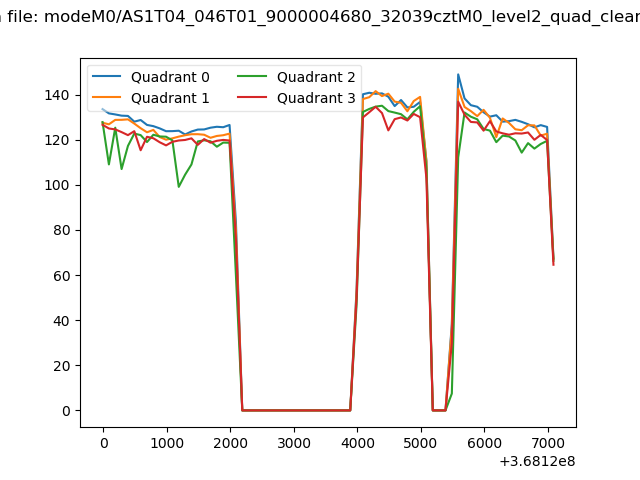
Noise dominated data is calculated using 1-second bins in cleaned event files. If a bin has >2000 counts, and if more than 50% of those come from <1% of pixels, then it is considered to be noise-dominated and hence unusable.
| Quadrant | # 1 sec bins | Bins with >0 counts | Bins with >2000 counts | High rate bins dominated by noise | Noise dominated (total time) | Noise dominated (detector-on time) | Marked lightcurve |
|---|---|---|---|---|---|---|---|
| A | 7158 | 6759 | 3 | 3 | 0.04% | 0.04% | 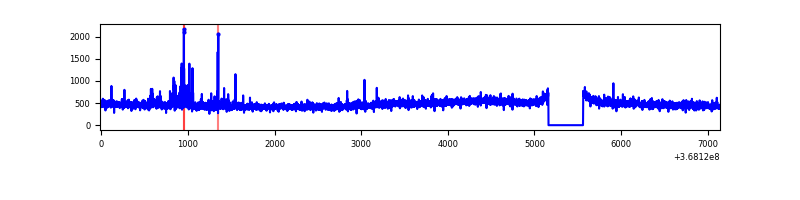 |
| B | 7159 | 6760 | 27 | 27 | 0.38% | 0.40% | 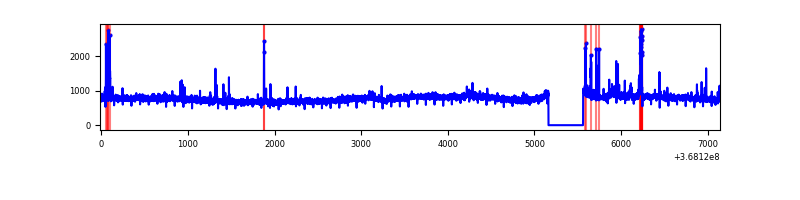 |
| C | 7159 | 6760 | 313 | 313 | 4.37% | 4.63% | 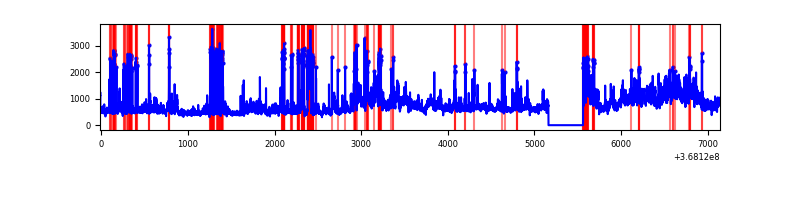 |
| D | 7158 | 6759 | 119 | 119 | 1.66% | 1.76% | 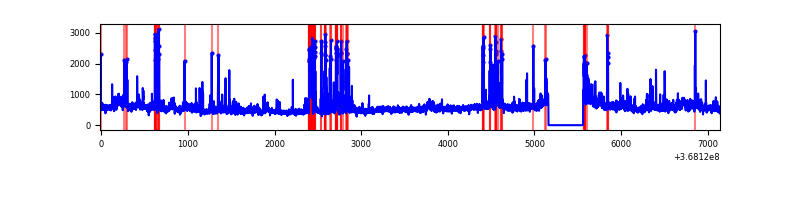 |
Top three noisy pixels from each quadrant. If the there are fewer than three noisy pixels in the level2.evt file, extra rows are filled as -1
| Pixel properties | Quadrant properties | ||||||
|---|---|---|---|---|---|---|---|
| Quadrant | DetID | PixID | Counts | Sigma | Mean | Median | Sigma |
| A | 15 | 174 | 72344 | 435.67 | 811 | 796 | 164.2 |
| A | 13 | 254 | 13657 | 78.31 | 811 | 796 | 164.2 |
| A | 13 | 6 | 12893 | 73.66 | 811 | 796 | 164.2 |
| B | 6 | 159 | 1965176 | 12848.44 | 798 | 778 | 152.9 |
| B | 5 | 172 | 113635 | 738.16 | 798 | 778 | 152.9 |
| B | 0 | 190 | 29928 | 190.66 | 798 | 778 | 152.9 |
| C | 3 | 233 | 1703142 | 9752.73 | 744 | 746 | 174.6 |
| C | 0 | 10 | 910355 | 5210.99 | 744 | 746 | 174.6 |
| C | 14 | 238 | 121660 | 692.7 | 744 | 746 | 174.6 |
| D | 8 | 195 | 601698 | 3226.35 | 773 | 751 | 186.3 |
| D | 2 | 250 | 444440 | 2382.06 | 773 | 751 | 186.3 |
| D | 12 | 218 | 68398 | 363.18 | 773 | 751 | 186.3 |
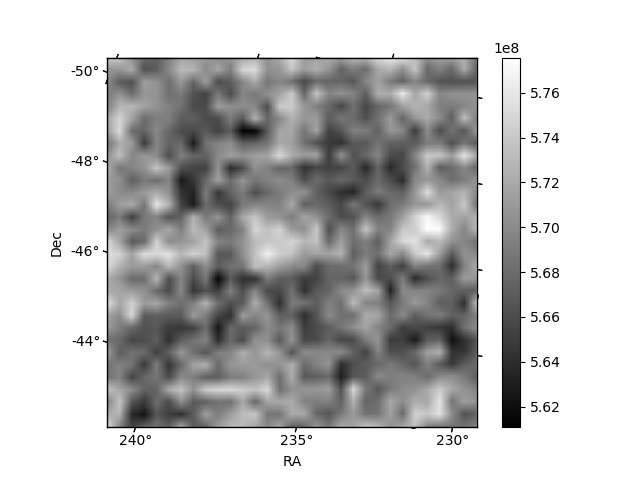
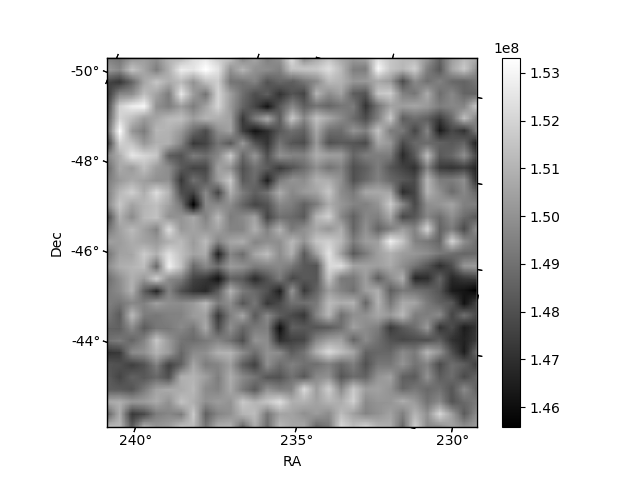
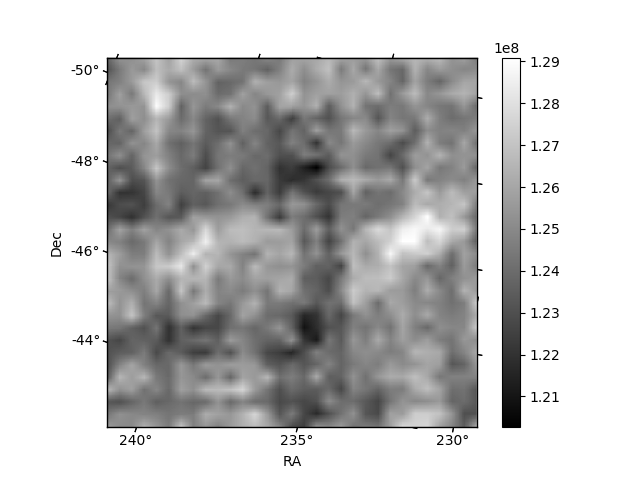
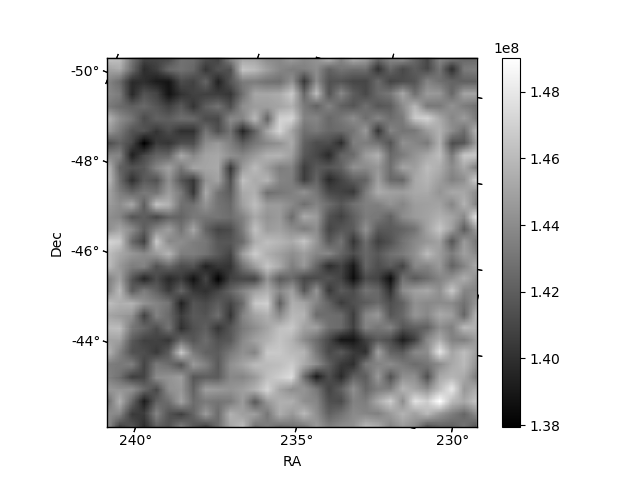
Histogram calculated using DETX and DETY for each event in the final _common_clean file
| Quadrant A | 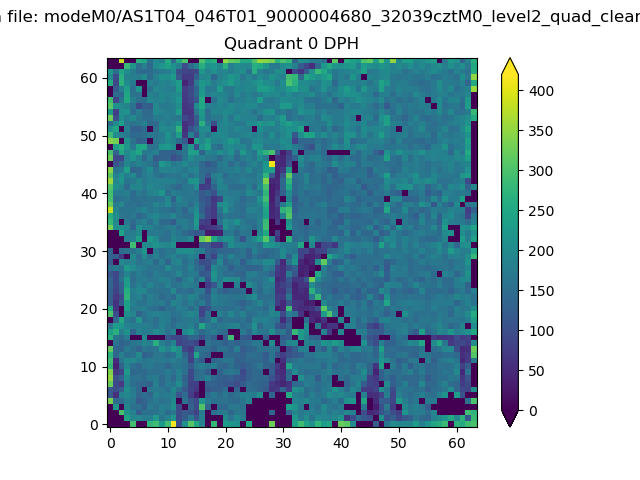 |
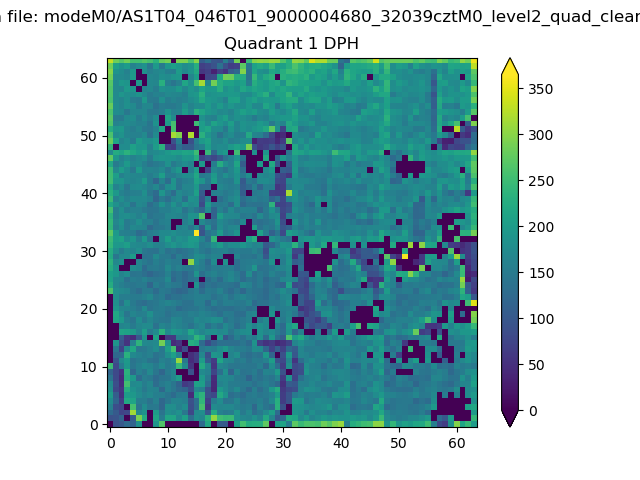 |
Quadrant B |
|---|---|---|---|
| Quadrant D | 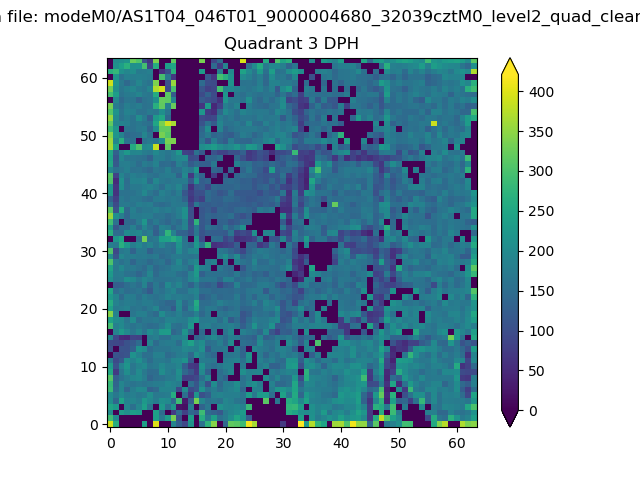 |
 |
Quadrant C |
| Plot type | Count rate plots | Images |
|---|---|---|
| Comparison with Poisson distribution Blue bars denote a histogram of data divided into 1 sec bins. Red curve is a Poisson curve with rate = median count rate of data. |
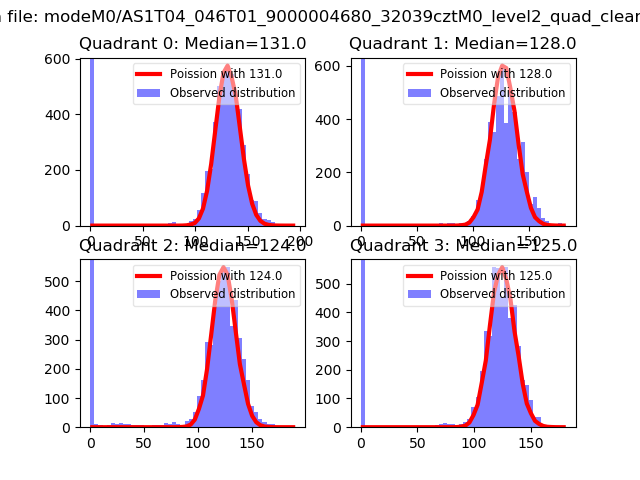 |
 |
| Quadrant-wise count rates Data is divided into 100 sec bins |
 |
|
| Module-wise count rates for Quadrant A Data is divided into 100 sec bins |
 |
 |
| Module-wise count rates for Quadrant B Data is divided into 100 sec bins |
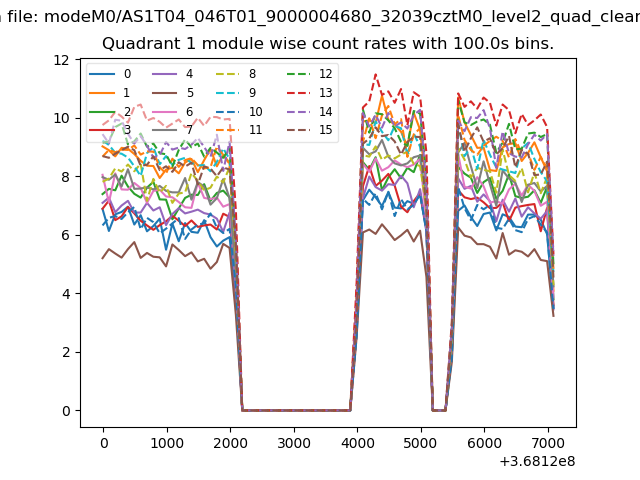 |
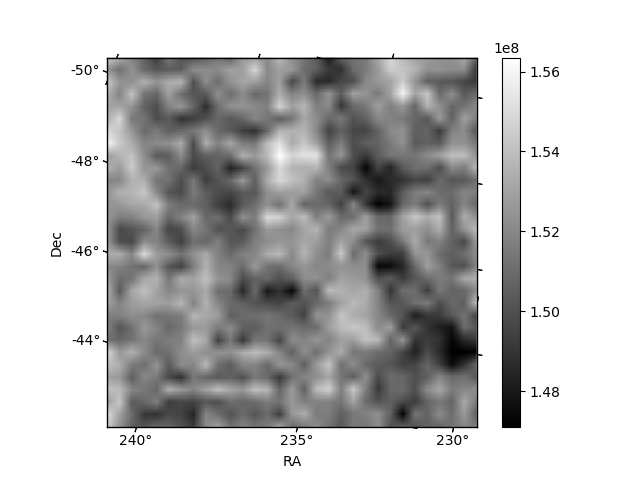 |
| Module-wise count rates for Quadrant C Data is divided into 100 sec bins |
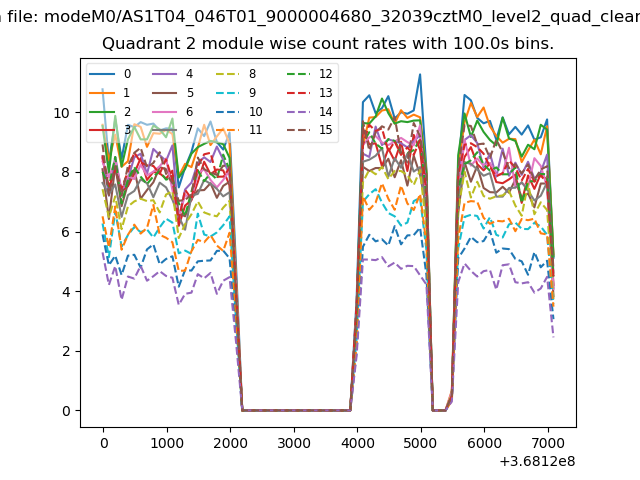 |
 |
| Module-wise count rates for Quadrant D Data is divided into 100 sec bins |
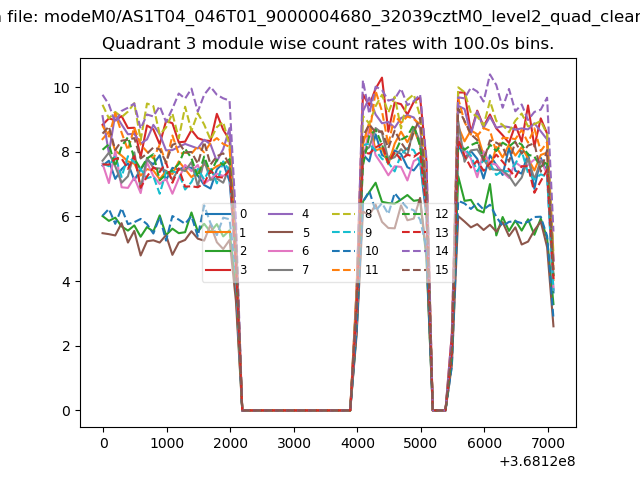 |
 |
| Parameter | Plot |
|---|---|
| CZT HV Monitor | 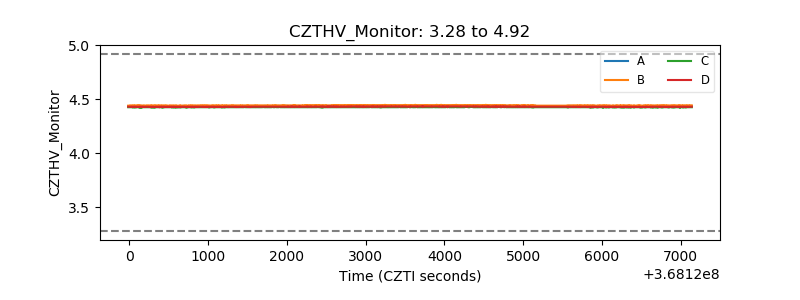 |
| D_VDD | 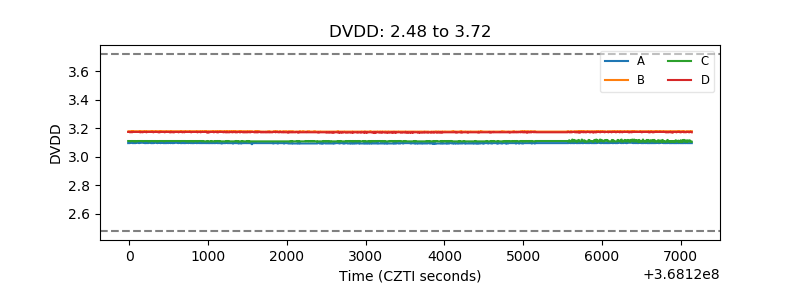 |
| Temperature 1 | 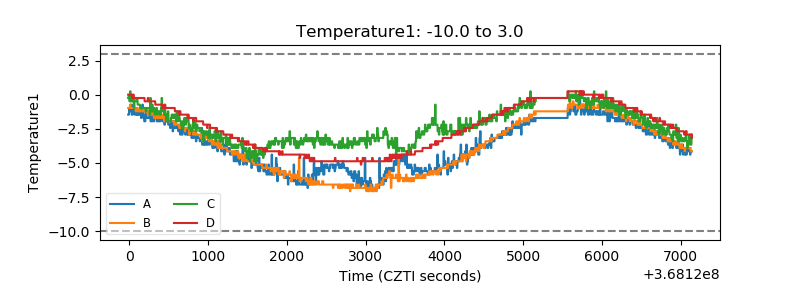 |
| Veto HV Monitor | 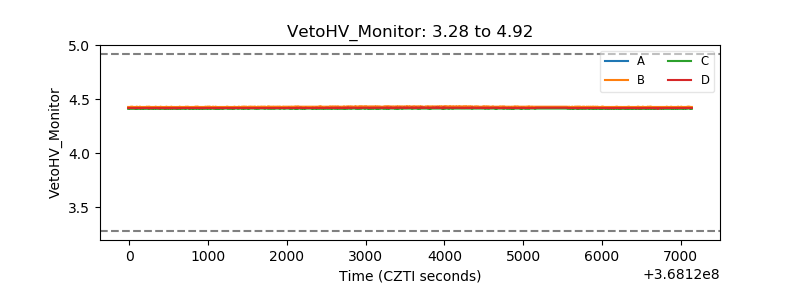 |
| Veto LLD |  |
| Alpha Counter | 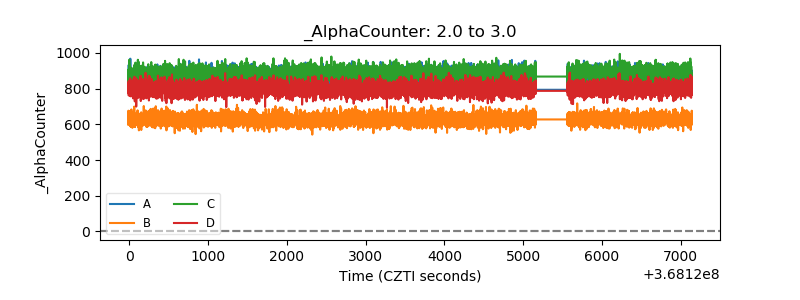 |
| _CPM_Rate | 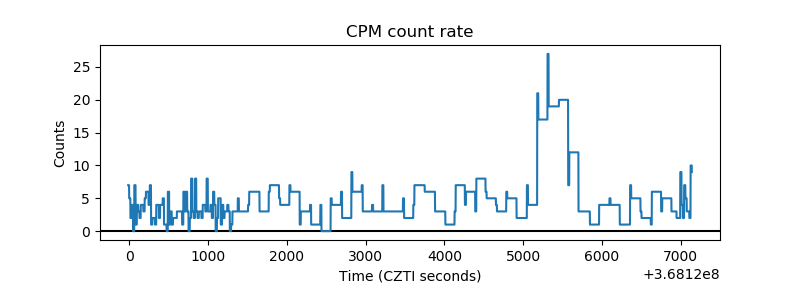 |
| CZT Counter | 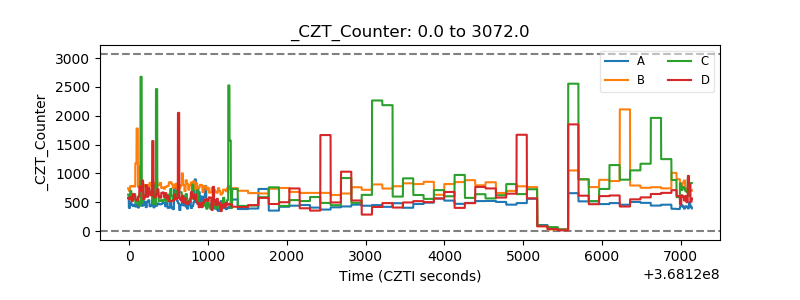 |
| +2.5 Volts monitor |  |
| +5 Volts monitor |  |
| _ROLL_ROT | 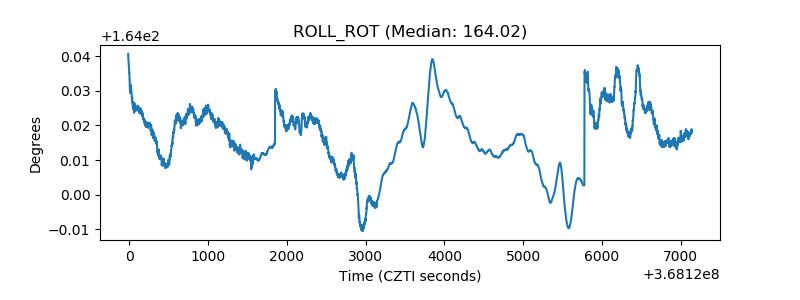 |
| _Roll_DEC | 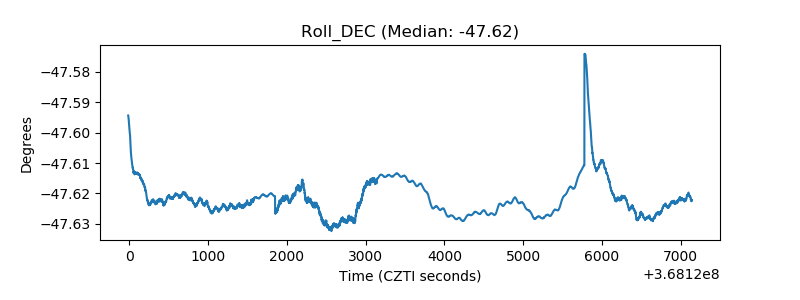 |
| _Roll_RA | 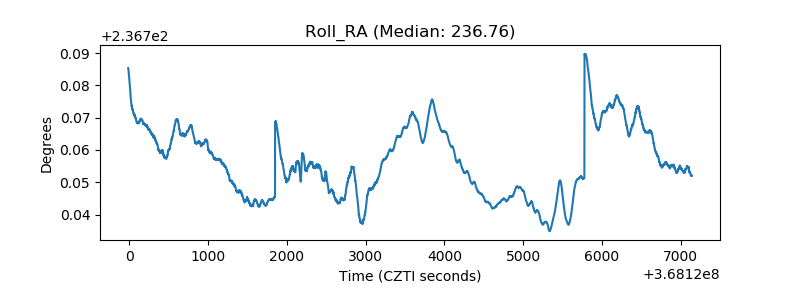 |
| Veto Counter | 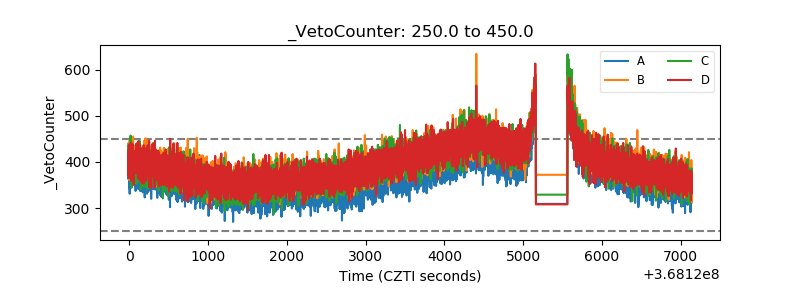 |