| Param | Original file | Final file |
|---|---|---|
| Filename | modeM0/AS1T04_046T01_9000004680_32042cztM0_level2.evt | modeM0/AS1T04_046T01_9000004680_32042cztM0_level2_quad_clean.evt |
| Size (bytes) | 767,652,480 | 127,275,840 |
| Size | 732.1 MB | 121.4 MB |
| Events in quadrant A | 4,211,263 | 850,783 |
| Events in quadrant B | 6,979,239 | 832,899 |
| Events in quadrant C | 5,112,596 | 799,047 |
| Events in quadrant D | 6,358,967 | 769,151 |
| Mode M0 | |||
|---|---|---|---|
| Quadrant | BADHDUFLAG | Total packets | Discarded packets |
| A | 0 | 17881 | 2 |
| B | 0 | 27070 | 2 |
| C | 0 | 20483 | 2 |
| D | 0 | 24741 | 2 |
| Mode M9 | |||
|---|---|---|---|
| Quadrant | BADHDUFLAG | Total packets | Discarded packets |
| A | 0 | 16 | 0 |
| B | 0 | 16 | 0 |
| C | 0 | 16 | 0 |
| D | 0 | 16 | 0 |
| Mode SS | |||
|---|---|---|---|
| Quadrant | BADHDUFLAG | Total packets | Discarded packets |
| A | 0 | 178 | 0 |
| B | 0 | 178 | 0 |
| C | 0 | 178 | 0 |
| D | 0 | 178 | 0 |
| Quadrant | Total seconds | Saturated seconds | Saturation percentage |
|---|---|---|---|
| A | 8675 | 22 | 0.253602% |
| B | 8675 | 218 | 2.512968% |
| C | 8676 | 454 | 5.232826% |
| D | 8676 | 620 | 7.146150% |
Noise dominated data is calculated using 1-second bins in cleaned event files. If a bin has >2000 counts, and if more than 50% of those come from <1% of pixels, then it is considered to be noise-dominated and hence unusable.
| Quadrant | # 1 sec bins | Bins with >0 counts | Bins with >2000 counts | High rate bins dominated by noise | Noise dominated (total time) | Noise dominated (detector-on time) | Marked lightcurve |
|---|---|---|---|---|---|---|---|
| A | 10265 | 8677 | 0 | 0 | 0.00% | 0.00% | 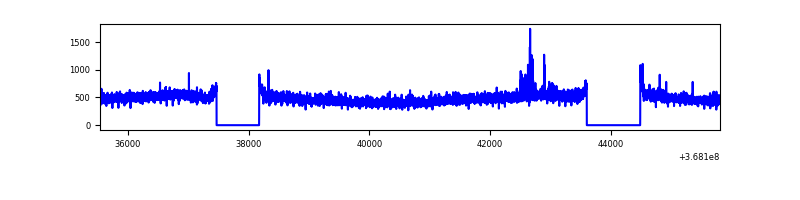 |
| B | 10265 | 8676 | 94 | 94 | 0.92% | 1.08% | 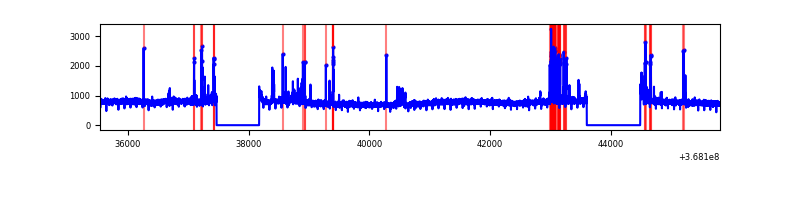 |
| C | 10266 | 8678 | 51 | 51 | 0.50% | 0.59% | 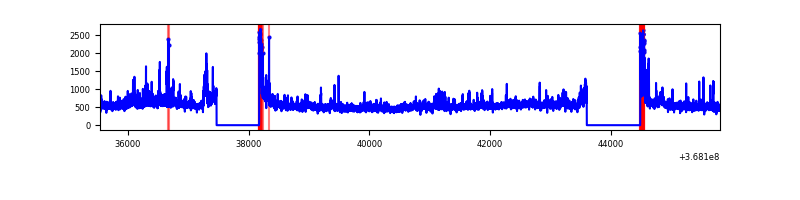 |
| D | 10266 | 8677 | 502 | 502 | 4.89% | 5.79% | 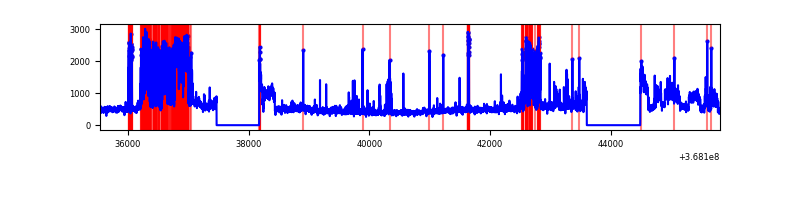 |
Top three noisy pixels from each quadrant. If the there are fewer than three noisy pixels in the level2.evt file, extra rows are filled as -1
| Pixel properties | Quadrant properties | ||||||
|---|---|---|---|---|---|---|---|
| Quadrant | DetID | PixID | Counts | Sigma | Mean | Median | Sigma |
| A | 14 | 238 | 52726 | 240.14 | 1070 | 1048 | 215.2 |
| A | 13 | 6 | 19993 | 88.03 | 1070 | 1048 | 215.2 |
| A | 13 | 254 | 17177 | 74.95 | 1070 | 1048 | 215.2 |
| B | 6 | 159 | 2415982 | 12048.19 | 1047 | 1019 | 200.4 |
| B | 5 | 172 | 277229 | 1378.01 | 1047 | 1019 | 200.4 |
| B | 0 | 245 | 52598 | 257.33 | 1047 | 1019 | 200.4 |
| C | 3 | 233 | 546655 | 2340.52 | 994 | 999 | 233.1 |
| C | 0 | 10 | 267756 | 1144.22 | 994 | 999 | 233.1 |
| C | 14 | 238 | 242859 | 1037.42 | 994 | 999 | 233.1 |
| D | 2 | 250 | 1554581 | 6509.46 | 999 | 974 | 238.7 |
| D | 8 | 195 | 940899 | 3938.19 | 999 | 974 | 238.7 |
| D | 2 | 234 | 47616 | 195.42 | 999 | 974 | 238.7 |
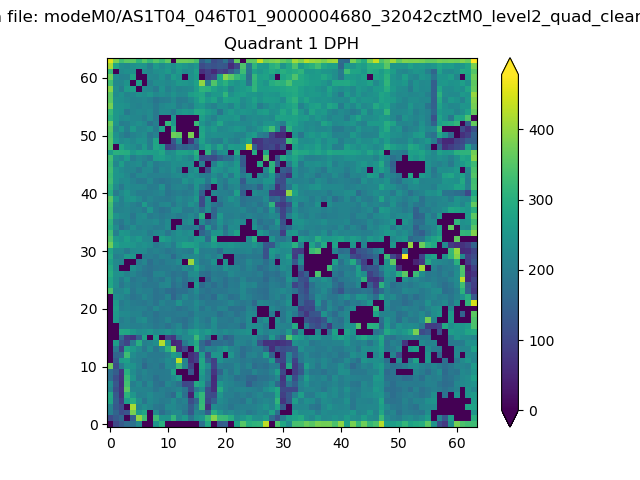
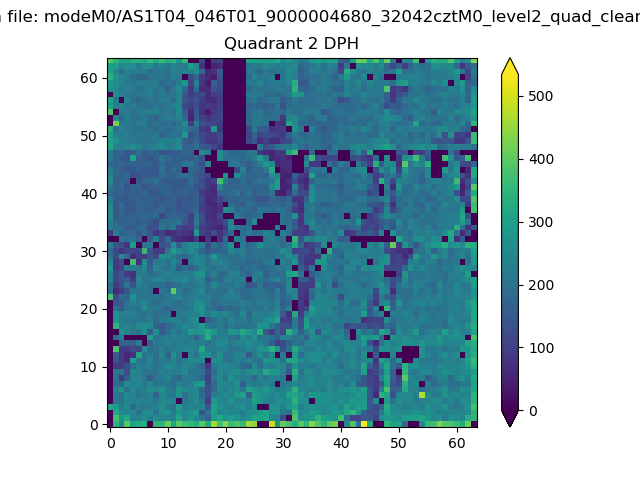
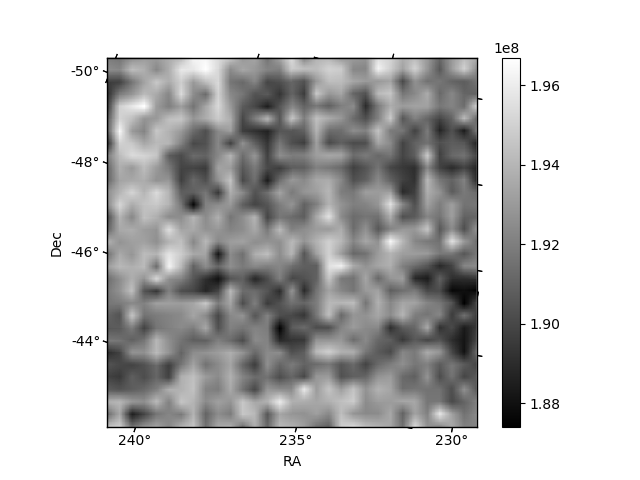
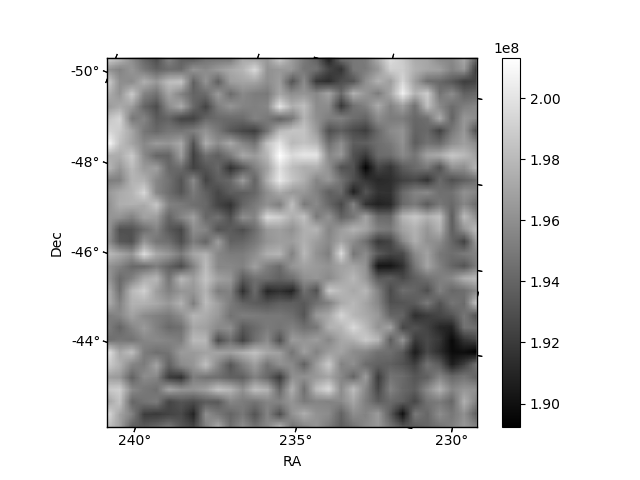
Histogram calculated using DETX and DETY for each event in the final _common_clean file
| Quadrant A |  |
 |
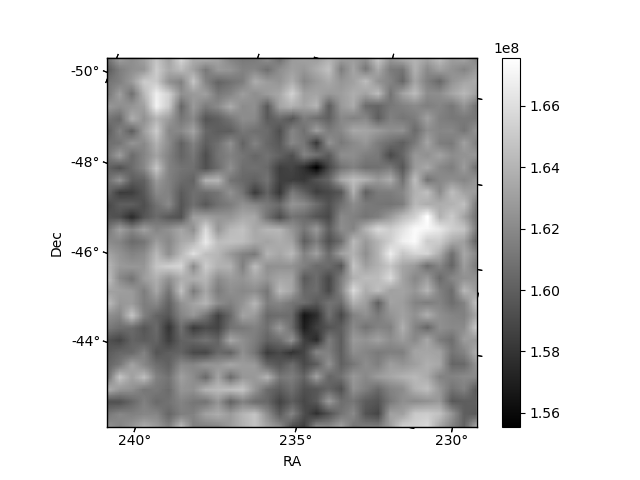
Quadrant B |
|---|---|---|---|
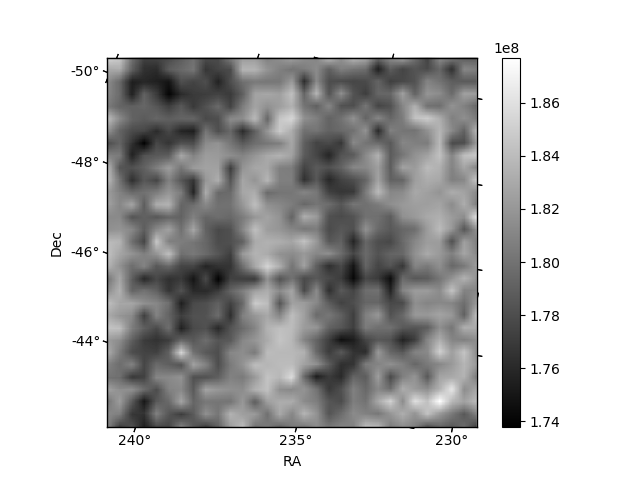
| Quadrant D | 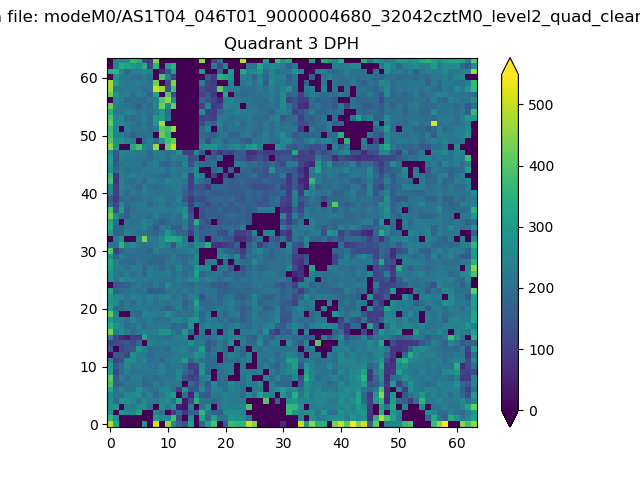 |
 |
Quadrant C |
| Plot type | Count rate plots | Images |
|---|---|---|
| Comparison with Poisson distribution Blue bars denote a histogram of data divided into 1 sec bins. Red curve is a Poisson curve with rate = median count rate of data. |
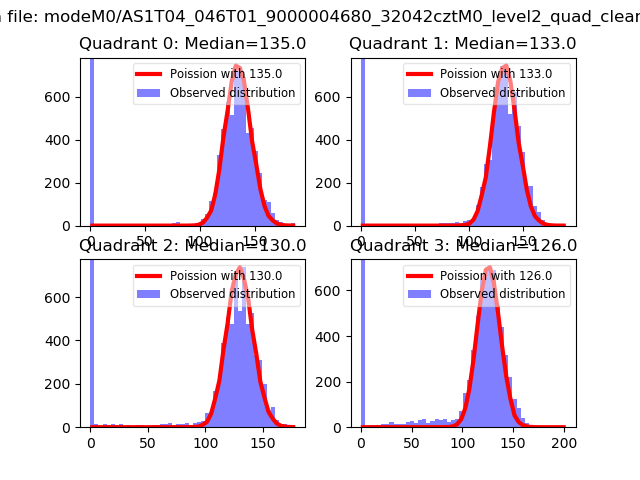 |
 |
| Quadrant-wise count rates Data is divided into 100 sec bins |
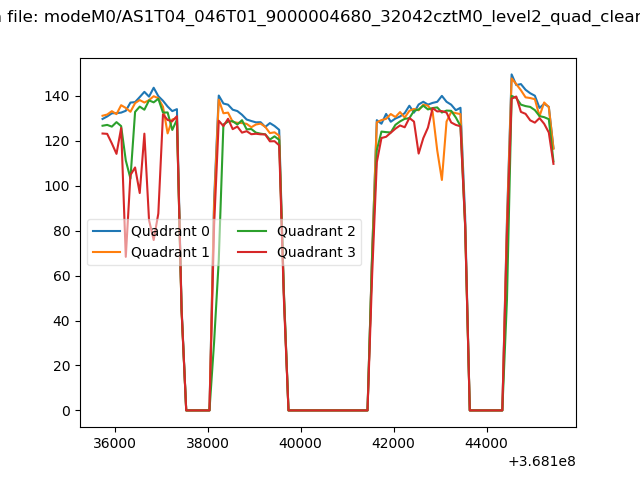 |
|
| Module-wise count rates for Quadrant A Data is divided into 100 sec bins |
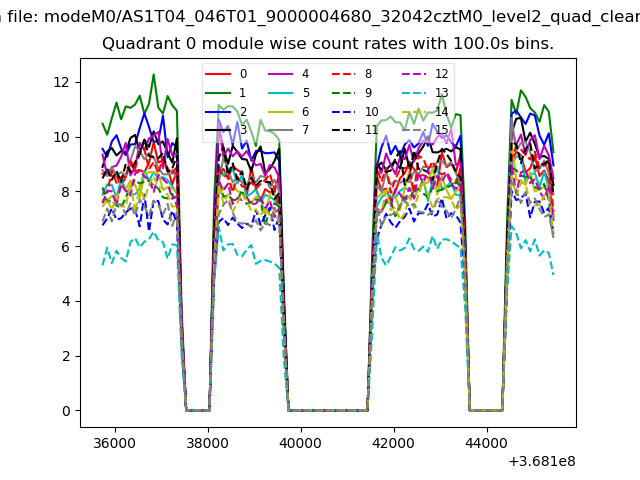 |
 |
| Module-wise count rates for Quadrant B Data is divided into 100 sec bins |
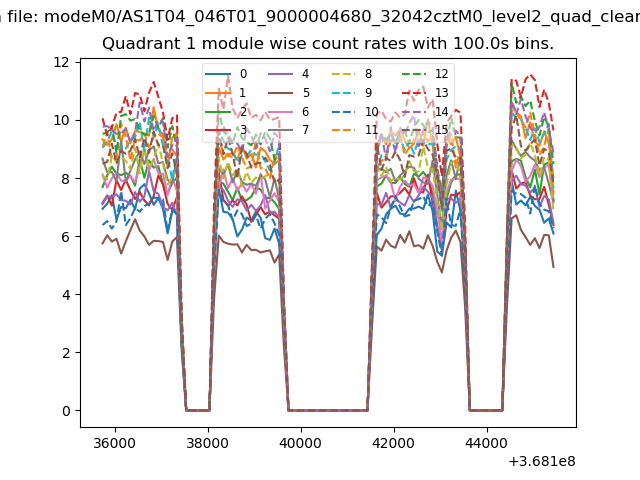 |
 |
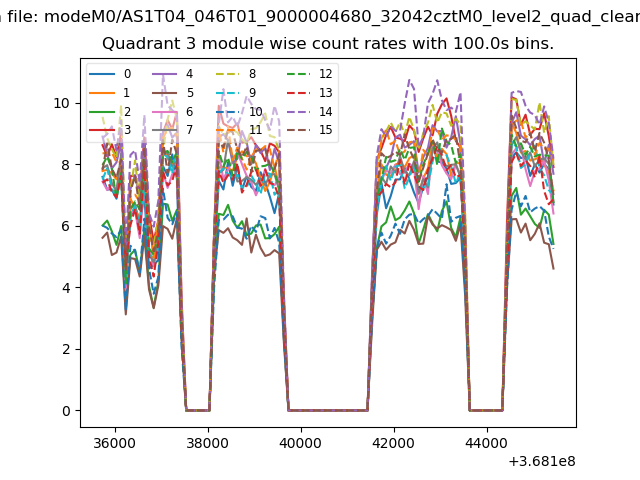
| Module-wise count rates for Quadrant C Data is divided into 100 sec bins |
 |
 |
| Module-wise count rates for Quadrant D Data is divided into 100 sec bins |
 |
 |
| Parameter | Plot |
|---|---|
| CZT HV Monitor | 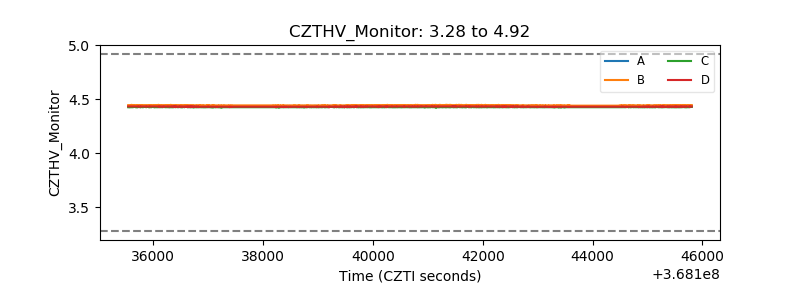 |
| D_VDD | 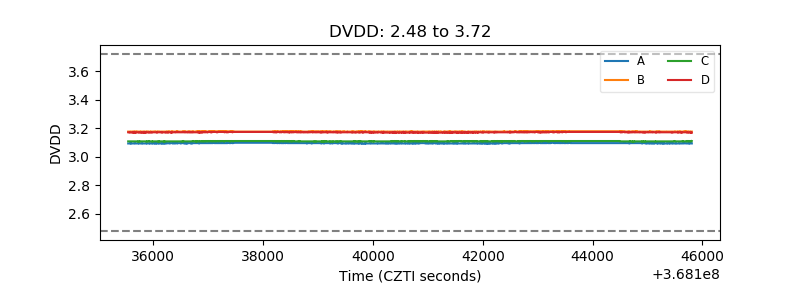 |
| Temperature 1 | 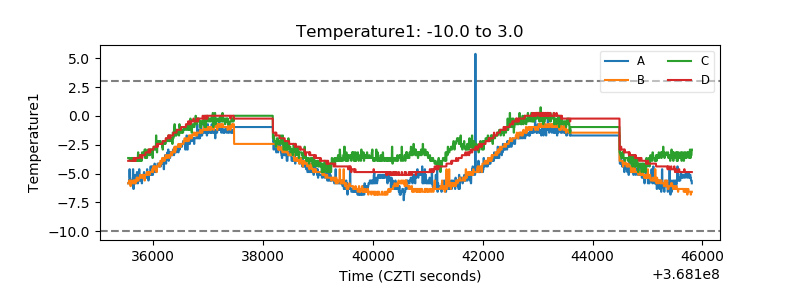 |
| Veto HV Monitor | 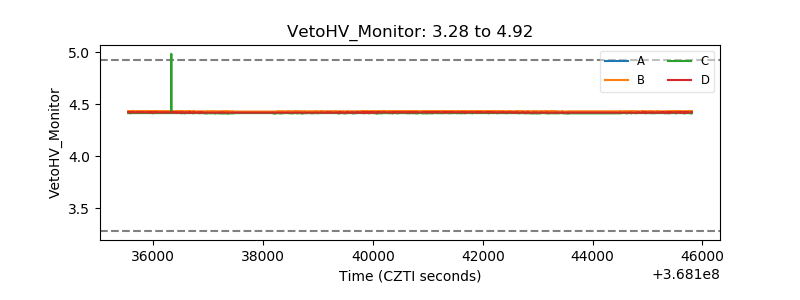 |
| Veto LLD | 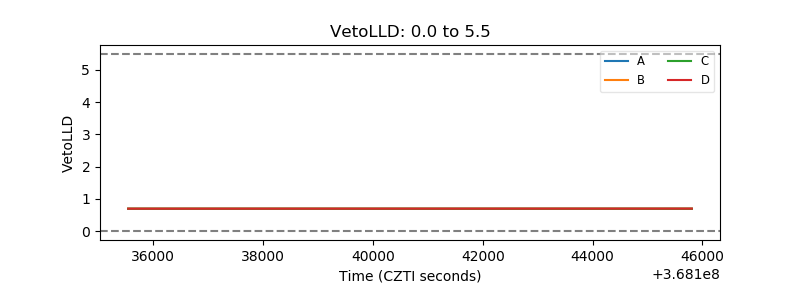 |
| Alpha Counter |  |
| _CPM_Rate | 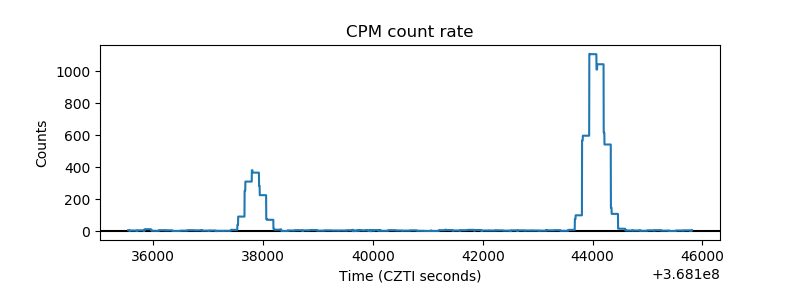 |
| CZT Counter | 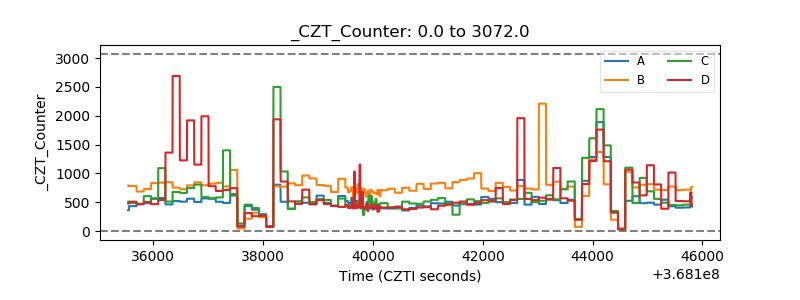 |
| +2.5 Volts monitor |  |
| +5 Volts monitor | 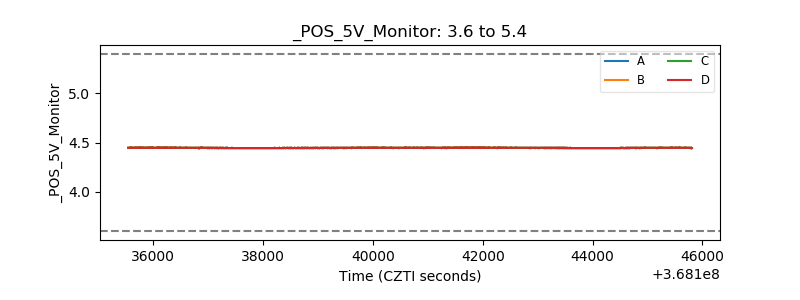 |
| _ROLL_ROT | 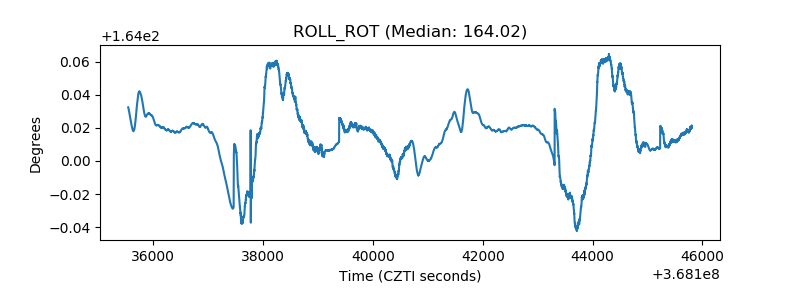 |
| _Roll_DEC | 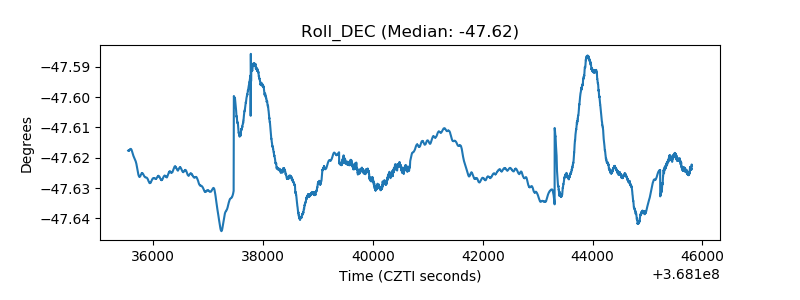 |
| _Roll_RA | 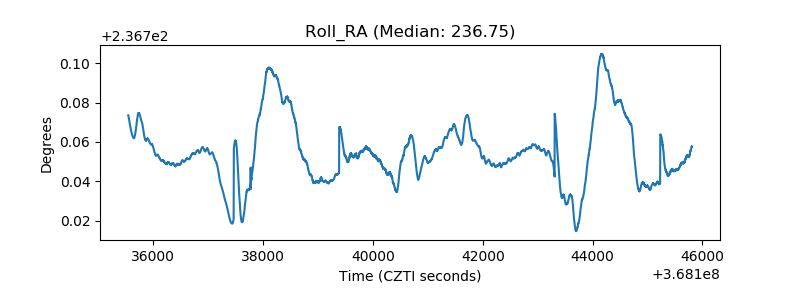 |
| Veto Counter | 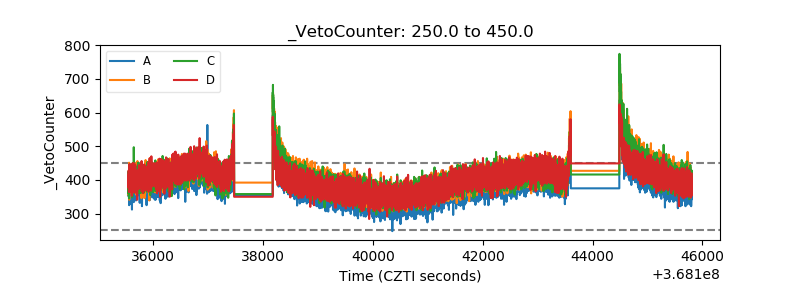 |