| Param | Original file | Final file |
|---|---|---|
| Filename | modeM0/AS1T04_046T01_9000004680_32043cztM0_level2.evt | modeM0/AS1T04_046T01_9000004680_32043cztM0_level2_quad_clean.evt |
| Size (bytes) | 548,614,080 | 86,460,480 |
| Size | 523.2 MB | 82.5 MB |
| Events in quadrant A | 3,192,360 | 552,813 |
| Events in quadrant B | 5,301,729 | 547,356 |
| Events in quadrant C | 3,862,325 | 528,632 |
| Events in quadrant D | 3,809,255 | 526,879 |
| Mode M0 | |||
|---|---|---|---|
| Quadrant | BADHDUFLAG | Total packets | Discarded packets |
| A | 0 | 13618 | 2 |
| B | 0 | 20601 | 2 |
| C | 0 | 15591 | 2 |
| D | 0 | 15629 | 2 |
| Mode M9 | |||
|---|---|---|---|
| Quadrant | BADHDUFLAG | Total packets | Discarded packets |
| A | 0 | 15 | 0 |
| B | 0 | 16 | 0 |
| C | 0 | 16 | 0 |
| D | 0 | 16 | 0 |
| Mode SS | |||
|---|---|---|---|
| Quadrant | BADHDUFLAG | Total packets | Discarded packets |
| A | 0 | 134 | 0 |
| B | 0 | 134 | 0 |
| C | 0 | 134 | 0 |
| D | 0 | 134 | 0 |
| Quadrant | Total seconds | Saturated seconds | Saturation percentage |
|---|---|---|---|
| A | 6634 | 19 | 0.286403% |
| B | 6634 | 122 | 1.839011% |
| C | 6634 | 169 | 2.547483% |
| D | 6634 | 33 | 0.497437% |
Noise dominated data is calculated using 1-second bins in cleaned event files. If a bin has >2000 counts, and if more than 50% of those come from <1% of pixels, then it is considered to be noise-dominated and hence unusable.
| Quadrant | # 1 sec bins | Bins with >0 counts | Bins with >2000 counts | High rate bins dominated by noise | Noise dominated (total time) | Noise dominated (detector-on time) | Marked lightcurve |
|---|---|---|---|---|---|---|---|
| A | 7679 | 6634 | 0 | 0 | 0.00% | 0.00% | 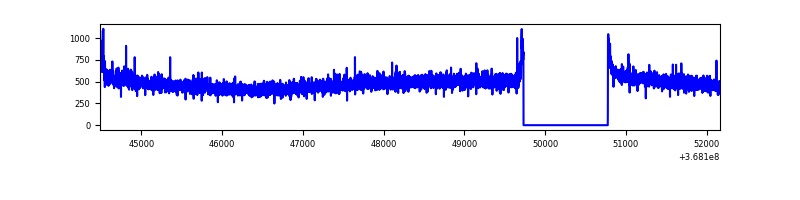 |
| B | 7679 | 6635 | 46 | 46 | 0.60% | 0.69% | 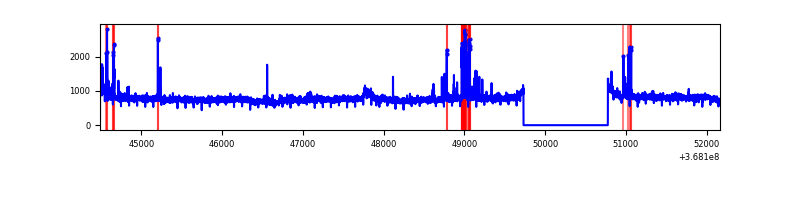 |
| C | 7679 | 6634 | 50 | 50 | 0.65% | 0.75% | 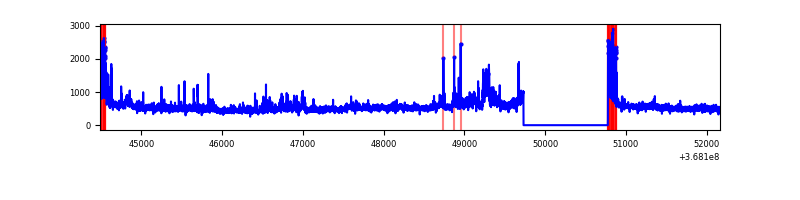 |
| D | 7679 | 6635 | 18 | 18 | 0.23% | 0.27% | 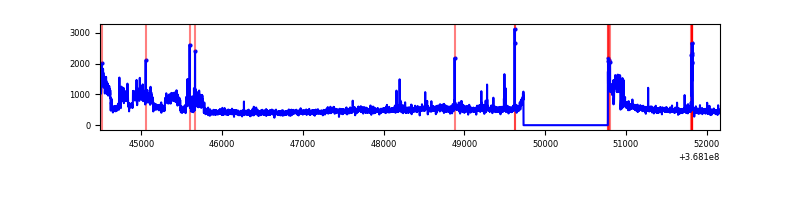 |
Top three noisy pixels from each quadrant. If the there are fewer than three noisy pixels in the level2.evt file, extra rows are filled as -1
| Pixel properties | Quadrant properties | ||||||
|---|---|---|---|---|---|---|---|
| Quadrant | DetID | PixID | Counts | Sigma | Mean | Median | Sigma |
| A | 14 | 238 | 14599 | 83.78 | 817 | 800 | 164.7 |
| A | 13 | 254 | 13045 | 74.34 | 817 | 800 | 164.7 |
| A | 13 | 6 | 12316 | 69.92 | 817 | 800 | 164.7 |
| B | 6 | 159 | 1870461 | 12156.51 | 808 | 788 | 153.8 |
| B | 5 | 172 | 158262 | 1023.89 | 808 | 788 | 153.8 |
| B | 0 | 245 | 36159 | 229.98 | 808 | 788 | 153.8 |
| C | 3 | 233 | 405455 | 2209.19 | 775 | 779 | 183.2 |
| C | 0 | 10 | 237946 | 1294.73 | 775 | 779 | 183.2 |
| C | 14 | 238 | 131352 | 712.82 | 775 | 779 | 183.2 |
| D | 8 | 195 | 698850 | 3738.03 | 784 | 764 | 186.8 |
| D | 2 | 250 | 72408 | 383.63 | 784 | 764 | 186.8 |
| D | 2 | 234 | 33147 | 173.4 | 784 | 764 | 186.8 |
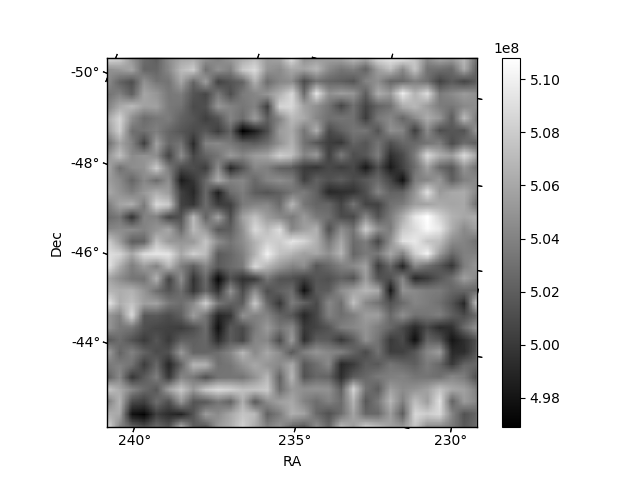
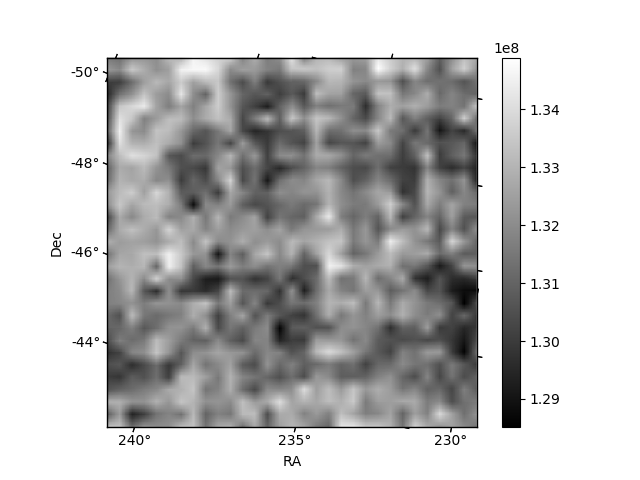
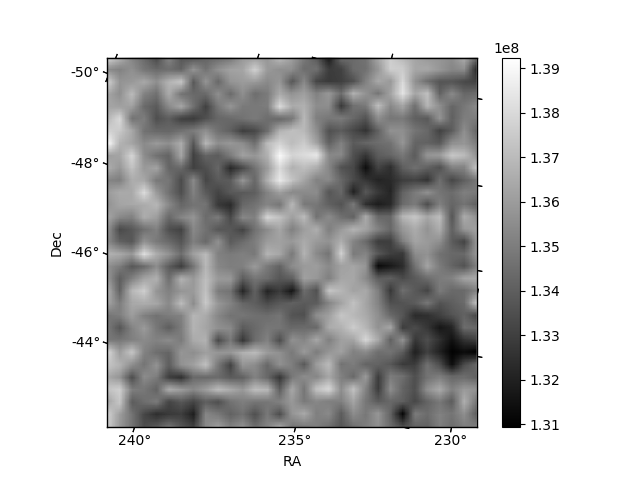
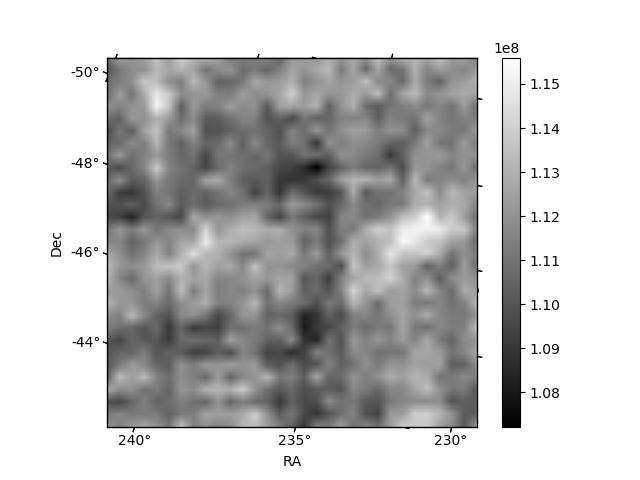
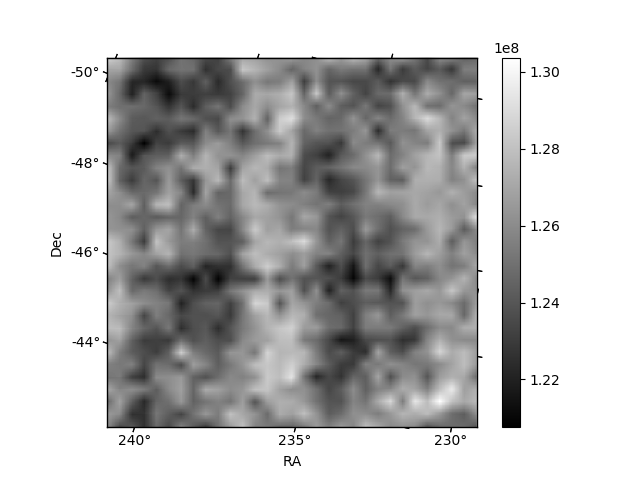
Histogram calculated using DETX and DETY for each event in the final _common_clean file
| Quadrant A | 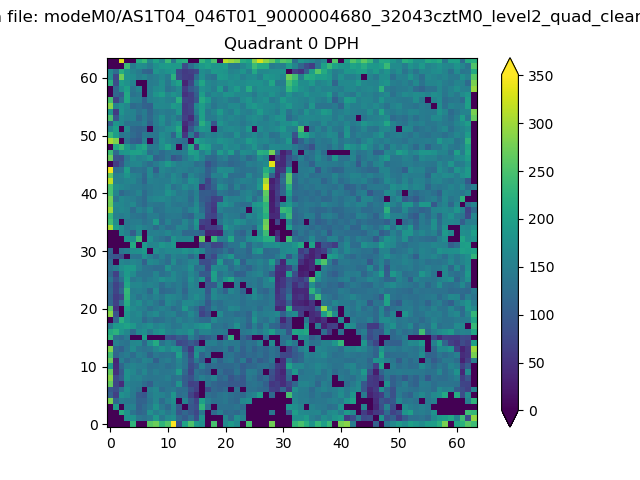 |
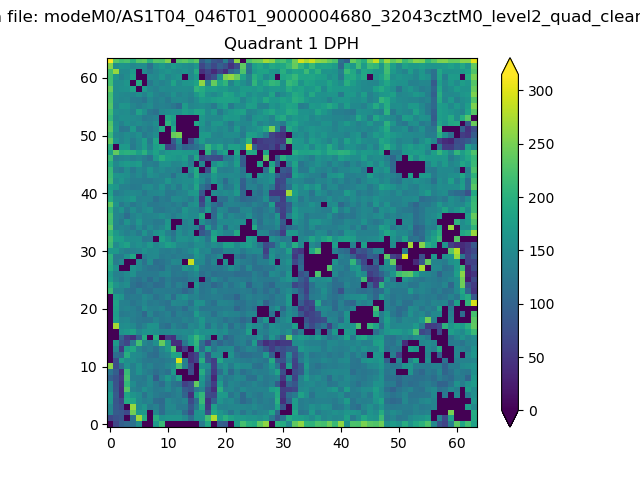 |
Quadrant B |
|---|---|---|---|
| Quadrant D | 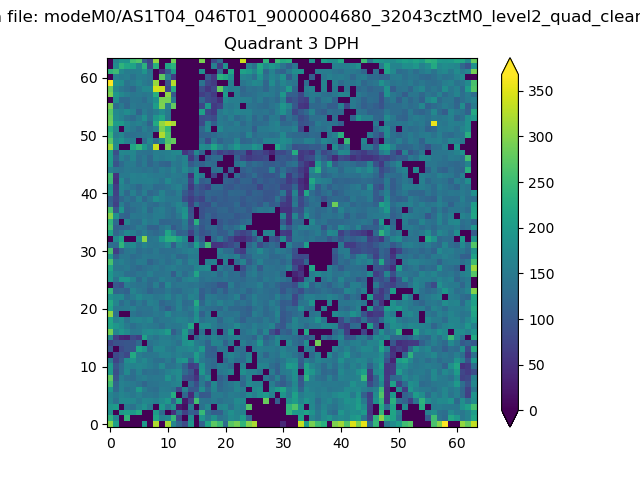 |
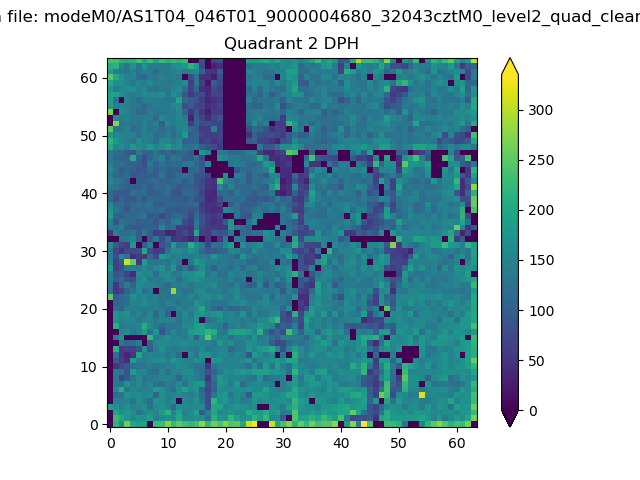 |
Quadrant C |
| Plot type | Count rate plots | Images |
|---|---|---|
| Comparison with Poisson distribution Blue bars denote a histogram of data divided into 1 sec bins. Red curve is a Poisson curve with rate = median count rate of data. |
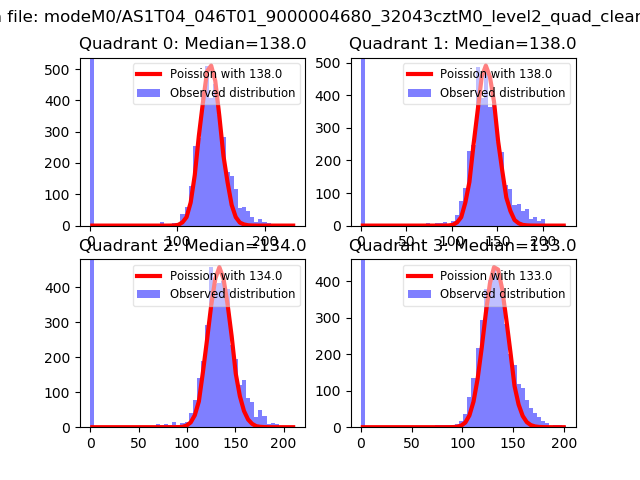 |
 |
| Quadrant-wise count rates Data is divided into 100 sec bins |
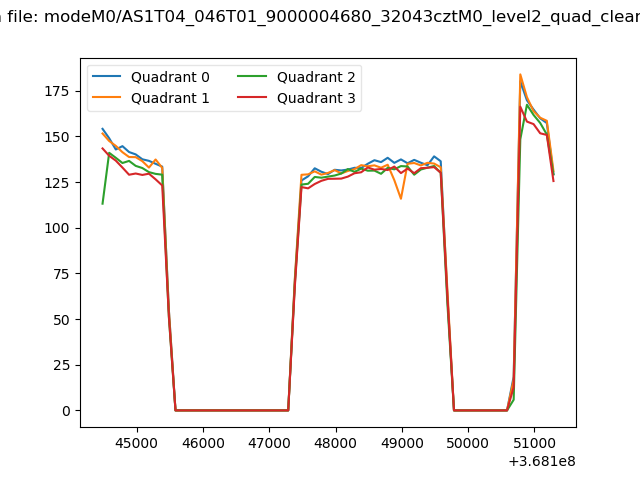 |
|
| Module-wise count rates for Quadrant A Data is divided into 100 sec bins |
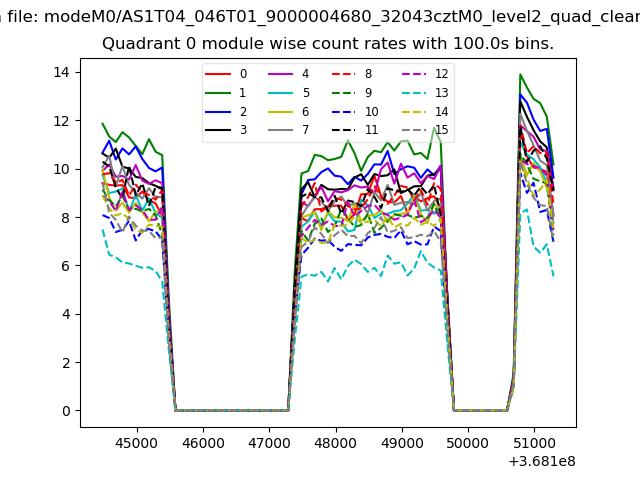 |
 |
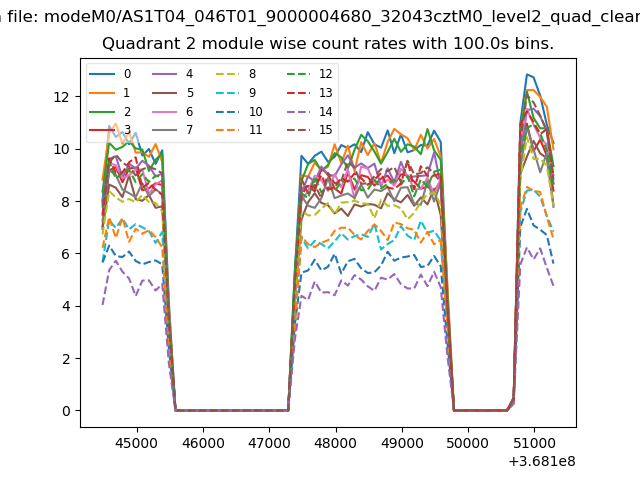
| Module-wise count rates for Quadrant B Data is divided into 100 sec bins |
 |
 |
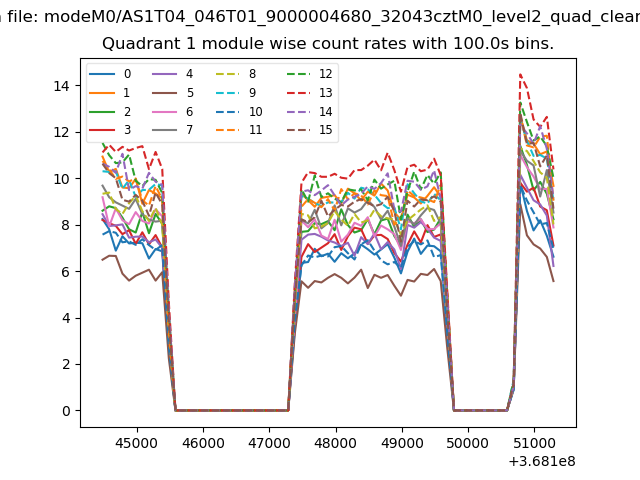
| Module-wise count rates for Quadrant C Data is divided into 100 sec bins |
 |
 |
| Module-wise count rates for Quadrant D Data is divided into 100 sec bins |
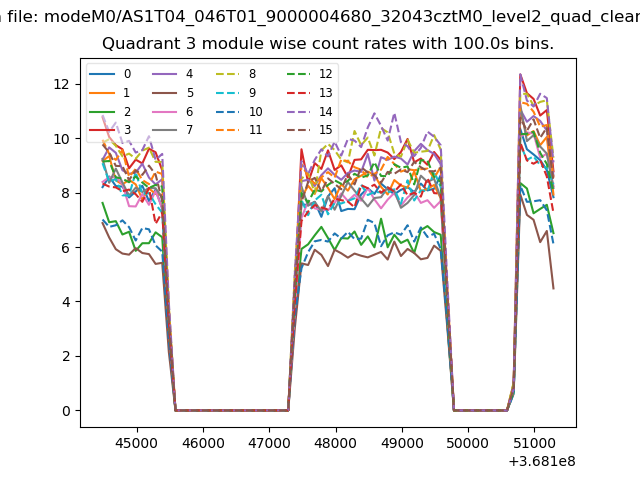 |
 |
| Parameter | Plot |
|---|---|
| CZT HV Monitor | 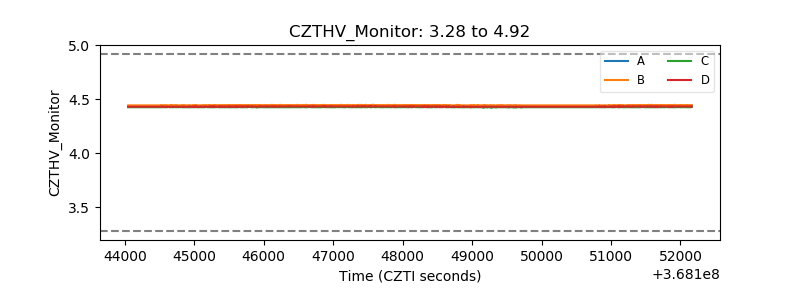 |
| D_VDD | 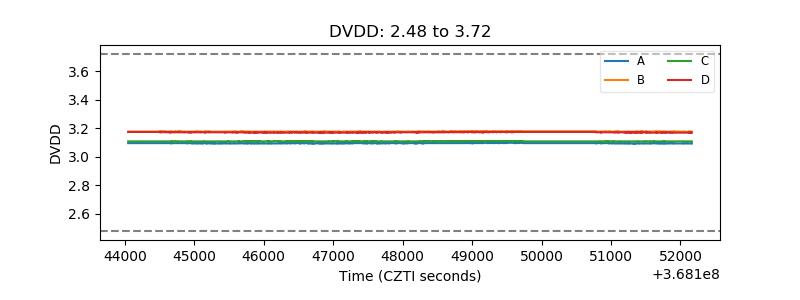 |
| Temperature 1 | 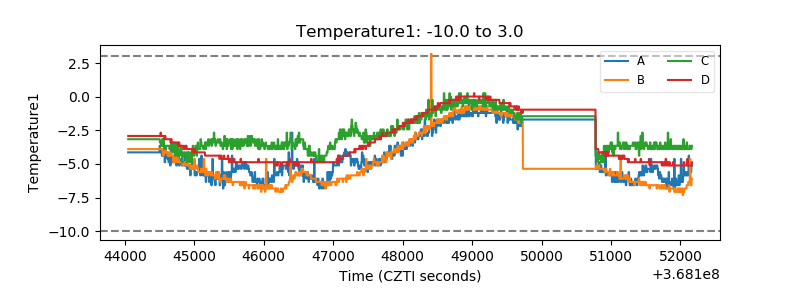 |
| Veto HV Monitor | 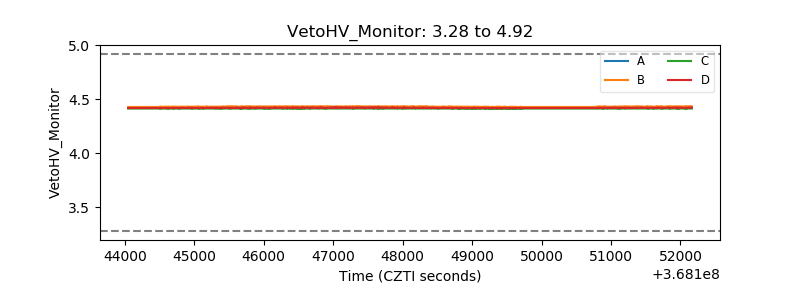 |
| Veto LLD | 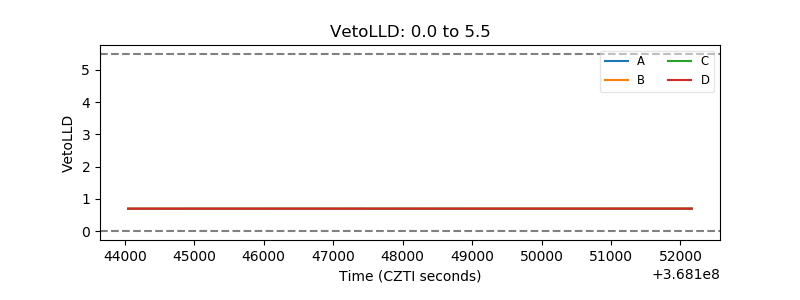 |
| Alpha Counter | 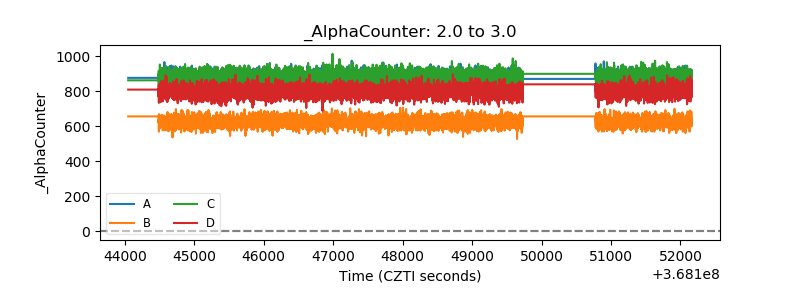 |
| _CPM_Rate | 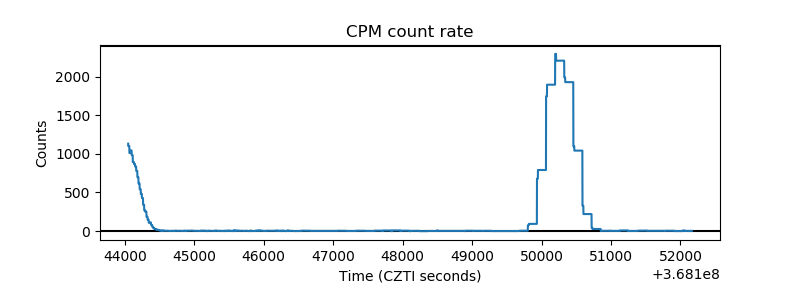 |
| CZT Counter | 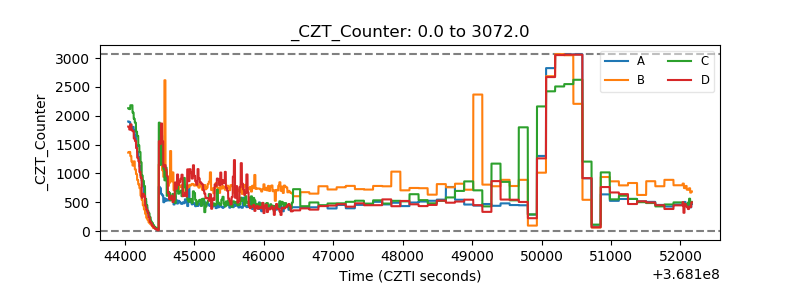 |
| +2.5 Volts monitor |  |
| +5 Volts monitor |  |
| _ROLL_ROT | 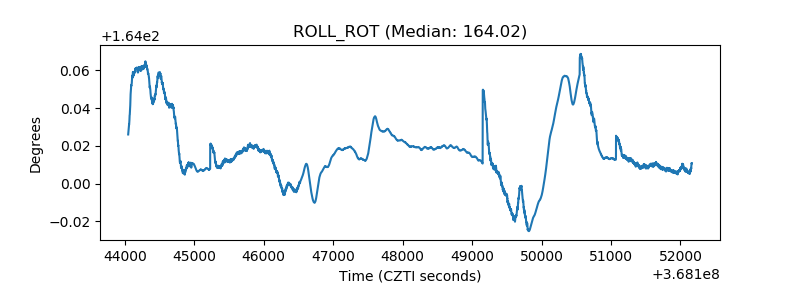 |
| _Roll_DEC | 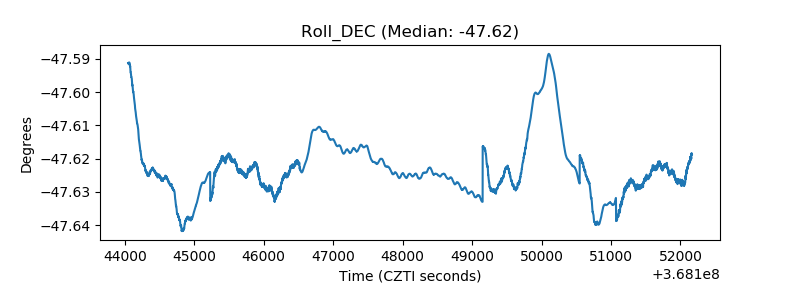 |
| _Roll_RA | 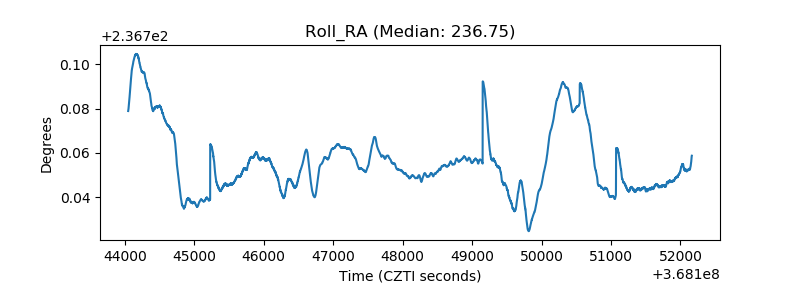 |
| Veto Counter | 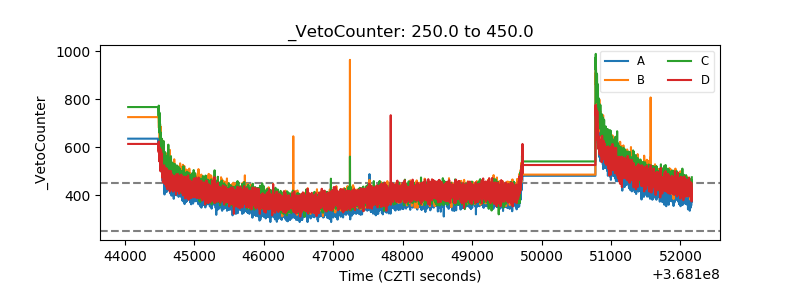 |