| Param | Original file | Final file |
|---|---|---|
| Filename | modeM0/AS1T04_046T01_9000004680_32048cztM0_level2.evt | modeM0/AS1T04_046T01_9000004680_32048cztM0_level2_quad_clean.evt |
| Size (bytes) | 374,146,560 | 49,302,720 |
| Size | 356.8 MB | 47.0 MB |
| Events in quadrant A | 2,346,963 | 308,353 |
| Events in quadrant B | 3,428,612 | 310,109 |
| Events in quadrant C | 2,580,980 | 298,626 |
| Events in quadrant D | 2,704,300 | 294,753 |
| Mode M0 | |||
|---|---|---|---|
| Quadrant | BADHDUFLAG | Total packets | Discarded packets |
| A | 0 | 9954 | 365 |
| B | 0 | 13188 | 611 |
| C | 0 | 11008 | 459 |
| D | 0 | 11141 | 488 |
| Mode M9 | |||
|---|---|---|---|
| Quadrant | BADHDUFLAG | Total packets | Discarded packets |
| A | 0 | 3 | 1 |
| B | 0 | 4 | 3 |
| C | 0 | 3 | 2 |
| D | 0 | 6 | 4 |
| Mode SS | |||
|---|---|---|---|
| Quadrant | BADHDUFLAG | Total packets | Discarded packets |
| A | 0 | 82 | 2 |
| B | 0 | 83 | 1 |
| C | 0 | 84 | 2 |
| D | 0 | 81 | 2 |
| Quadrant | Total seconds | Saturated seconds | Saturation percentage |
|---|---|---|---|
| A | 3990 | 29 | 0.726817% |
| B | 3971 | 80 | 2.014606% |
| C | 3973 | 207 | 5.210169% |
| D | 3965 | 18 | 0.453972% |
Noise dominated data is calculated using 1-second bins in cleaned event files. If a bin has >2000 counts, and if more than 50% of those come from <1% of pixels, then it is considered to be noise-dominated and hence unusable.
| Quadrant | # 1 sec bins | Bins with >0 counts | Bins with >2000 counts | High rate bins dominated by noise | Noise dominated (total time) | Noise dominated (detector-on time) | Marked lightcurve |
|---|---|---|---|---|---|---|---|
| A | 7549 | 4032 | 0 | 0 | 0.00% | 0.00% | 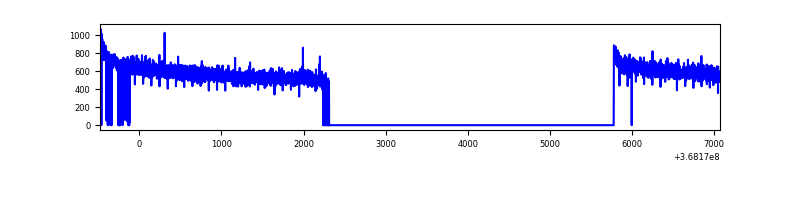 |
| B | 7549 | 4024 | 1 | 1 | 0.01% | 0.02% | 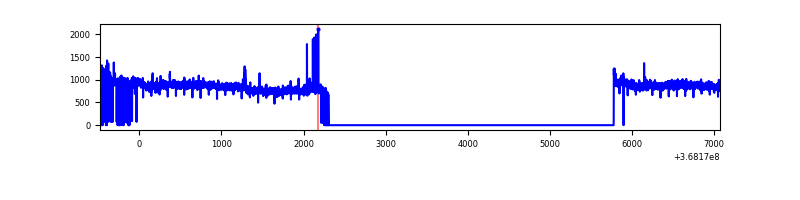 |
| C | 7547 | 4019 | 14 | 14 | 0.19% | 0.35% | 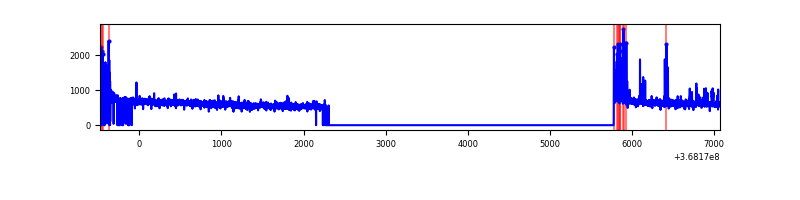 |
| D | 7549 | 4018 | 2 | 2 | 0.03% | 0.05% | 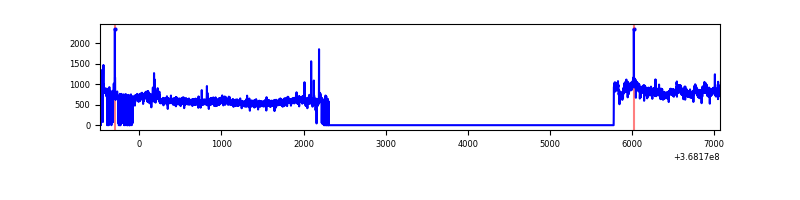 |
Top three noisy pixels from each quadrant. If the there are fewer than three noisy pixels in the level2.evt file, extra rows are filled as -1
| Pixel properties | Quadrant properties | ||||||
|---|---|---|---|---|---|---|---|
| Quadrant | DetID | PixID | Counts | Sigma | Mean | Median | Sigma |
| A | 13 | 6 | 8714 | 68.88 | 605 | 597 | 117.8 |
| A | 13 | 254 | 7379 | 57.55 | 605 | 597 | 117.8 |
| A | 0 | 226 | 5146 | 38.6 | 605 | 597 | 117.8 |
| B | 6 | 159 | 1058981 | 9924.0 | 589 | 577 | 106.7 |
| B | 0 | 190 | 24526 | 224.55 | 589 | 577 | 106.7 |
| B | 10 | 245 | 15325 | 138.28 | 589 | 577 | 106.7 |
| C | 0 | 10 | 134654 | 1028.94 | 577 | 585 | 130.3 |
| C | 14 | 238 | 115854 | 884.66 | 577 | 585 | 130.3 |
| C | 14 | 254 | 26184 | 196.47 | 577 | 585 | 130.3 |
| D | 8 | 195 | 461774 | 3371.22 | 590 | 578 | 136.8 |
| D | 2 | 234 | 16428 | 115.86 | 590 | 578 | 136.8 |
| D | 2 | 120 | 7162 | 48.13 | 590 | 578 | 136.8 |
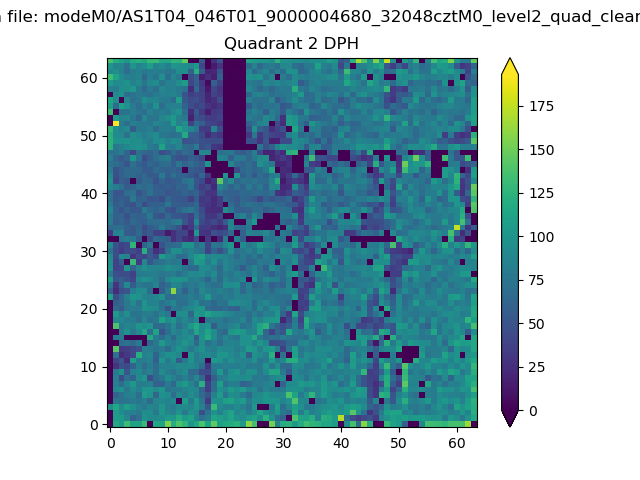
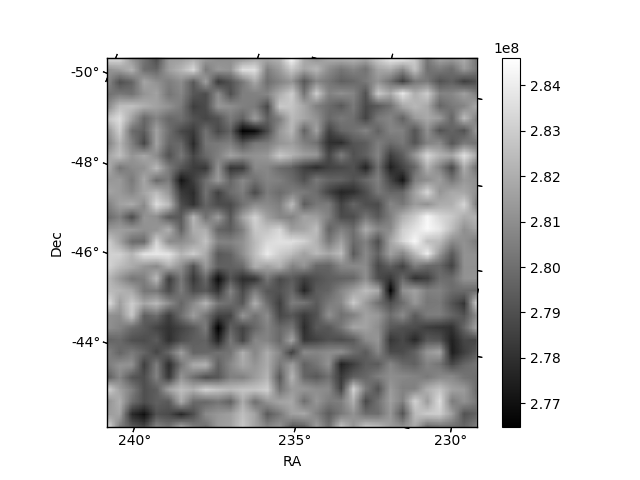
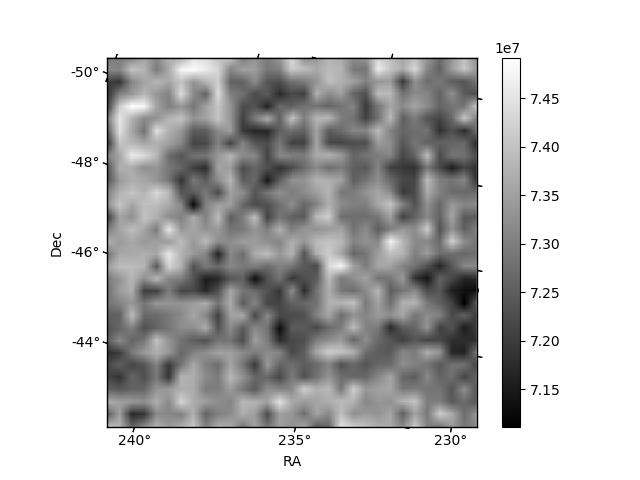
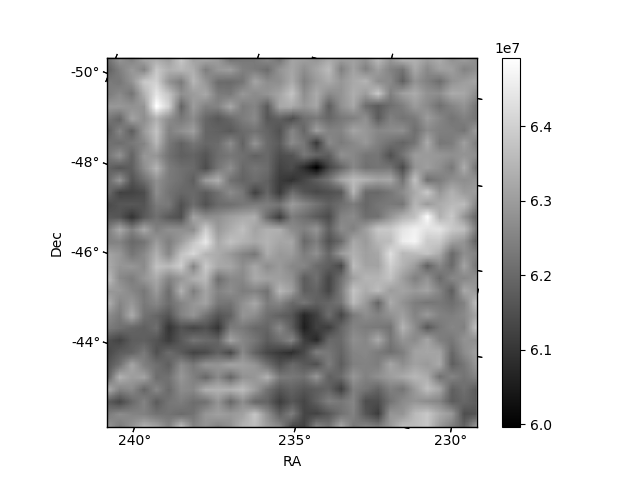
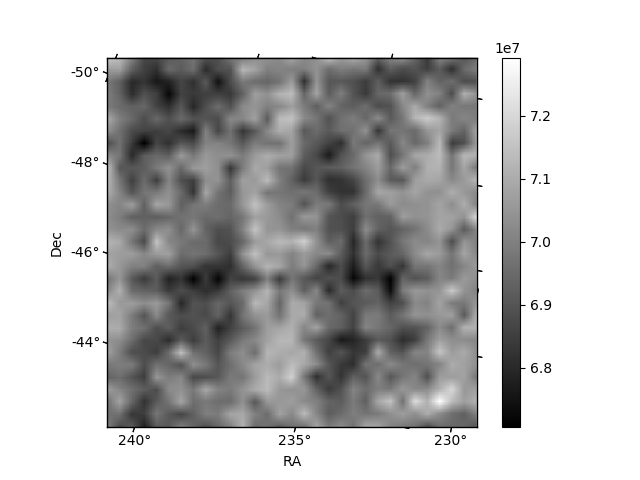
Histogram calculated using DETX and DETY for each event in the final _common_clean file
| Quadrant A | 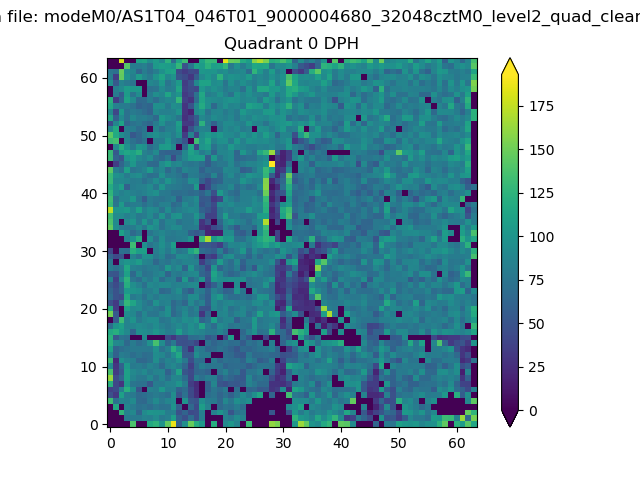 |
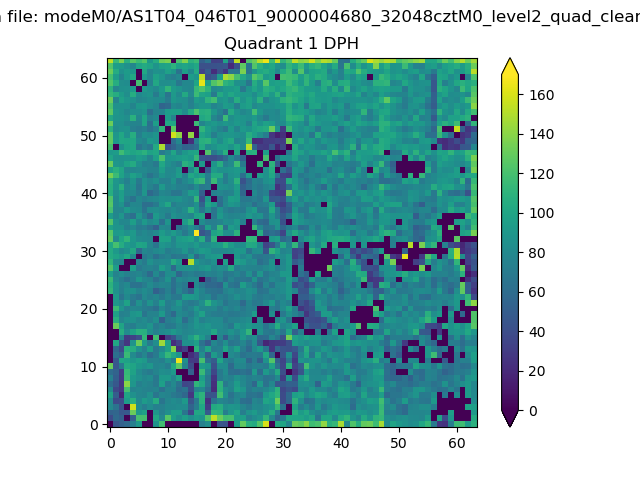 |
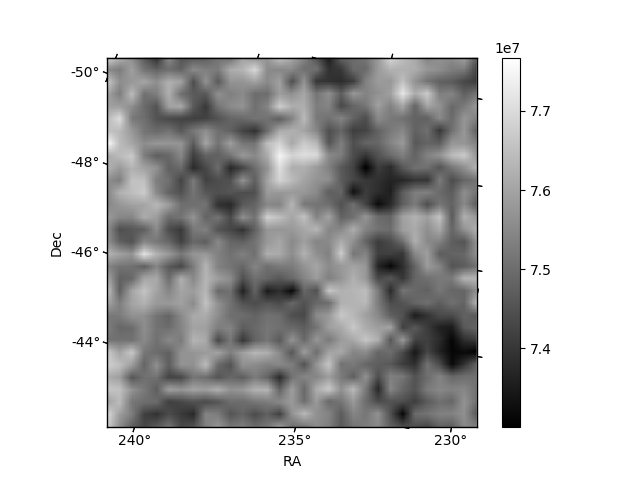
Quadrant B |
|---|---|---|---|
| Quadrant D | 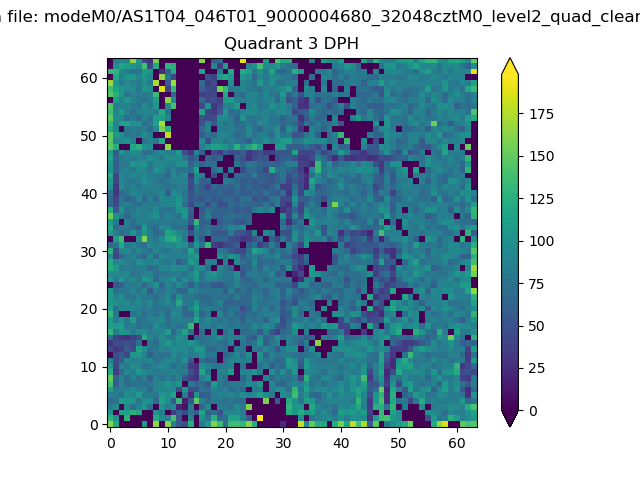 |
 |
Quadrant C |
| Plot type | Count rate plots | Images |
|---|---|---|
| Comparison with Poisson distribution Blue bars denote a histogram of data divided into 1 sec bins. Red curve is a Poisson curve with rate = median count rate of data. |
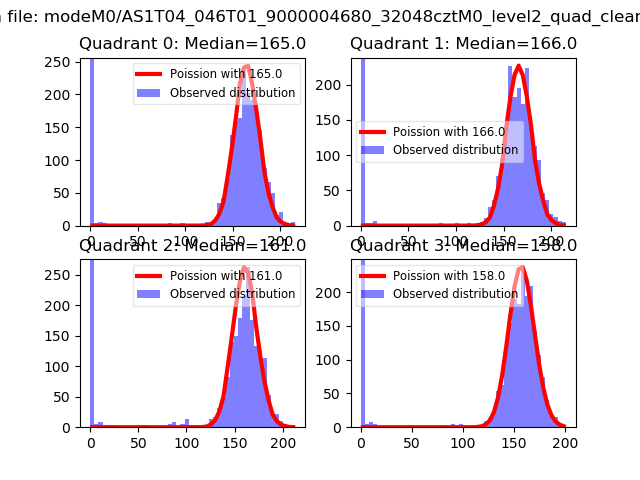 |
 |
| Quadrant-wise count rates Data is divided into 100 sec bins |
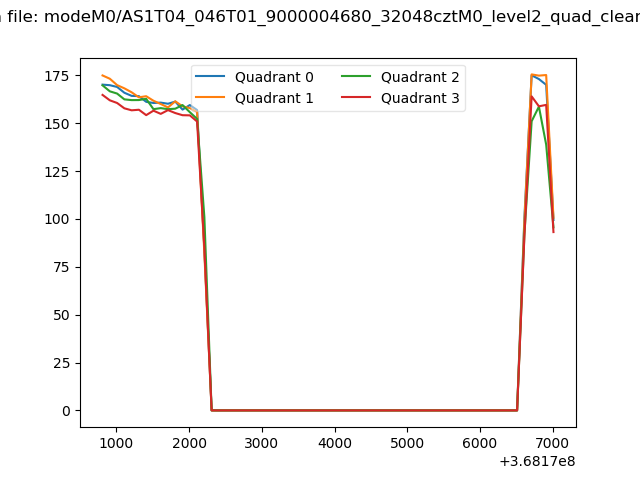 |
|
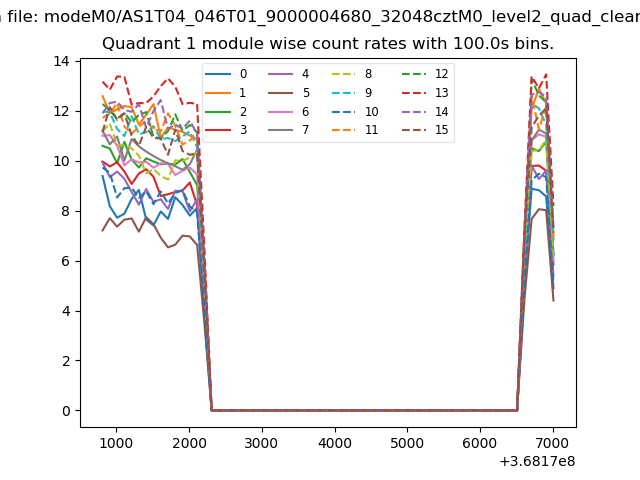
| Module-wise count rates for Quadrant A Data is divided into 100 sec bins |
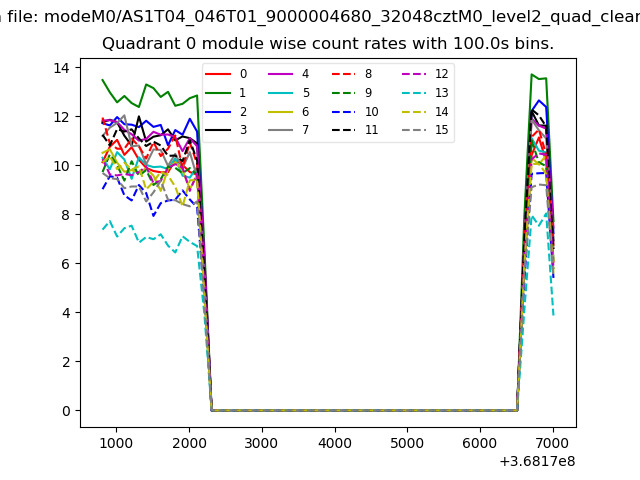 |
 |
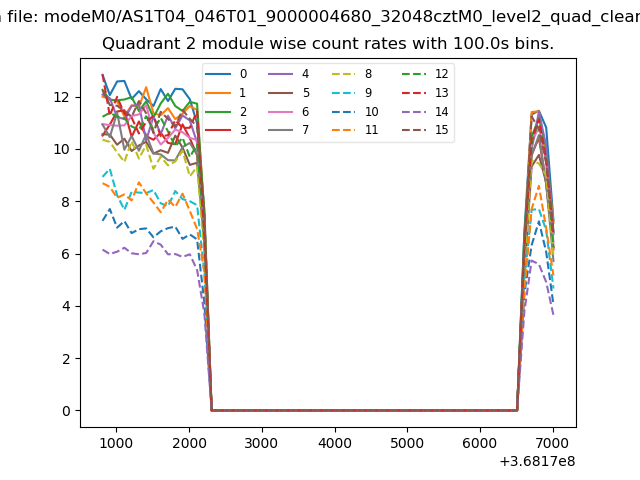
| Module-wise count rates for Quadrant B Data is divided into 100 sec bins |
 |
 |
| Module-wise count rates for Quadrant C Data is divided into 100 sec bins |
 |
 |
| Module-wise count rates for Quadrant D Data is divided into 100 sec bins |
 |
 |
| Parameter | Plot |
|---|---|
| CZT HV Monitor | 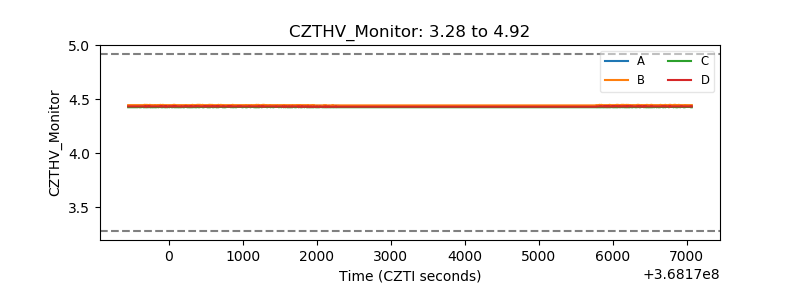 |
| D_VDD |  |
| Temperature 1 | 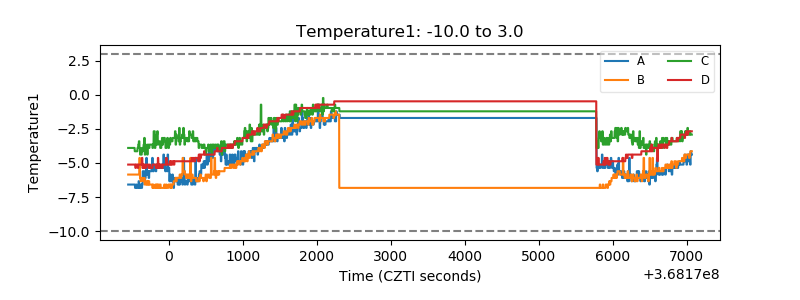 |
| Veto HV Monitor | 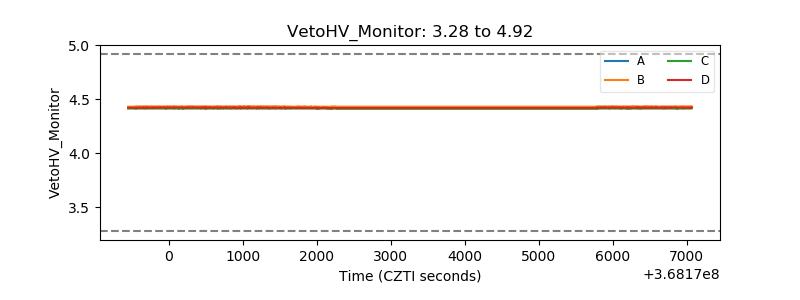 |
| Veto LLD |  |
| Alpha Counter | 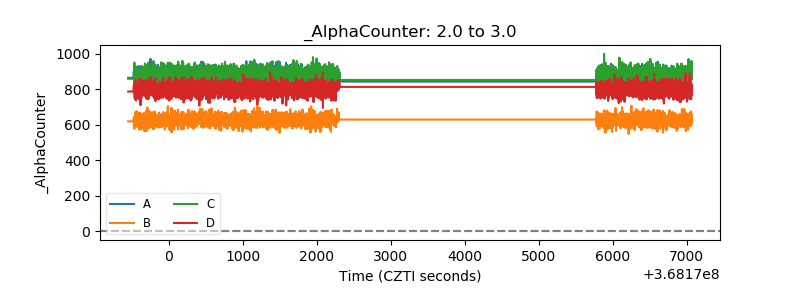 |
| _CPM_Rate | 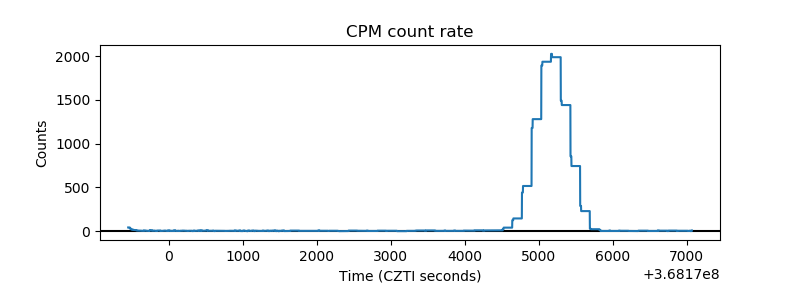 |
| CZT Counter | 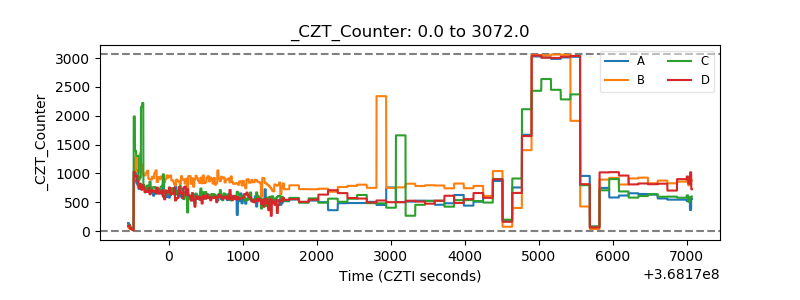 |
| +2.5 Volts monitor |  |
| +5 Volts monitor |  |
| _ROLL_ROT | 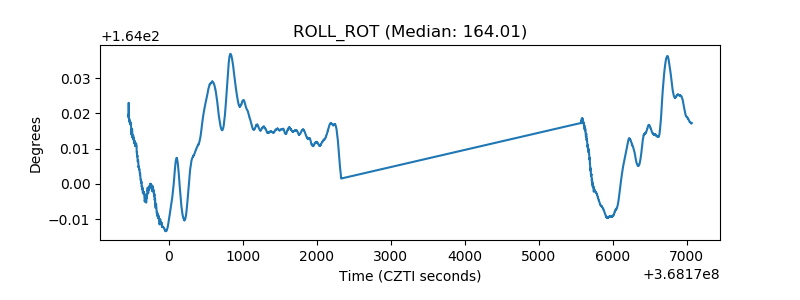 |
| _Roll_DEC | 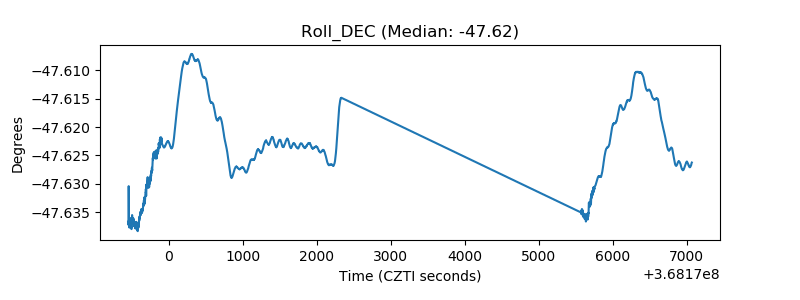 |
| _Roll_RA | 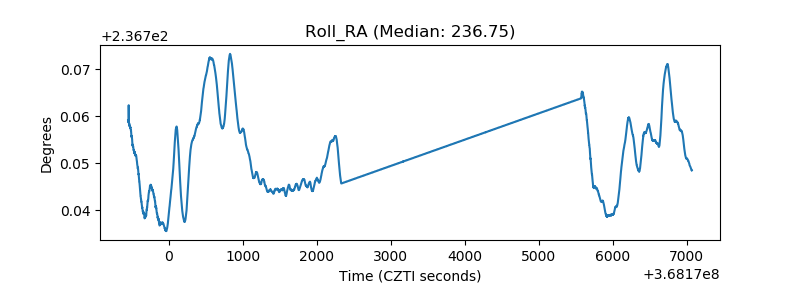 |
| Veto Counter |  |