| Param | Original file | Final file |
|---|---|---|
| Filename | modeM0/AS1T04_046T01_9000004680_32049cztM0_level2.evt | modeM0/AS1T04_046T01_9000004680_32049cztM0_level2_quad_clean.evt |
| Size (bytes) | 913,936,320 | 168,526,080 |
| Size | 871.6 MB | 160.7 MB |
| Events in quadrant A | 4,897,361 | 1,171,465 |
| Events in quadrant B | 7,809,346 | 1,136,544 |
| Events in quadrant C | 5,382,134 | 1,131,321 |
| Events in quadrant D | 8,979,779 | 1,037,030 |
| Mode M0 | |||
|---|---|---|---|
| Quadrant | BADHDUFLAG | Total packets | Discarded packets |
| A | 0 | 20489 | 698 |
| B | 0 | 30267 | 1135 |
| C | 0 | 22188 | 720 |
| D | 0 | 33597 | 953 |
| Mode M9 | |||
|---|---|---|---|
| Quadrant | BADHDUFLAG | Total packets | Discarded packets |
| A | 0 | 28 | 2 |
| B | 0 | 27 | 0 |
| C | 0 | 28 | 1 |
| D | 0 | 28 | 1 |
| Mode SS | |||
|---|---|---|---|
| Quadrant | BADHDUFLAG | Total packets | Discarded packets |
| A | 0 | 190 | 6 |
| B | 0 | 190 | 8 |
| C | 0 | 190 | 8 |
| D | 0 | 190 | 8 |
| Quadrant | Total seconds | Saturated seconds | Saturation percentage |
|---|---|---|---|
| A | 9067 | 166 | 1.830815% |
| B | 9033 | 486 | 5.380272% |
| C | 9076 | 561 | 6.181137% |
| D | 9050 | 1385 | 15.303867% |
Noise dominated data is calculated using 1-second bins in cleaned event files. If a bin has >2000 counts, and if more than 50% of those come from <1% of pixels, then it is considered to be noise-dominated and hence unusable.
| Quadrant | # 1 sec bins | Bins with >0 counts | Bins with >2000 counts | High rate bins dominated by noise | Noise dominated (total time) | Noise dominated (detector-on time) | Marked lightcurve |
|---|---|---|---|---|---|---|---|
| A | 12045 | 9136 | 0 | 0 | 0.00% | 0.00% | 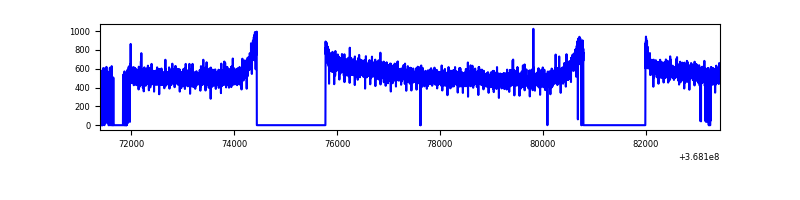 |
| B | 12010 | 9103 | 171 | 171 | 1.42% | 1.88% |  |
| C | 12039 | 9162 | 47 | 47 | 0.39% | 0.51% | 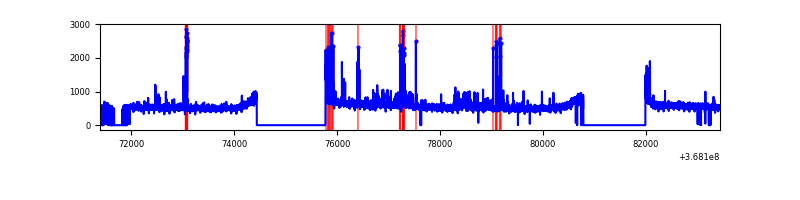 |
| D | 12041 | 9129 | 1241 | 1241 | 10.31% | 13.59% | 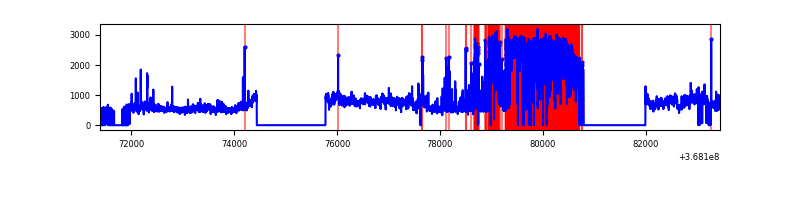 |
Top three noisy pixels from each quadrant. If the there are fewer than three noisy pixels in the level2.evt file, extra rows are filled as -1
| Pixel properties | Quadrant properties | ||||||
|---|---|---|---|---|---|---|---|
| Quadrant | DetID | PixID | Counts | Sigma | Mean | Median | Sigma |
| A | 13 | 254 | 17392 | 65.5 | 1262 | 1242 | 246.6 |
| A | 13 | 6 | 13433 | 49.44 | 1262 | 1242 | 246.6 |
| A | 3 | 137 | 11335 | 40.93 | 1262 | 1242 | 246.6 |
| B | 6 | 159 | 2367100 | 10551.26 | 1213 | 1186 | 224.2 |
| B | 5 | 172 | 553659 | 2463.86 | 1213 | 1186 | 224.2 |
| B | 10 | 245 | 38244 | 165.27 | 1213 | 1186 | 224.2 |
| C | 14 | 238 | 257692 | 954.76 | 1190 | 1202 | 268.6 |
| C | 0 | 10 | 224628 | 831.68 | 1190 | 1202 | 268.6 |
| C | 14 | 254 | 86870 | 318.89 | 1190 | 1202 | 268.6 |
| D | 12 | 227 | 3402768 | 12521.13 | 1164 | 1135 | 271.7 |
| D | 8 | 195 | 1093533 | 4021.03 | 1164 | 1135 | 271.7 |
| D | 2 | 234 | 45004 | 161.48 | 1164 | 1135 | 271.7 |
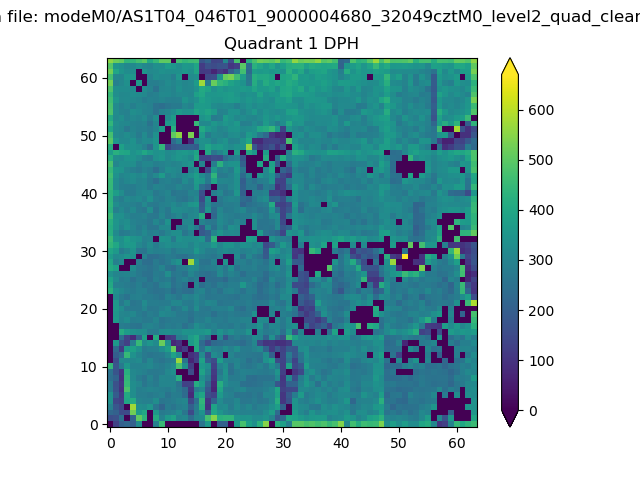
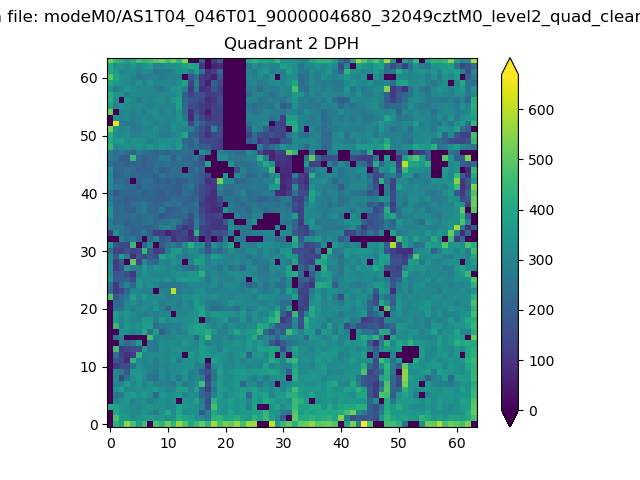
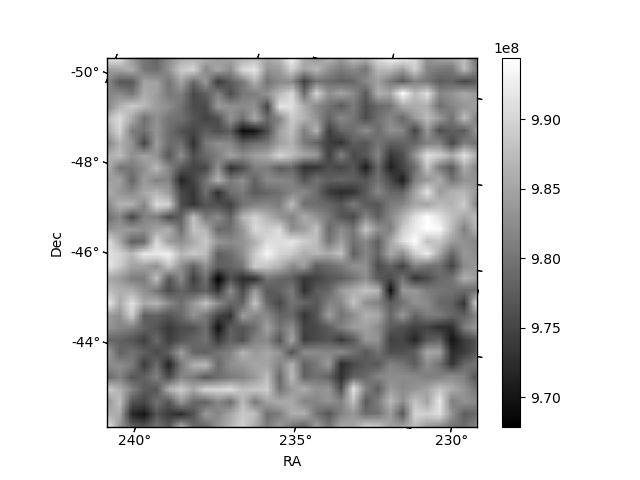
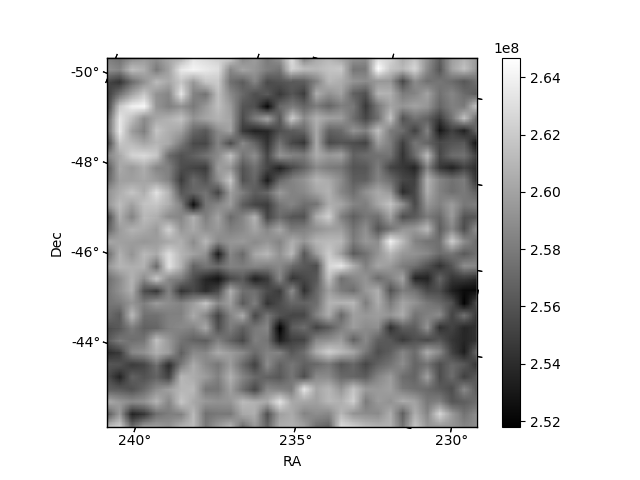
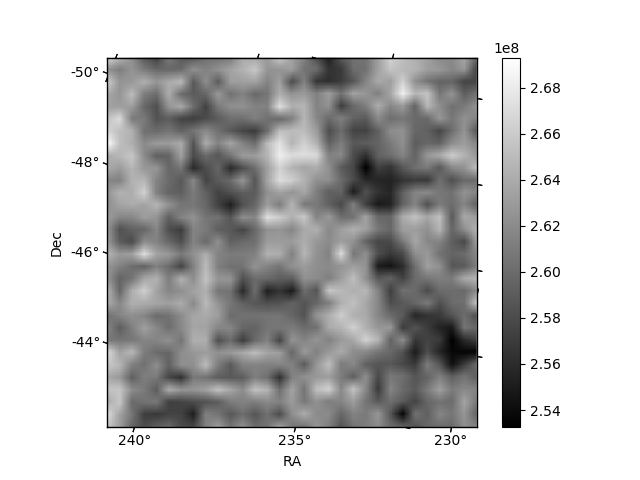
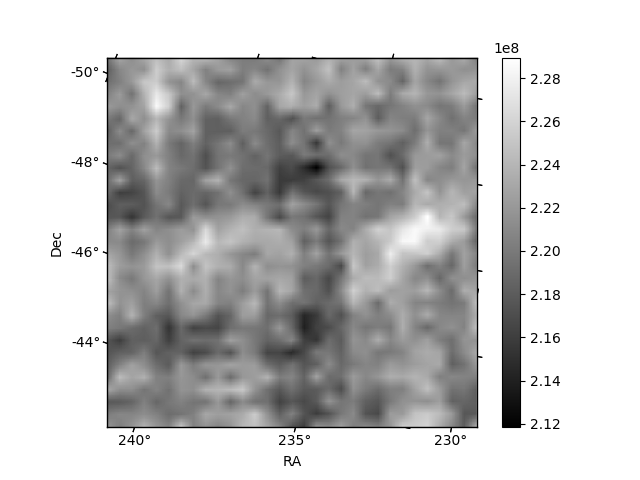
Histogram calculated using DETX and DETY for each event in the final _common_clean file
| Quadrant A | 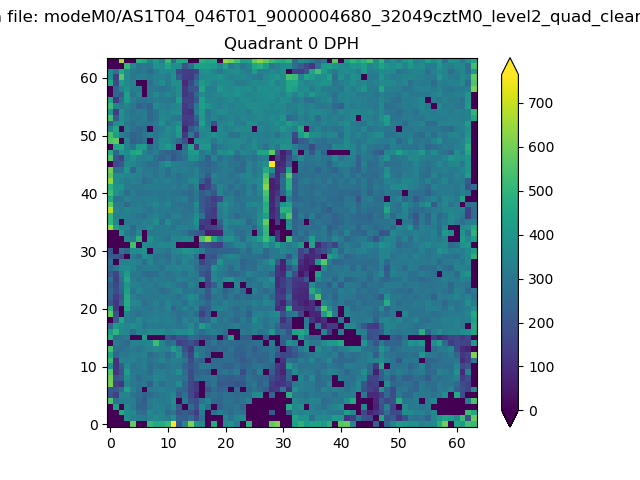 |
 |
Quadrant B |
|---|---|---|---|
| Quadrant D | 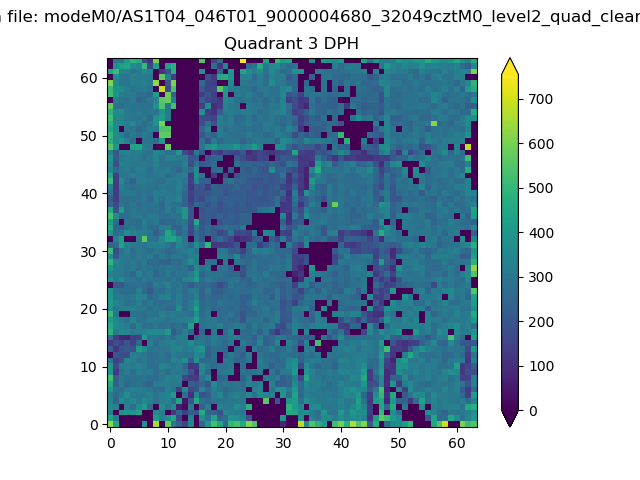 |
 |
Quadrant C |
| Plot type | Count rate plots | Images |
|---|---|---|
| Comparison with Poisson distribution Blue bars denote a histogram of data divided into 1 sec bins. Red curve is a Poisson curve with rate = median count rate of data. |
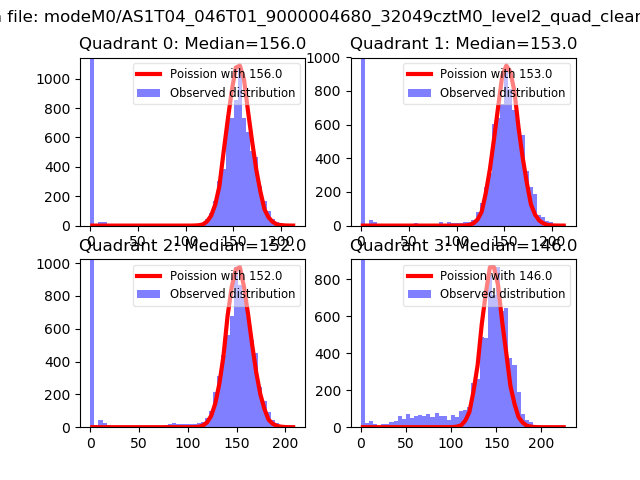 |
 |
| Quadrant-wise count rates Data is divided into 100 sec bins |
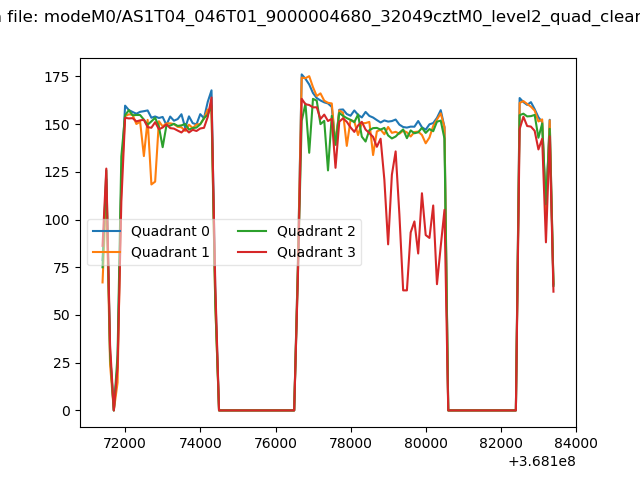 |
|
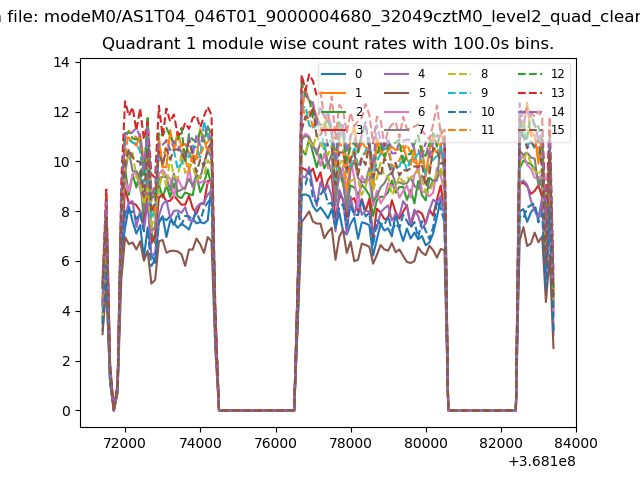
| Module-wise count rates for Quadrant A Data is divided into 100 sec bins |
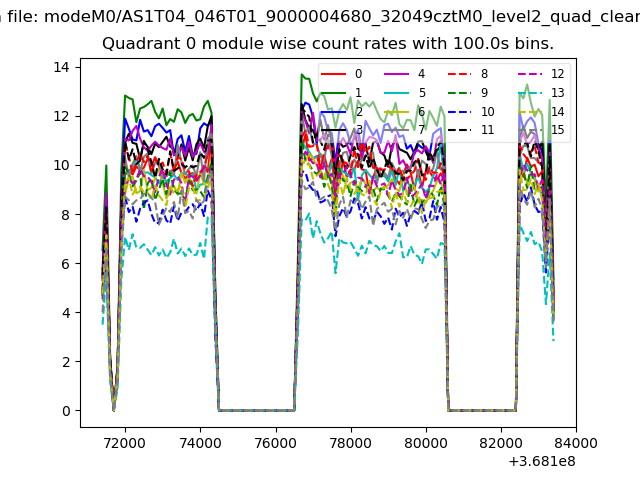 |
 |
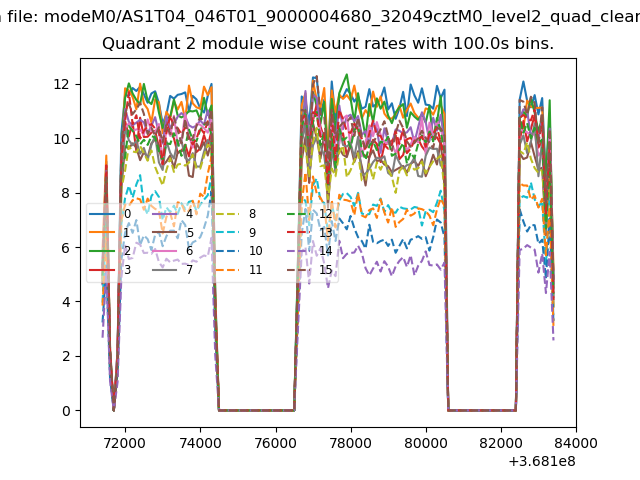
| Module-wise count rates for Quadrant B Data is divided into 100 sec bins |
 |
 |
| Module-wise count rates for Quadrant C Data is divided into 100 sec bins |
 |
 |
| Module-wise count rates for Quadrant D Data is divided into 100 sec bins |
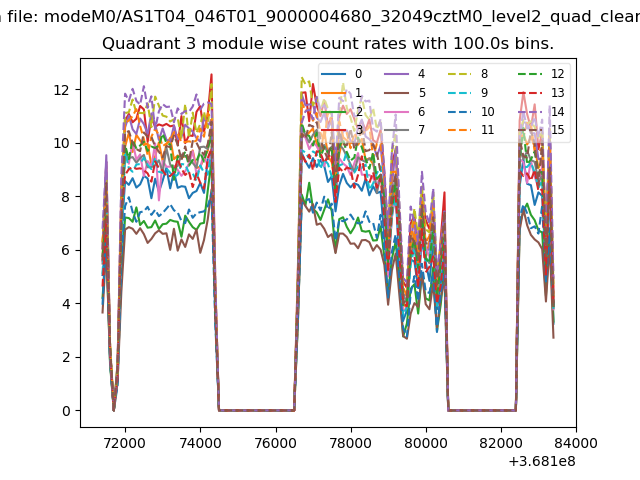 |
 |
| Parameter | Plot |
|---|---|
| CZT HV Monitor | 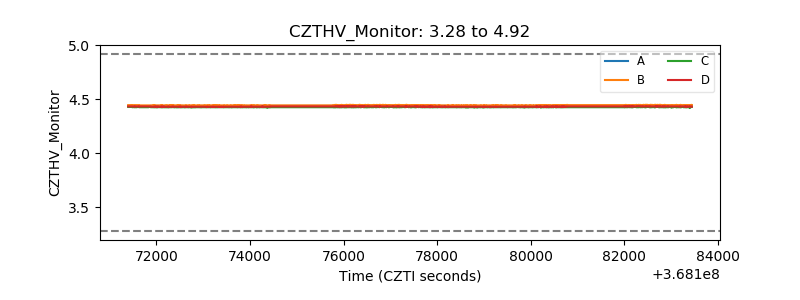 |
| D_VDD | 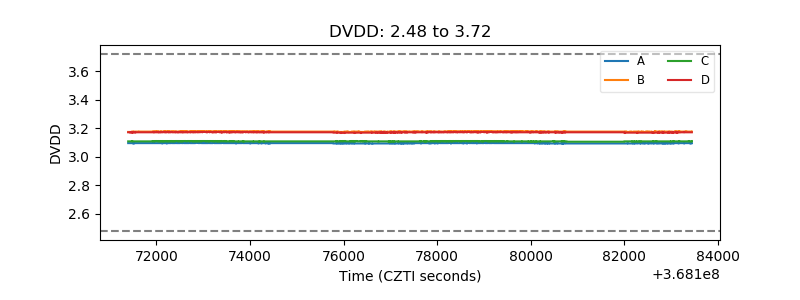 |
| Temperature 1 | 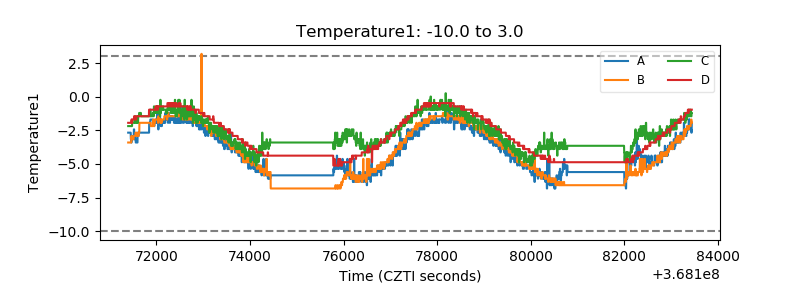 |
| Veto HV Monitor | 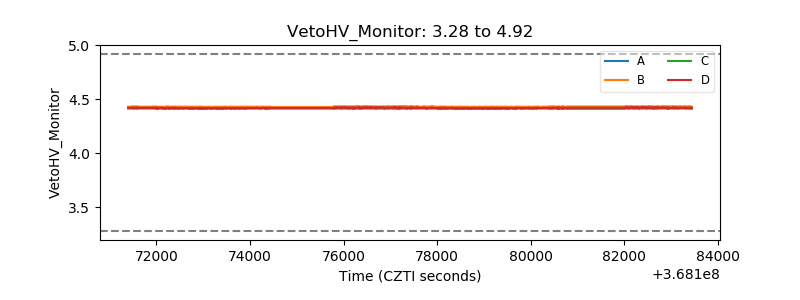 |
| Veto LLD | 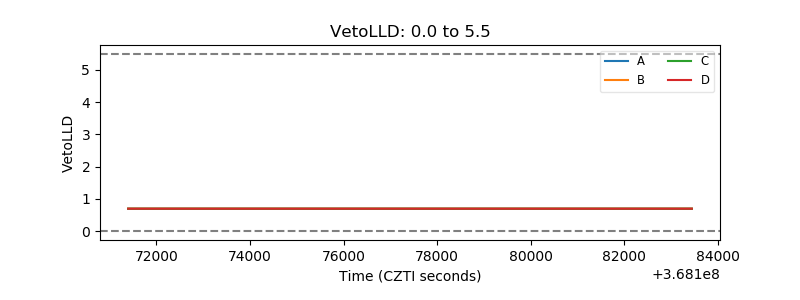 |
| Alpha Counter | 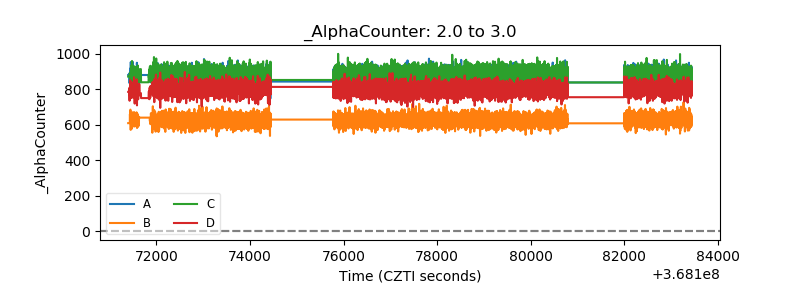 |
| _CPM_Rate | 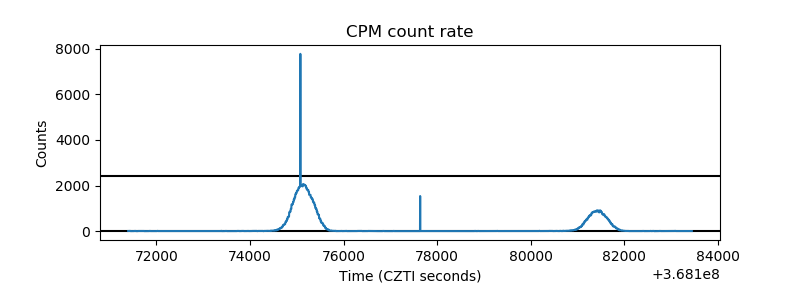 |
| CZT Counter | 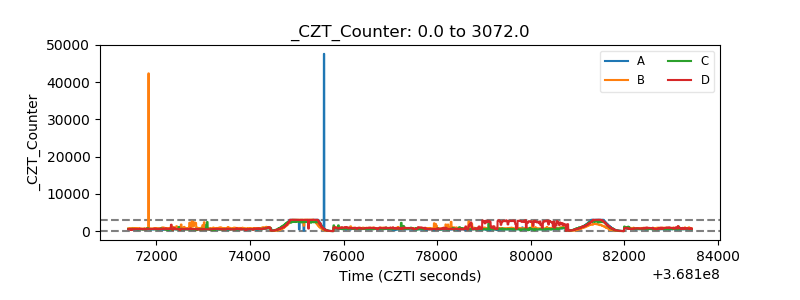 |
| +2.5 Volts monitor |  |
| +5 Volts monitor |  |
| _ROLL_ROT | 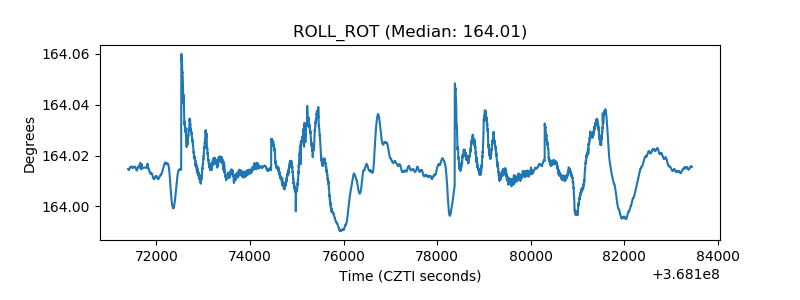 |
| _Roll_DEC | 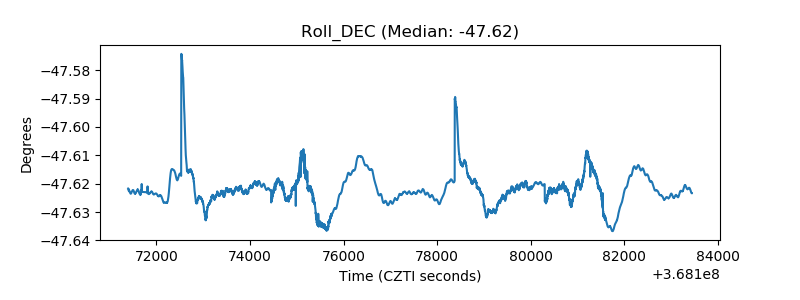 |
| _Roll_RA | 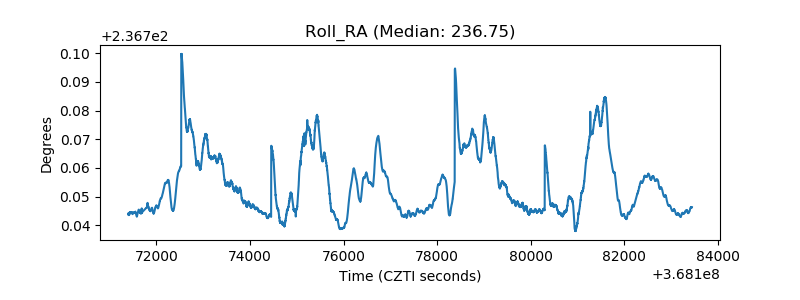 |
| Veto Counter | 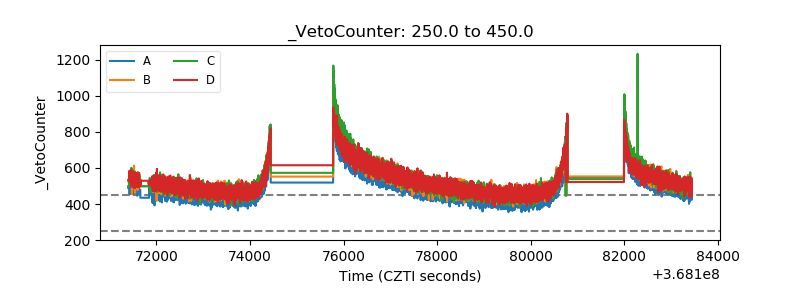 |