| Param | Original file | Final file |
|---|---|---|
| Filename | modeM0/AS1T04_046T01_9000004680_32050cztM0_level2.evt | modeM0/AS1T04_046T01_9000004680_32050cztM0_level2_quad_clean.evt |
| Size (bytes) | 521,694,720 | 109,195,200 |
| Size | 497.5 MB | 104.1 MB |
| Events in quadrant A | 3,052,001 | 741,522 |
| Events in quadrant B | 4,979,651 | 728,655 |
| Events in quadrant C | 3,283,849 | 719,734 |
| Events in quadrant D | 4,076,026 | 696,614 |
| Mode M0 | |||
|---|---|---|---|
| Quadrant | BADHDUFLAG | Total packets | Discarded packets |
| A | 0 | 12528 | 1 |
| B | 0 | 18954 | 1 |
| C | 0 | 13253 | 1 |
| D | 0 | 15921 | 1 |
| Mode M9 | |||
|---|---|---|---|
| Quadrant | BADHDUFLAG | Total packets | Discarded packets |
| A | 0 | 10 | 0 |
| B | 0 | 10 | 0 |
| C | 0 | 10 | 0 |
| D | 0 | 10 | 0 |
| Mode SS | |||
|---|---|---|---|
| Quadrant | BADHDUFLAG | Total packets | Discarded packets |
| A | 0 | 124 | 0 |
| B | 0 | 124 | 0 |
| C | 0 | 124 | 0 |
| D | 0 | 124 | 0 |
| Quadrant | Total seconds | Saturated seconds | Saturation percentage |
|---|---|---|---|
| A | 6025 | 115 | 1.908714% |
| B | 6025 | 214 | 3.551867% |
| C | 6025 | 177 | 2.937759% |
| D | 6025 | 231 | 3.834025% |
Noise dominated data is calculated using 1-second bins in cleaned event files. If a bin has >2000 counts, and if more than 50% of those come from <1% of pixels, then it is considered to be noise-dominated and hence unusable.
| Quadrant | # 1 sec bins | Bins with >0 counts | Bins with >2000 counts | High rate bins dominated by noise | Noise dominated (total time) | Noise dominated (detector-on time) | Marked lightcurve |
|---|---|---|---|---|---|---|---|
| A | 6980 | 6025 | 0 | 0 | 0.00% | 0.00% | 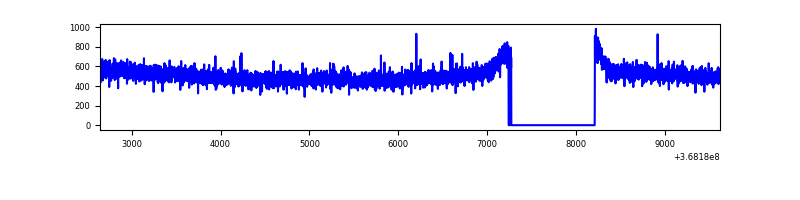 |
| B | 6980 | 6025 | 47 | 47 | 0.67% | 0.78% | 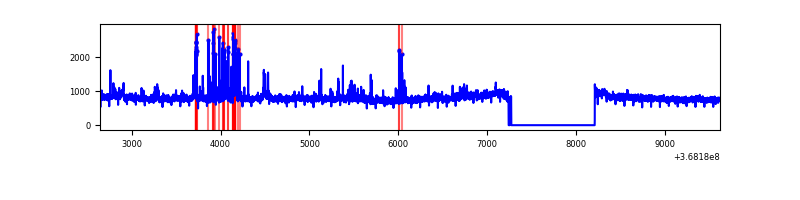 |
| C | 6980 | 6025 | 2 | 2 | 0.03% | 0.03% |  |
| D | 6979 | 6024 | 131 | 131 | 1.88% | 2.17% | 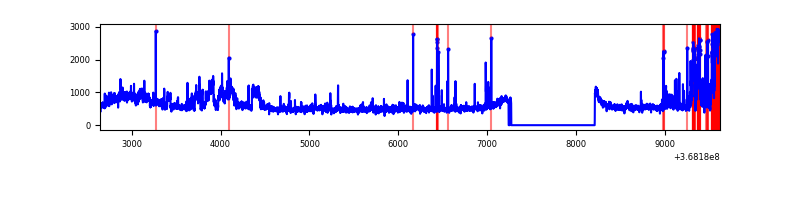 |
Top three noisy pixels from each quadrant. If the there are fewer than three noisy pixels in the level2.evt file, extra rows are filled as -1
| Pixel properties | Quadrant properties | ||||||
|---|---|---|---|---|---|---|---|
| Quadrant | DetID | PixID | Counts | Sigma | Mean | Median | Sigma |
| A | 13 | 254 | 11480 | 68.14 | 788 | 774 | 157.1 |
| A | 3 | 137 | 7497 | 42.79 | 788 | 774 | 157.1 |
| A | 0 | 226 | 6748 | 38.02 | 788 | 774 | 157.1 |
| B | 6 | 159 | 1612875 | 11197.24 | 765 | 746 | 144.0 |
| B | 5 | 172 | 190717 | 1319.47 | 765 | 746 | 144.0 |
| B | 10 | 245 | 71777 | 493.35 | 765 | 746 | 144.0 |
| C | 14 | 238 | 122900 | 708.02 | 747 | 754 | 172.5 |
| C | 3 | 233 | 97791 | 562.48 | 747 | 754 | 172.5 |
| C | 0 | 10 | 72377 | 415.16 | 747 | 754 | 172.5 |
| D | 8 | 195 | 674792 | 3729.18 | 759 | 740 | 180.8 |
| D | 12 | 227 | 437838 | 2418.24 | 759 | 740 | 180.8 |
| D | 2 | 120 | 35337 | 191.41 | 759 | 740 | 180.8 |
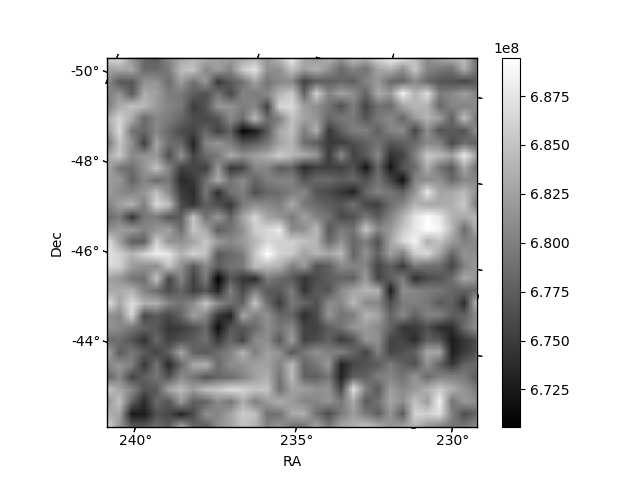
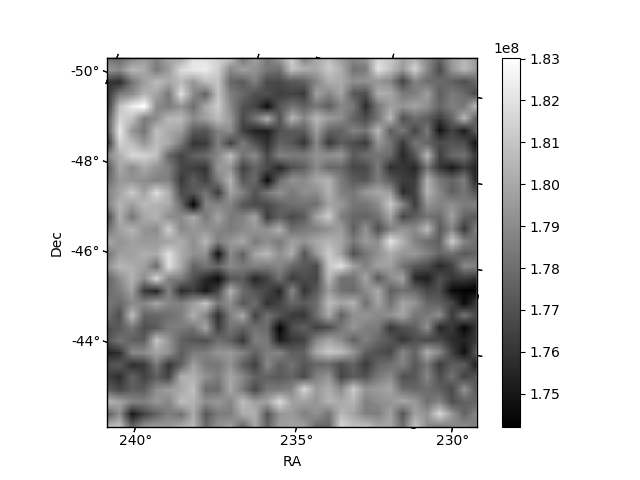
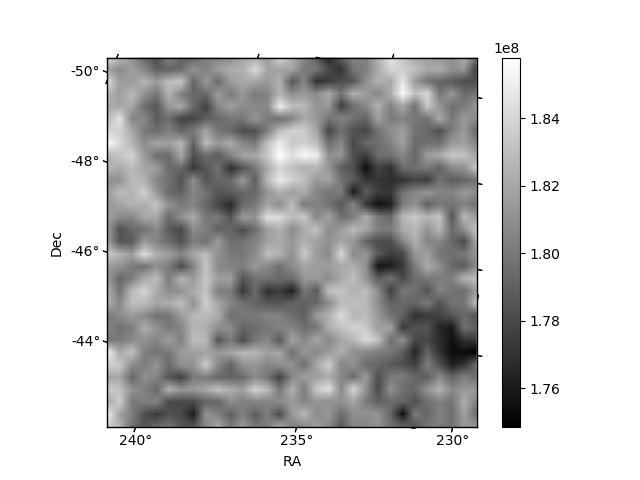
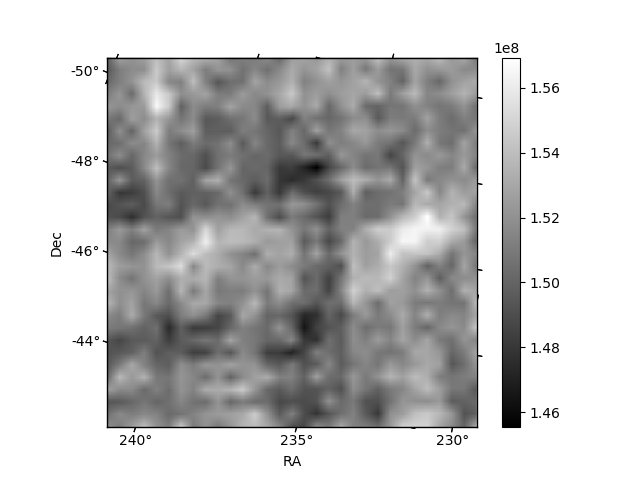
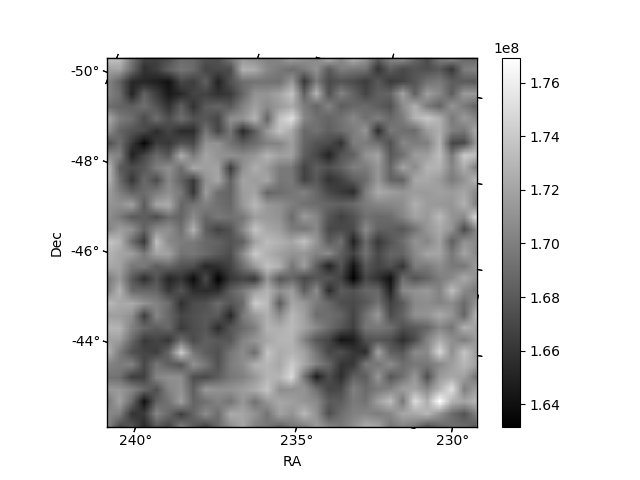
Histogram calculated using DETX and DETY for each event in the final _common_clean file
| Quadrant A | 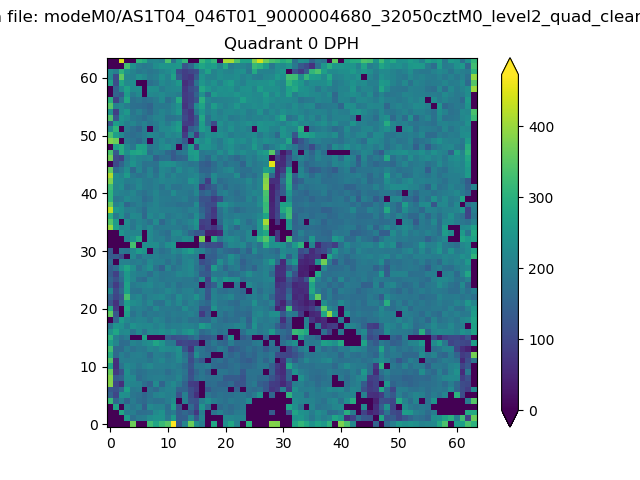 |
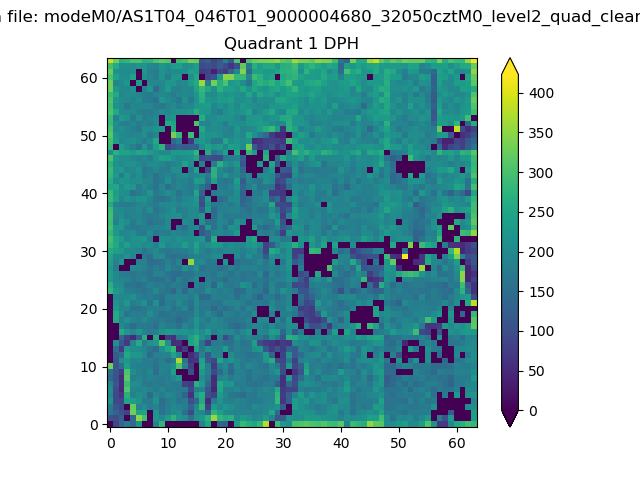 |
Quadrant B |
|---|---|---|---|
| Quadrant D | 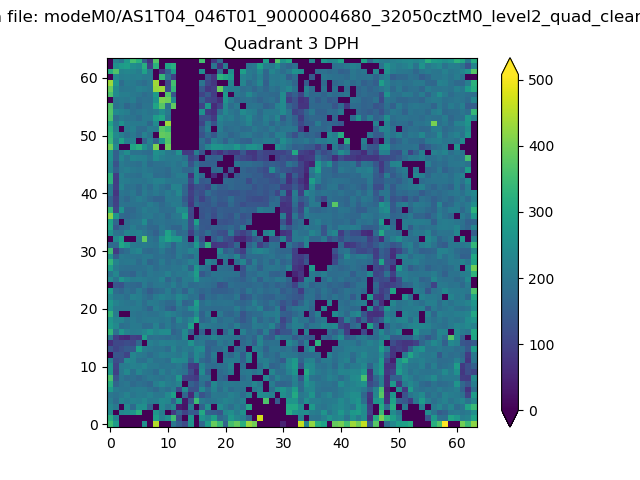 |
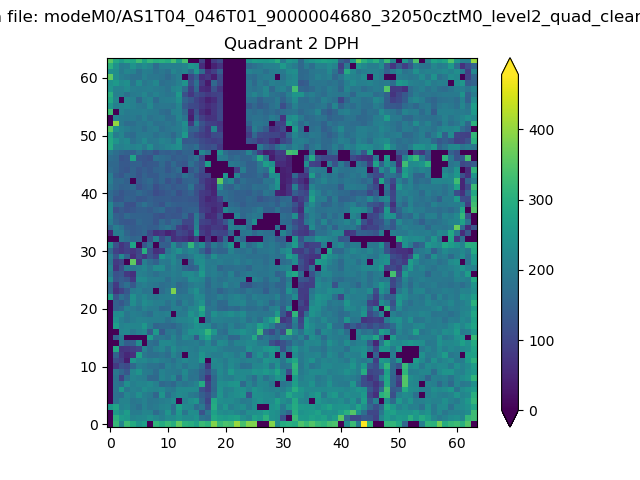 |
Quadrant C |
| Plot type | Count rate plots | Images |
|---|---|---|
| Comparison with Poisson distribution Blue bars denote a histogram of data divided into 1 sec bins. Red curve is a Poisson curve with rate = median count rate of data. |
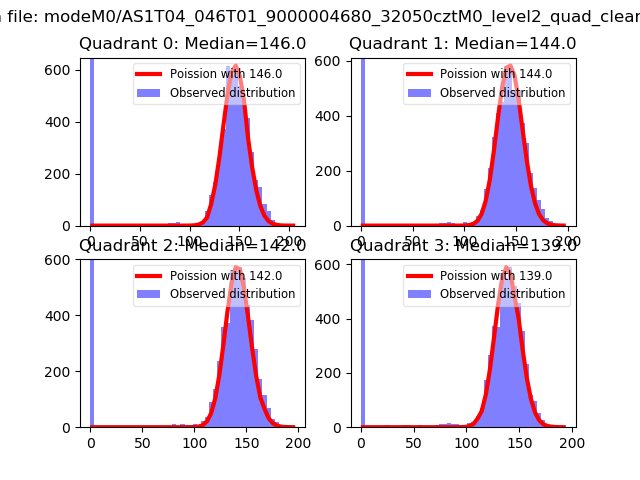 |
 |
| Quadrant-wise count rates Data is divided into 100 sec bins |
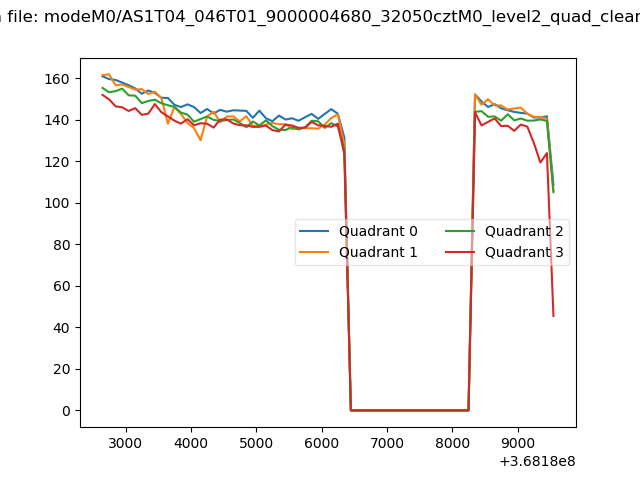 |
|
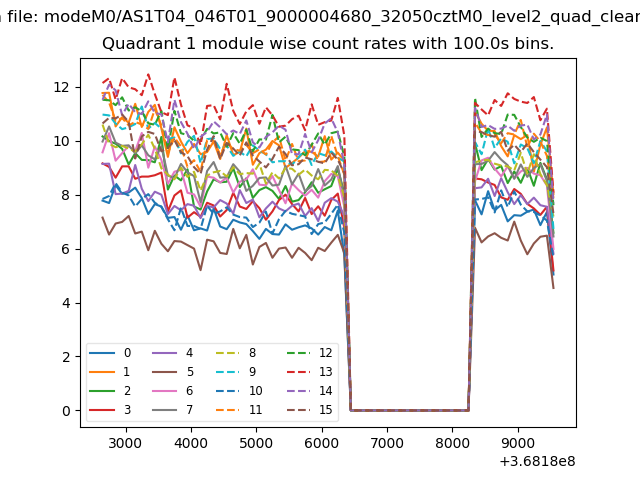
| Module-wise count rates for Quadrant A Data is divided into 100 sec bins |
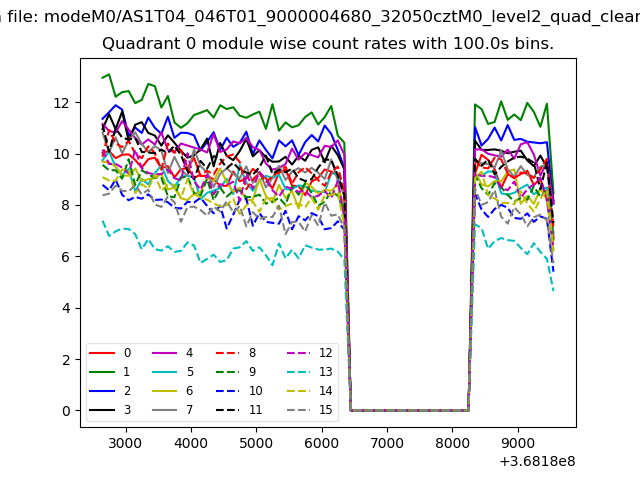 |
 |
| Module-wise count rates for Quadrant B Data is divided into 100 sec bins |
 |
 |
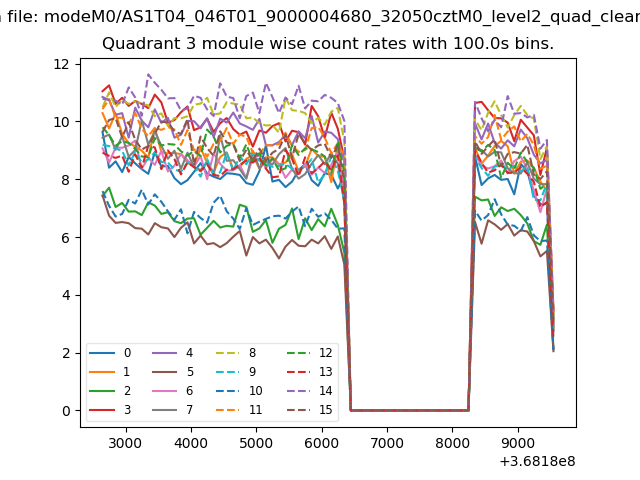
| Module-wise count rates for Quadrant C Data is divided into 100 sec bins |
 |
 |
| Module-wise count rates for Quadrant D Data is divided into 100 sec bins |
 |
 |
| Parameter | Plot |
|---|---|
| CZT HV Monitor | 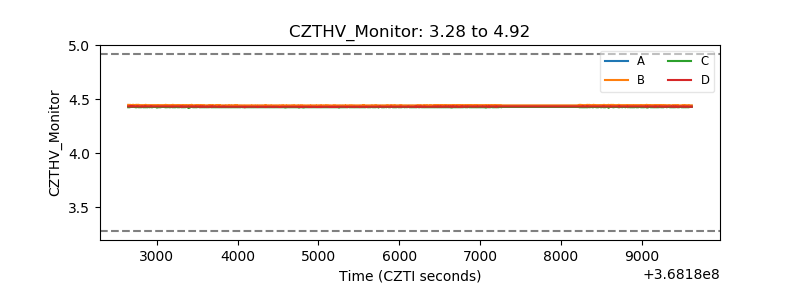 |
| D_VDD | 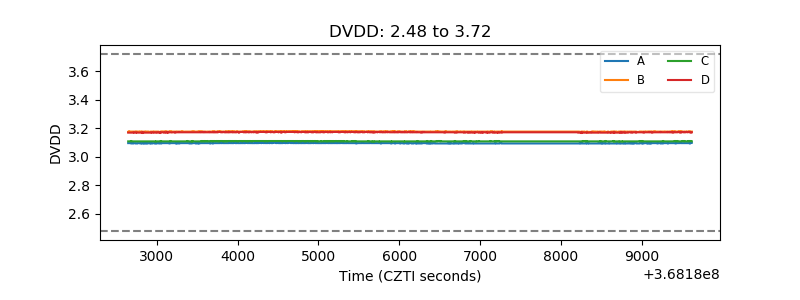 |
| Temperature 1 | 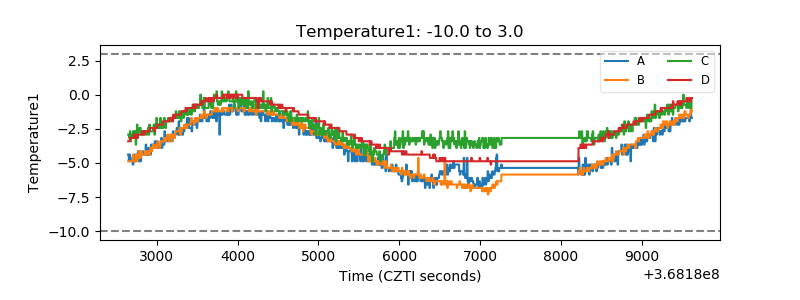 |
| Veto HV Monitor | 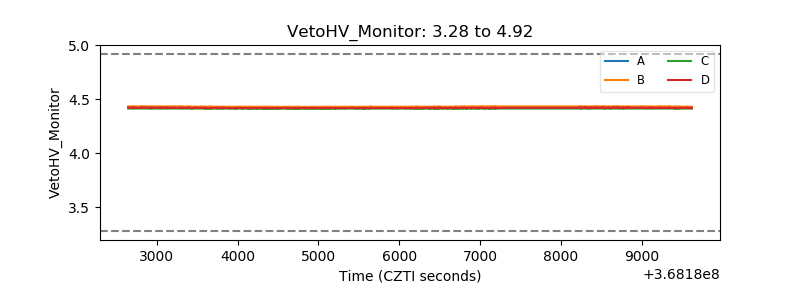 |
| Veto LLD | 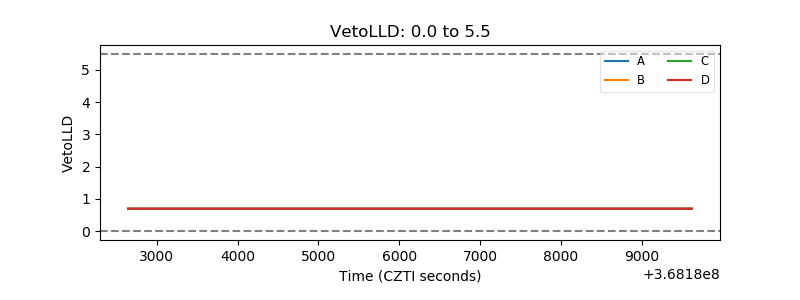 |
| Alpha Counter | 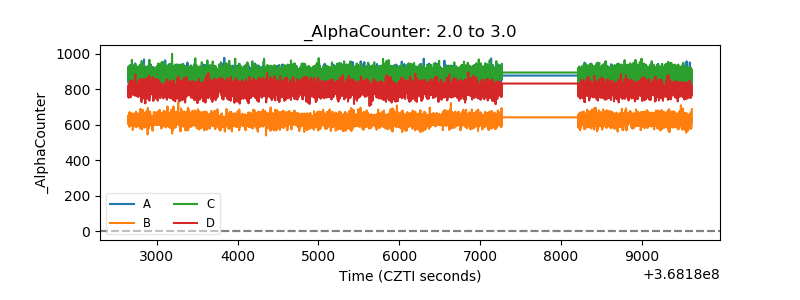 |
| _CPM_Rate | 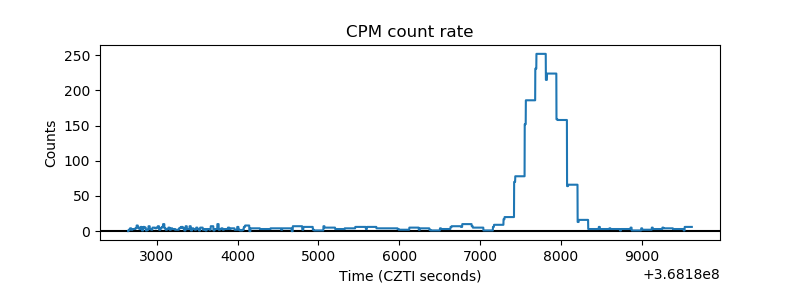 |
| CZT Counter | 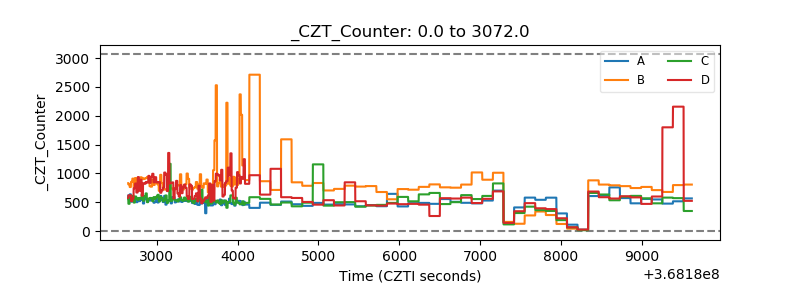 |
| +2.5 Volts monitor | 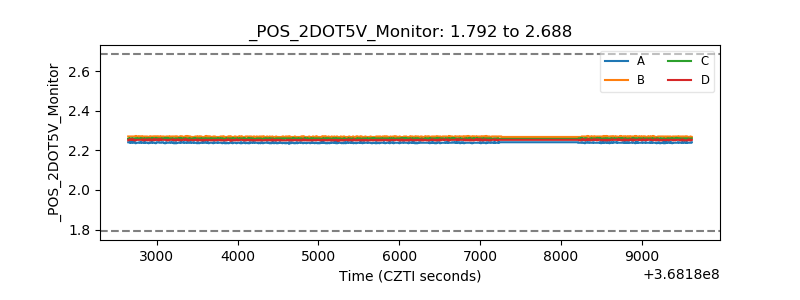 |
| +5 Volts monitor | 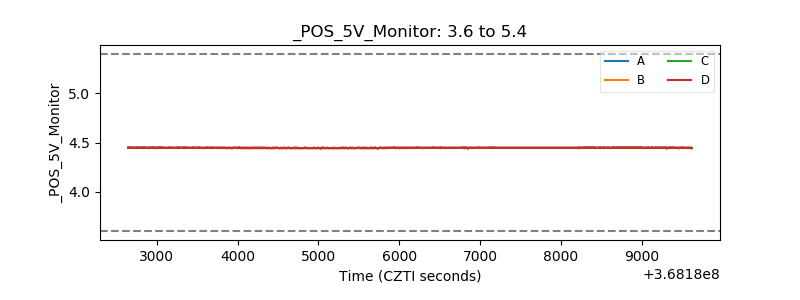 |
| _ROLL_ROT | 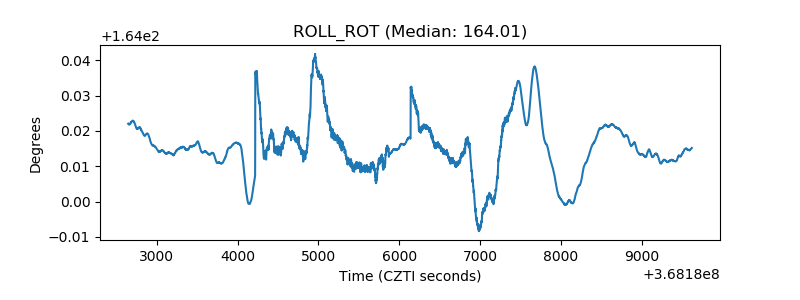 |
| _Roll_DEC | 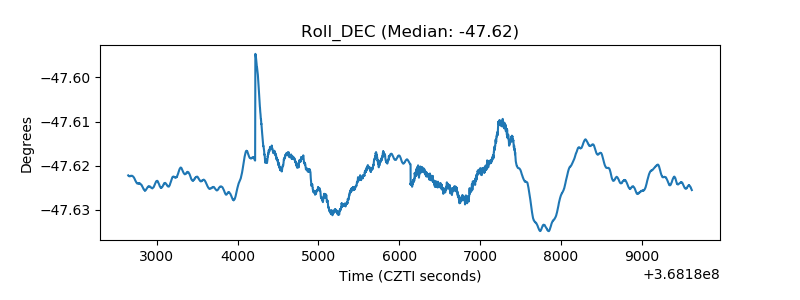 |
| _Roll_RA | 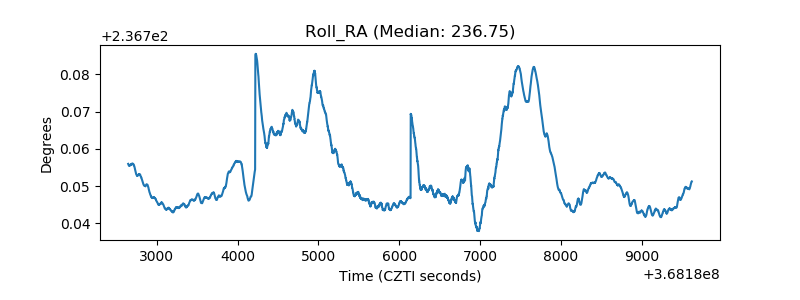 |
| Veto Counter | 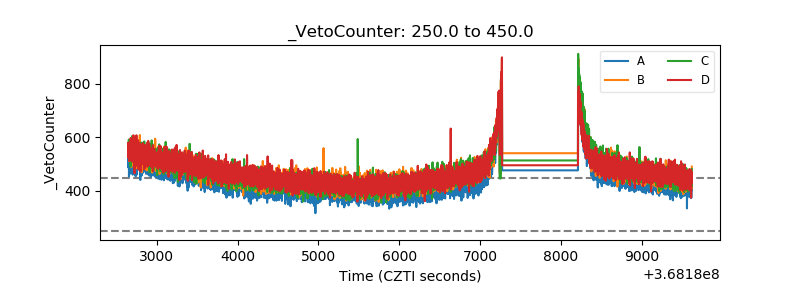 |