| Param | Original file | Final file |
|---|---|---|
| Filename | modeM0/AS1T04_046T01_9000004680_32051cztM0_level2.evt | modeM0/AS1T04_046T01_9000004680_32051cztM0_level2_quad_clean.evt |
| Size (bytes) | 712,635,840 | 101,666,880 |
| Size | 679.6 MB | 97.0 MB |
| Events in quadrant A | 3,239,927 | 696,582 |
| Events in quadrant B | 5,276,587 | 682,617 |
| Events in quadrant C | 3,434,964 | 680,287 |
| Events in quadrant D | 9,181,625 | 555,079 |
| Mode M0 | |||
|---|---|---|---|
| Quadrant | BADHDUFLAG | Total packets | Discarded packets |
| A | 0 | 13732 | 2 |
| B | 0 | 20682 | 2 |
| C | 0 | 14186 | 2 |
| D | 0 | 31882 | 2 |
| Mode M9 | |||
|---|---|---|---|
| Quadrant | BADHDUFLAG | Total packets | Discarded packets |
| A | 0 | 6 | 0 |
| B | 0 | 6 | 0 |
| C | 0 | 6 | 0 |
| D | 0 | 6 | 0 |
| Mode SS | |||
|---|---|---|---|
| Quadrant | BADHDUFLAG | Total packets | Discarded packets |
| A | 0 | 136 | 0 |
| B | 0 | 136 | 0 |
| C | 0 | 136 | 0 |
| D | 0 | 136 | 0 |
| Quadrant | Total seconds | Saturated seconds | Saturation percentage |
|---|---|---|---|
| A | 6648 | 81 | 1.218412% |
| B | 6649 | 211 | 3.173410% |
| C | 6649 | 138 | 2.075500% |
| D | 6649 | 1700 | 25.567755% |
Noise dominated data is calculated using 1-second bins in cleaned event files. If a bin has >2000 counts, and if more than 50% of those come from <1% of pixels, then it is considered to be noise-dominated and hence unusable.
| Quadrant | # 1 sec bins | Bins with >0 counts | Bins with >2000 counts | High rate bins dominated by noise | Noise dominated (total time) | Noise dominated (detector-on time) | Marked lightcurve |
|---|---|---|---|---|---|---|---|
| A | 7238 | 6649 | 2 | 2 | 0.03% | 0.03% | 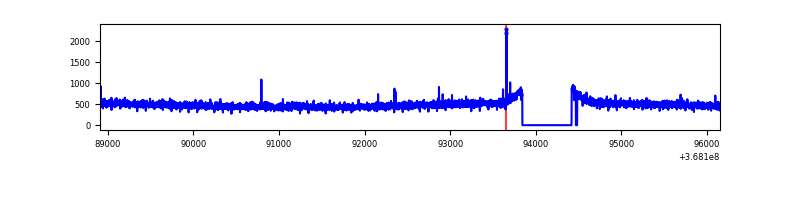 |
| B | 7239 | 6650 | 47 | 47 | 0.65% | 0.71% | 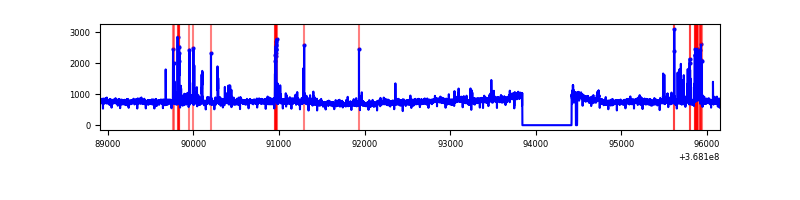 |
| C | 7239 | 6651 | 0 | 0 | 0.00% | 0.00% | 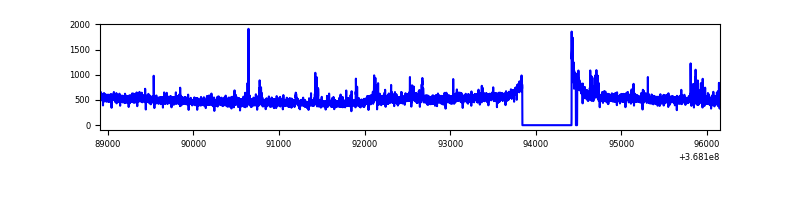 |
| D | 7238 | 6650 | 1745 | 1745 | 24.11% | 26.24% | 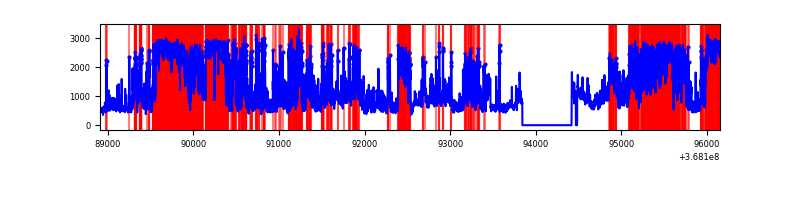 |
Top three noisy pixels from each quadrant. If the there are fewer than three noisy pixels in the level2.evt file, extra rows are filled as -1
| Pixel properties | Quadrant properties | ||||||
|---|---|---|---|---|---|---|---|
| Quadrant | DetID | PixID | Counts | Sigma | Mean | Median | Sigma |
| A | 15 | 174 | 13006 | 72.87 | 833 | 817 | 167.3 |
| A | 13 | 254 | 12932 | 72.43 | 833 | 817 | 167.3 |
| A | 3 | 137 | 8158 | 43.89 | 833 | 817 | 167.3 |
| B | 6 | 159 | 1770226 | 11583.08 | 811 | 792 | 152.8 |
| B | 5 | 172 | 210725 | 1374.27 | 811 | 792 | 152.8 |
| B | 10 | 245 | 29095 | 185.28 | 811 | 792 | 152.8 |
| C | 14 | 238 | 130486 | 703.66 | 790 | 795 | 184.3 |
| C | 3 | 233 | 124395 | 670.61 | 790 | 795 | 184.3 |
| C | 0 | 10 | 49114 | 262.16 | 790 | 795 | 184.3 |
| D | 12 | 227 | 5243454 | 30193.3 | 729 | 710 | 173.6 |
| D | 8 | 195 | 900013 | 5179.14 | 729 | 710 | 173.6 |
| D | 7 | 38 | 159708 | 915.68 | 729 | 710 | 173.6 |
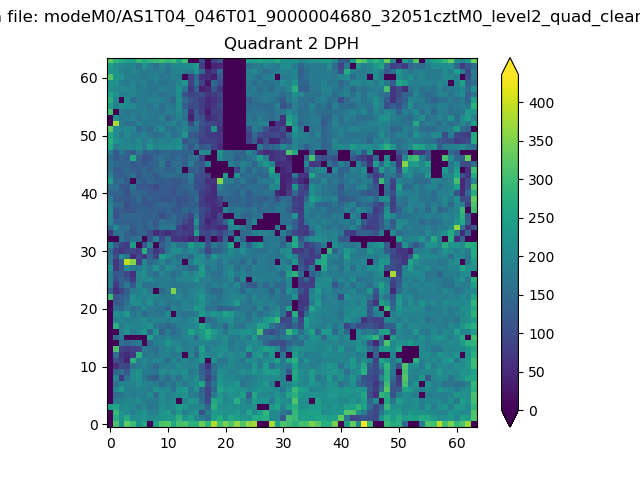
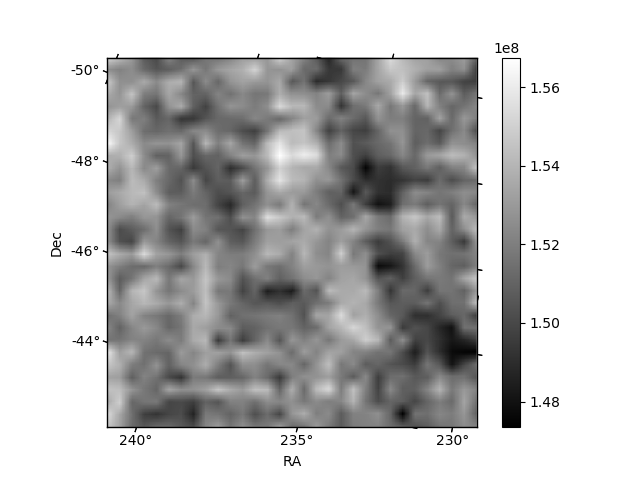
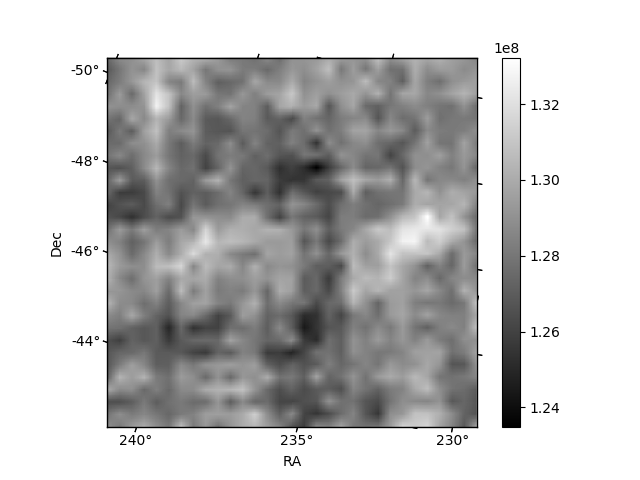
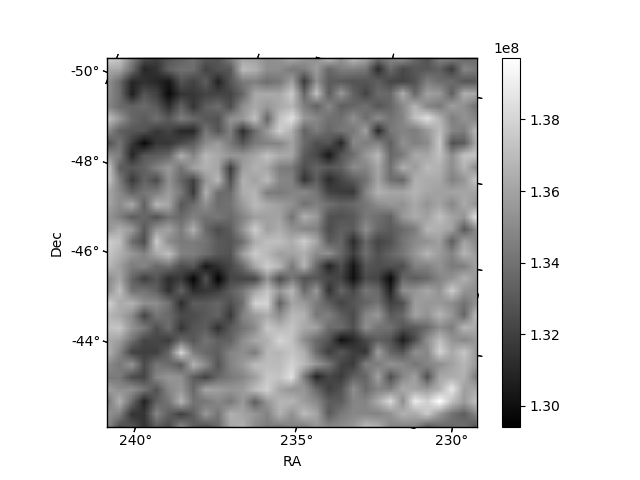
Histogram calculated using DETX and DETY for each event in the final _common_clean file
| Quadrant A | 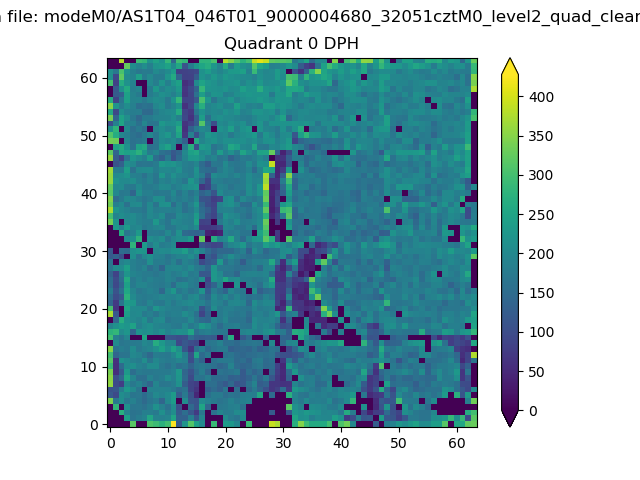 |
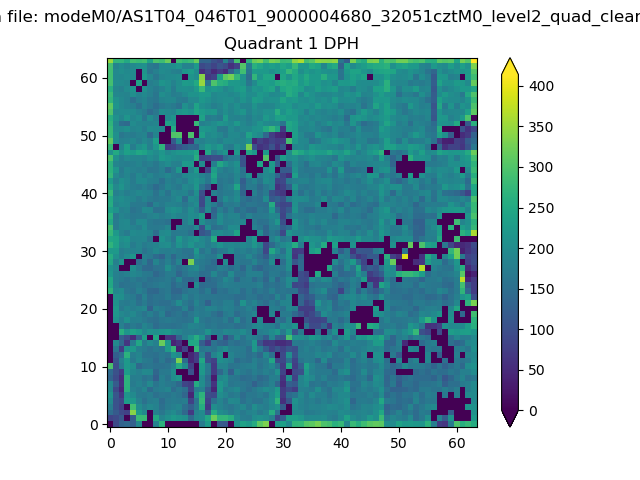 |
Quadrant B |
|---|---|---|---|
| Quadrant D | 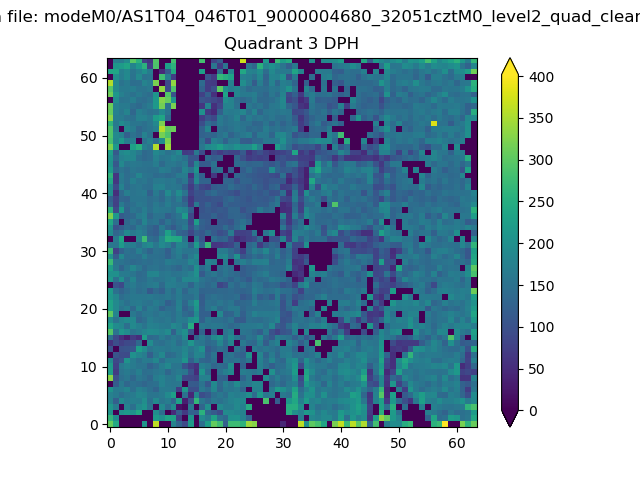 |
 |
Quadrant C |
| Plot type | Count rate plots | Images |
|---|---|---|
| Comparison with Poisson distribution Blue bars denote a histogram of data divided into 1 sec bins. Red curve is a Poisson curve with rate = median count rate of data. |
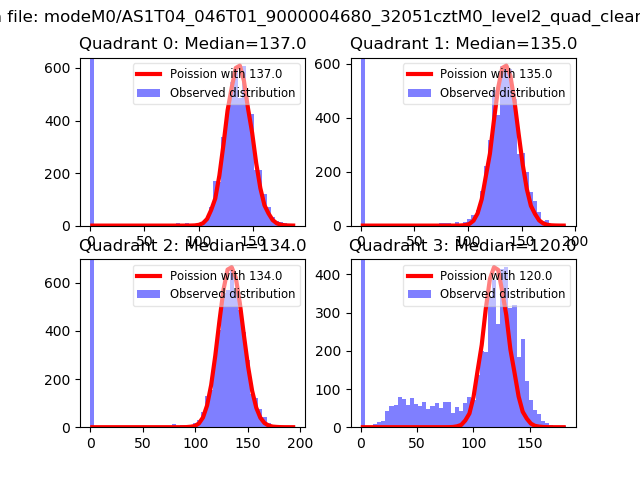 |
 |
| Quadrant-wise count rates Data is divided into 100 sec bins |
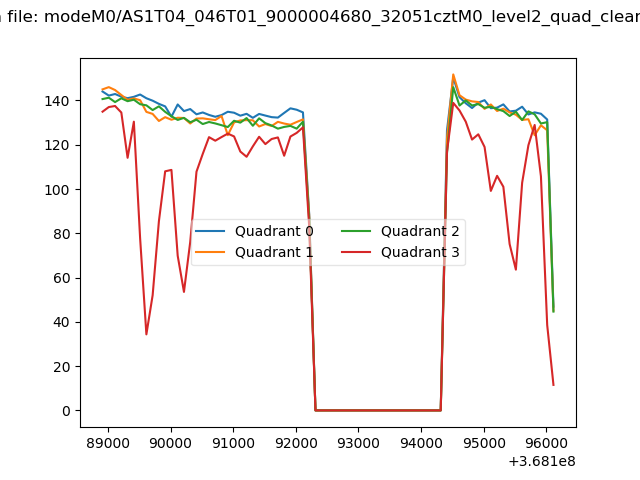 |
|
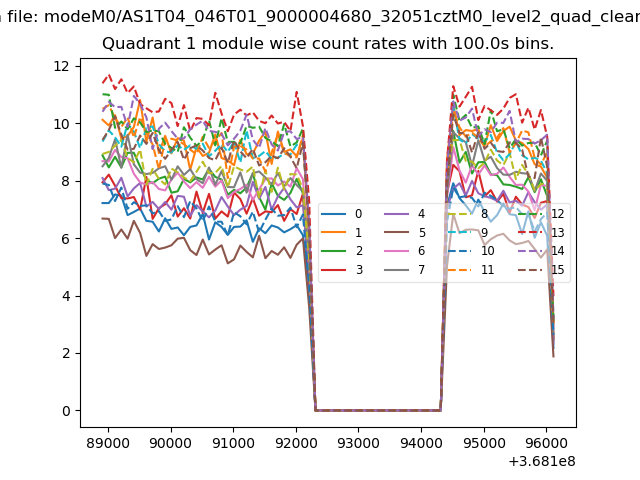
| Module-wise count rates for Quadrant A Data is divided into 100 sec bins |
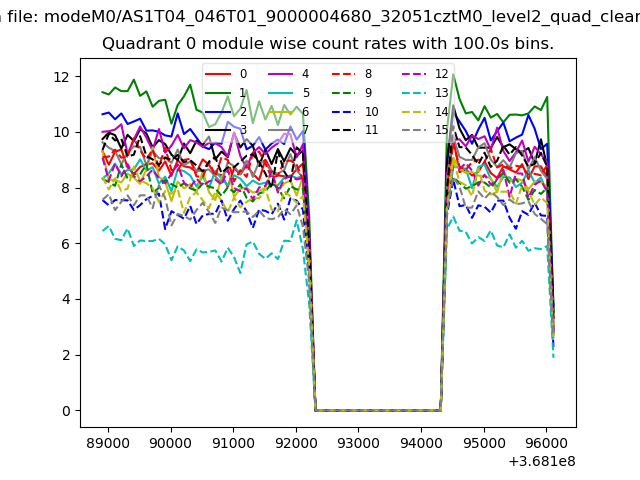 |
 |
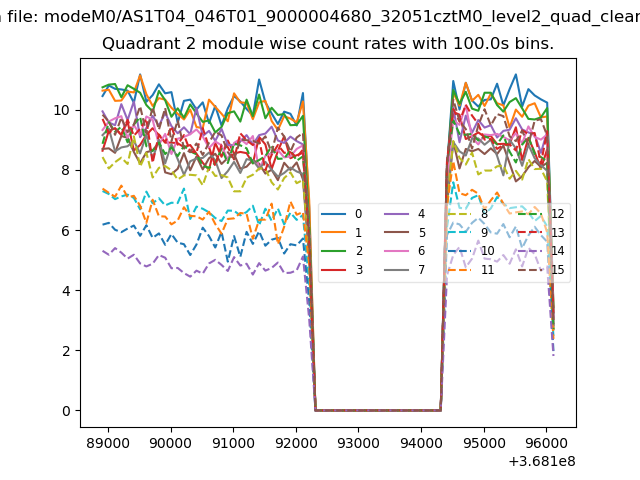
| Module-wise count rates for Quadrant B Data is divided into 100 sec bins |
 |
 |
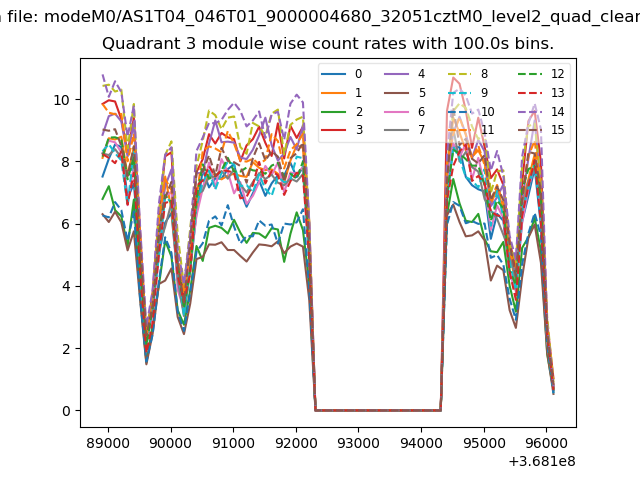
| Module-wise count rates for Quadrant C Data is divided into 100 sec bins |
 |
 |
| Module-wise count rates for Quadrant D Data is divided into 100 sec bins |
 |
 |
| Parameter | Plot |
|---|---|
| CZT HV Monitor | 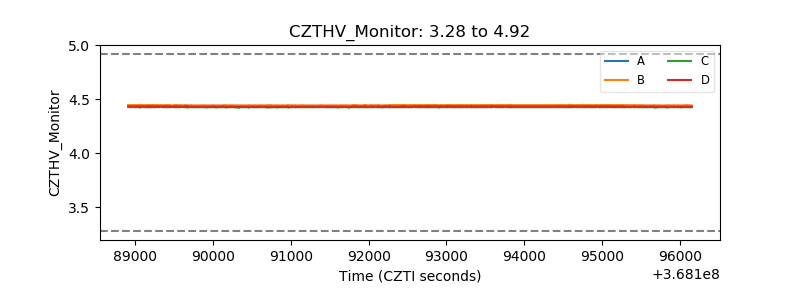 |
| D_VDD | 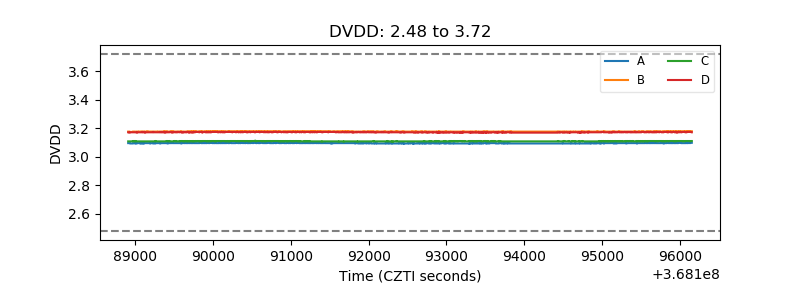 |
| Temperature 1 |  |
| Veto HV Monitor | 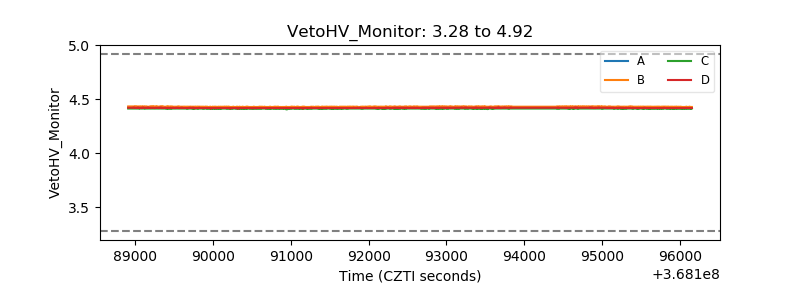 |
| Veto LLD | 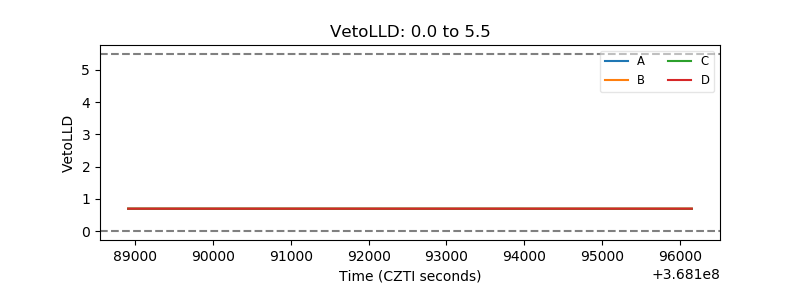 |
| Alpha Counter | 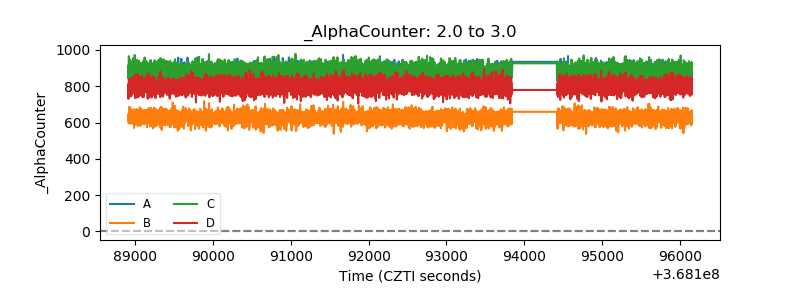 |
| _CPM_Rate | 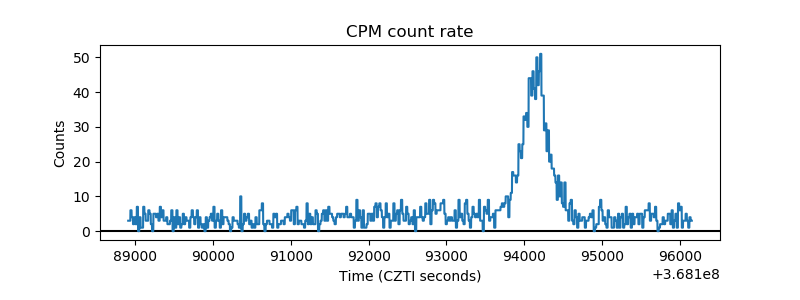 |
| CZT Counter | 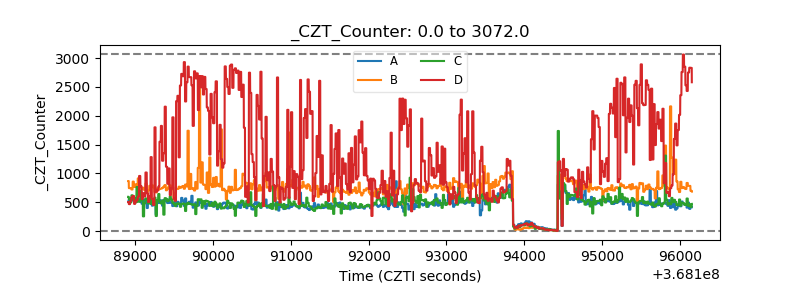 |
| +2.5 Volts monitor |  |
| +5 Volts monitor | 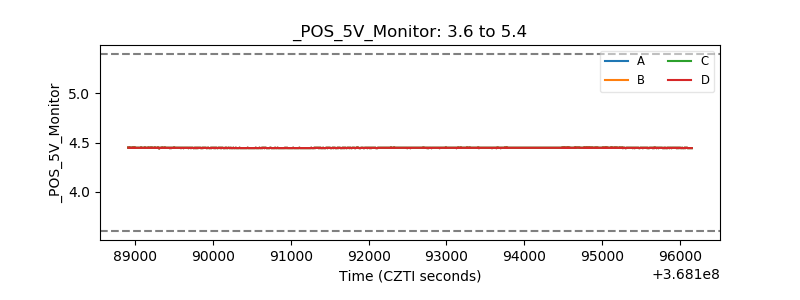 |
| _ROLL_ROT | 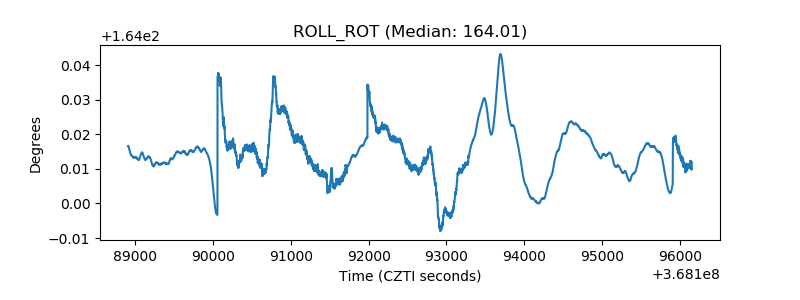 |
| _Roll_DEC | 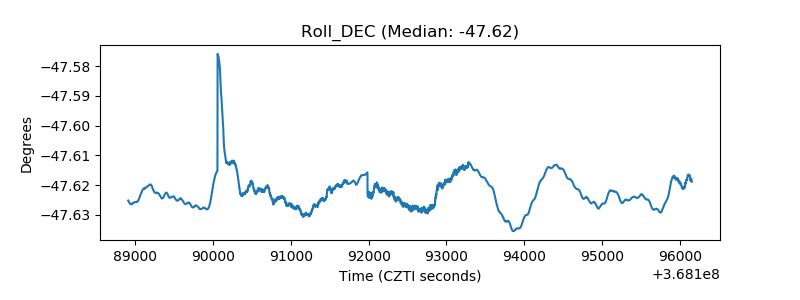 |
| _Roll_RA | 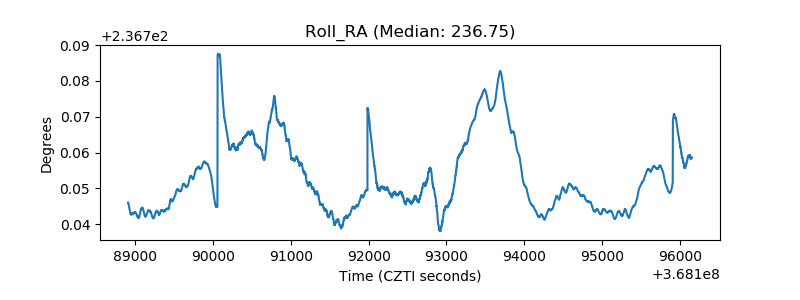 |
| Veto Counter | 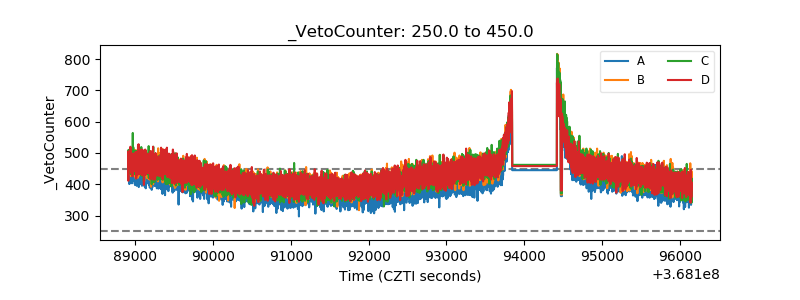 |