| Param | Original file | Final file |
|---|---|---|
| Filename | modeM0/AS1T04_046T01_9000004680_32052cztM0_level2.evt | modeM0/AS1T04_046T01_9000004680_32052cztM0_level2_quad_clean.evt |
| Size (bytes) | 665,343,360 | 95,394,240 |
| Size | 634.5 MB | 91.0 MB |
| Events in quadrant A | 3,255,884 | 642,417 |
| Events in quadrant B | 5,560,773 | 624,028 |
| Events in quadrant C | 3,414,864 | 626,733 |
| Events in quadrant D | 7,464,764 | 527,322 |
| Mode M0 | |||
|---|---|---|---|
| Quadrant | BADHDUFLAG | Total packets | Discarded packets |
| A | 0 | 13974 | 1 |
| B | 0 | 21402 | 1 |
| C | 0 | 14342 | 1 |
| D | 0 | 26580 | 1 |
| Mode M9 | |||
|---|---|---|---|
| Quadrant | BADHDUFLAG | Total packets | Discarded packets |
| A | 0 | 1 | 0 |
| B | 0 | 1 | 0 |
| C | 0 | 1 | 0 |
| D | 0 | 1 | 0 |
| Mode SS | |||
|---|---|---|---|
| Quadrant | BADHDUFLAG | Total packets | Discarded packets |
| A | 0 | 136 | 0 |
| B | 0 | 136 | 0 |
| C | 0 | 136 | 0 |
| D | 0 | 136 | 0 |
| Quadrant | Total seconds | Saturated seconds | Saturation percentage |
|---|---|---|---|
| A | 6705 | 141 | 2.102908% |
| B | 6706 | 398 | 5.934984% |
| C | 6706 | 196 | 2.922756% |
| D | 6706 | 1357 | 20.235610% |
Noise dominated data is calculated using 1-second bins in cleaned event files. If a bin has >2000 counts, and if more than 50% of those come from <1% of pixels, then it is considered to be noise-dominated and hence unusable.
| Quadrant | # 1 sec bins | Bins with >0 counts | Bins with >2000 counts | High rate bins dominated by noise | Noise dominated (total time) | Noise dominated (detector-on time) | Marked lightcurve |
|---|---|---|---|---|---|---|---|
| A | 6810 | 6706 | 0 | 0 | 0.00% | 0.00% | 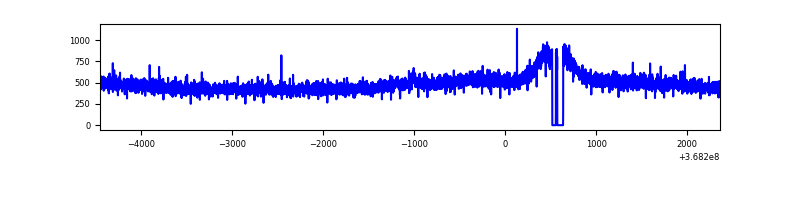 |
| B | 6811 | 6706 | 116 | 116 | 1.70% | 1.73% | 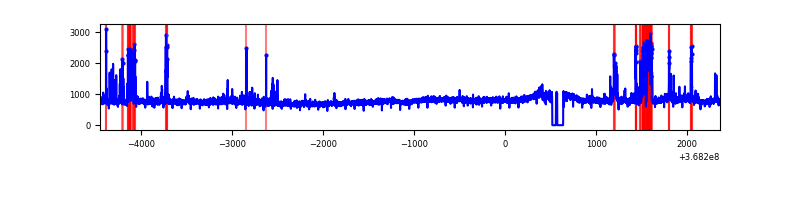 |
| C | 6811 | 6707 | 2 | 2 | 0.03% | 0.03% | 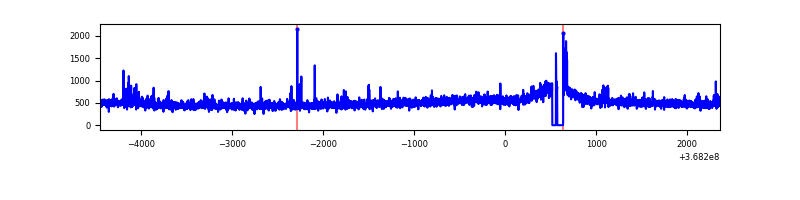 |
| D | 6811 | 6707 | 1324 | 1324 | 19.44% | 19.74% | 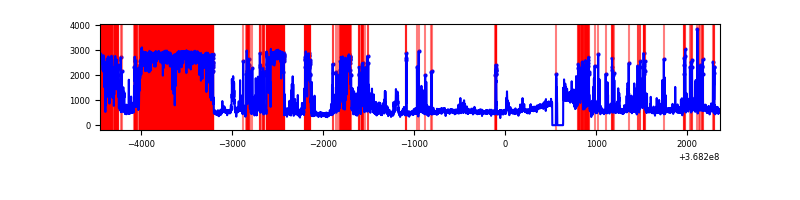 |
Top three noisy pixels from each quadrant. If the there are fewer than three noisy pixels in the level2.evt file, extra rows are filled as -1
| Pixel properties | Quadrant properties | ||||||
|---|---|---|---|---|---|---|---|
| Quadrant | DetID | PixID | Counts | Sigma | Mean | Median | Sigma |
| A | 13 | 6 | 14190 | 79.78 | 840 | 822 | 167.6 |
| A | 13 | 254 | 13035 | 72.89 | 840 | 822 | 167.6 |
| A | 3 | 137 | 8371 | 45.05 | 840 | 822 | 167.6 |
| B | 6 | 159 | 1840773 | 11817.56 | 812 | 792 | 155.7 |
| B | 5 | 172 | 361991 | 2319.86 | 812 | 792 | 155.7 |
| B | 10 | 245 | 54258 | 343.39 | 812 | 792 | 155.7 |
| C | 14 | 238 | 136272 | 719.41 | 795 | 799 | 188.3 |
| C | 0 | 10 | 102960 | 542.52 | 795 | 799 | 188.3 |
| C | 3 | 233 | 36716 | 190.73 | 795 | 799 | 188.3 |
| D | 12 | 227 | 4065963 | 22958.4 | 747 | 725 | 177.1 |
| D | 8 | 195 | 427346 | 2409.34 | 747 | 725 | 177.1 |
| D | 2 | 250 | 54968 | 306.34 | 747 | 725 | 177.1 |
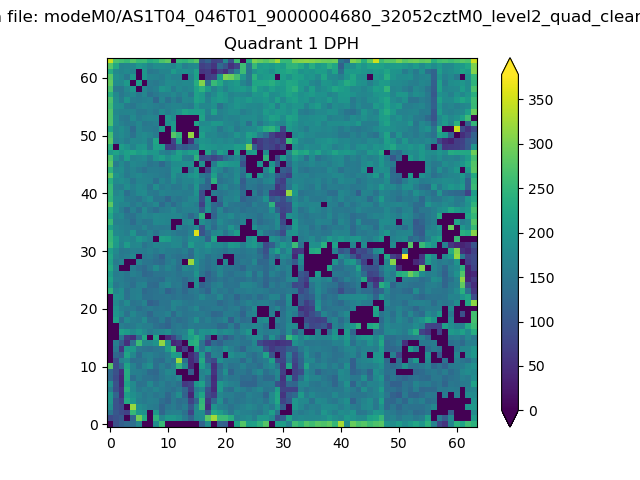
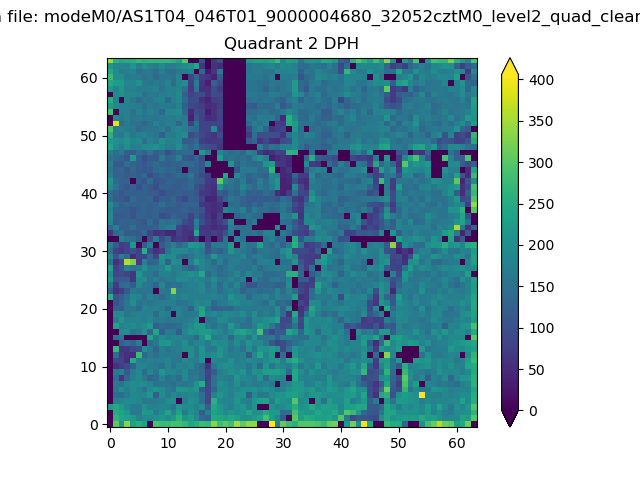
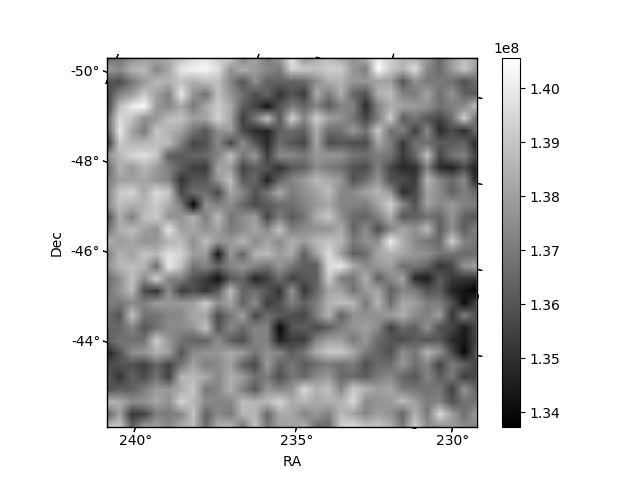
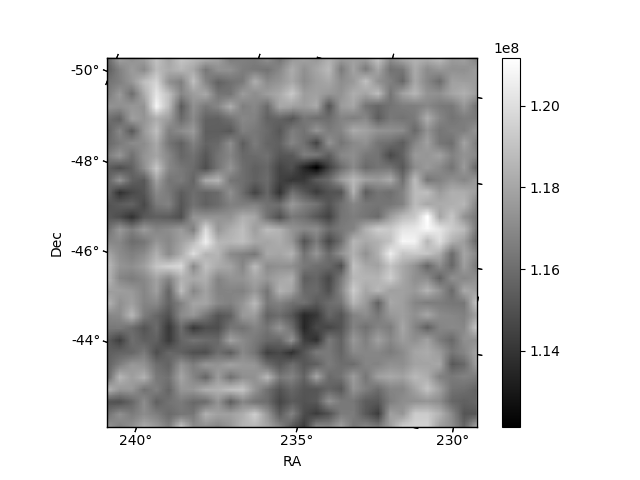
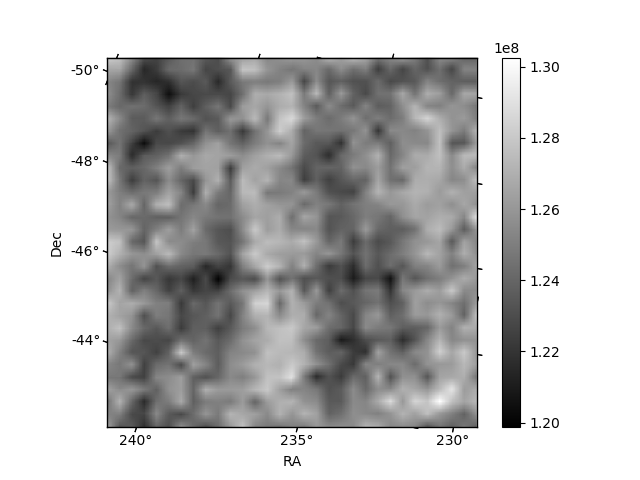
Histogram calculated using DETX and DETY for each event in the final _common_clean file
| Quadrant A |  |
 |
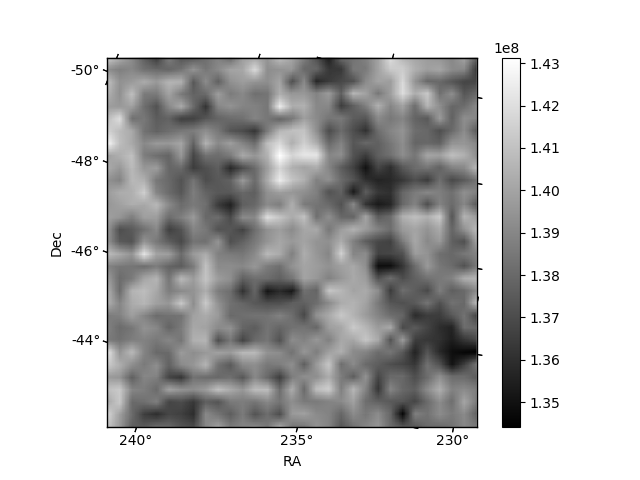
Quadrant B |
|---|---|---|---|
| Quadrant D |  |
 |
Quadrant C |
| Plot type | Count rate plots | Images |
|---|---|---|
| Comparison with Poisson distribution Blue bars denote a histogram of data divided into 1 sec bins. Red curve is a Poisson curve with rate = median count rate of data. |
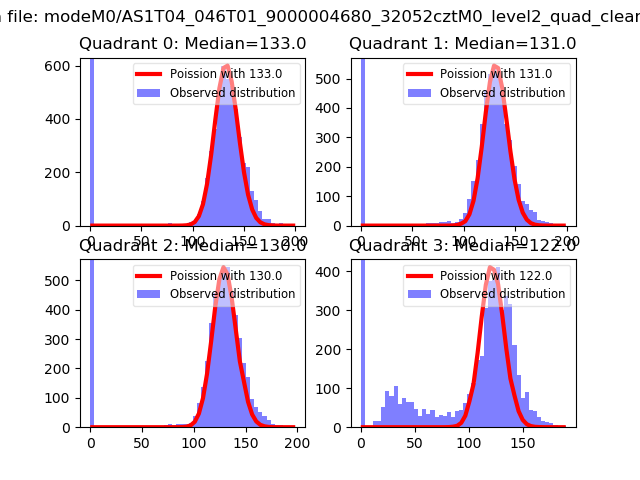 |
 |
| Quadrant-wise count rates Data is divided into 100 sec bins |
 |
|
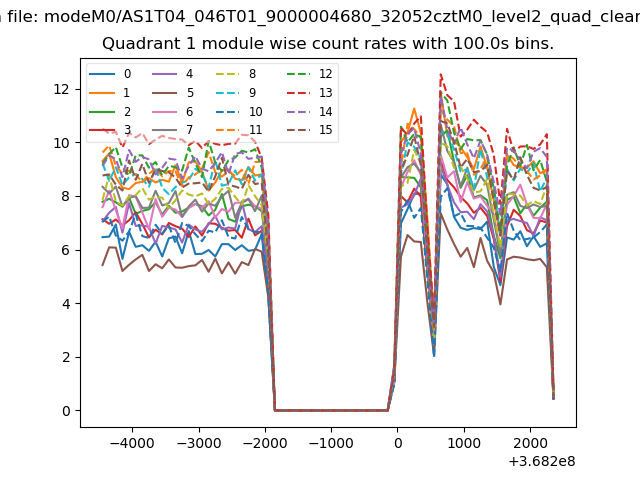
| Module-wise count rates for Quadrant A Data is divided into 100 sec bins |
 |
 |
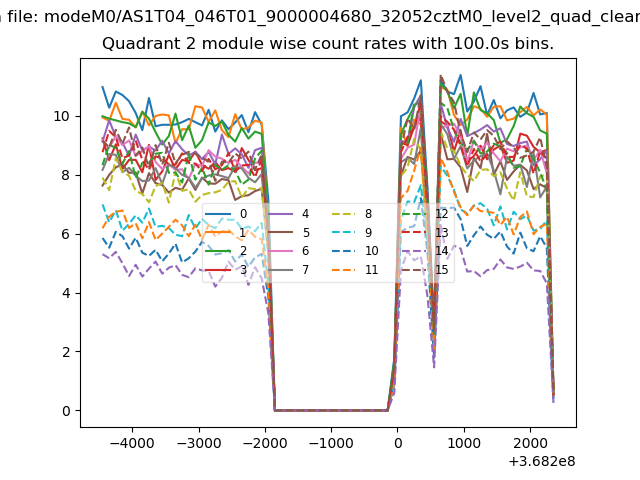
| Module-wise count rates for Quadrant B Data is divided into 100 sec bins |
 |
 |
| Module-wise count rates for Quadrant C Data is divided into 100 sec bins |
 |
 |
| Module-wise count rates for Quadrant D Data is divided into 100 sec bins |
 |
 |
| Parameter | Plot |
|---|---|
| CZT HV Monitor |  |
| D_VDD | 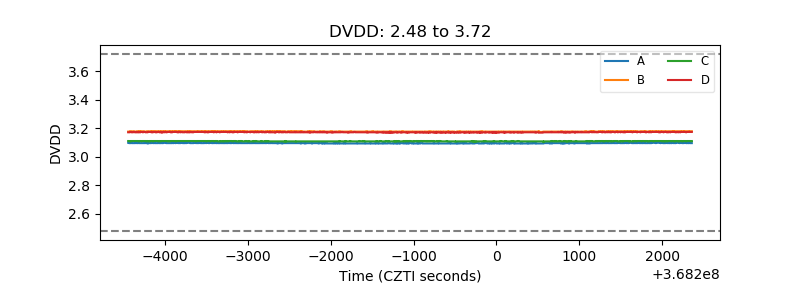 |
| Temperature 1 | 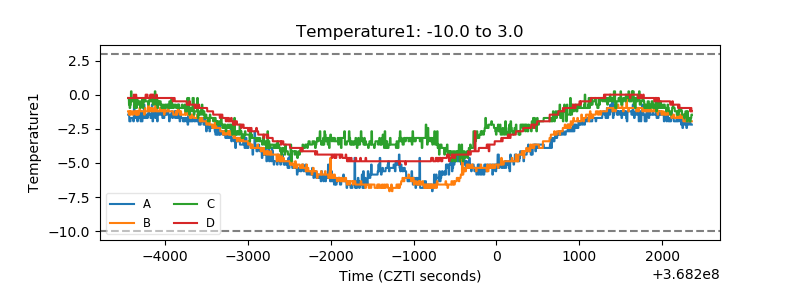 |
| Veto HV Monitor | 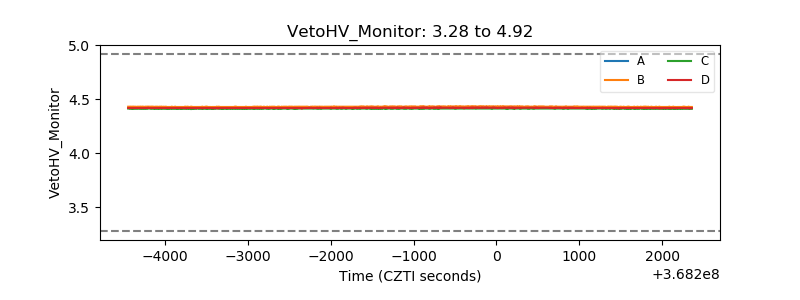 |
| Veto LLD | 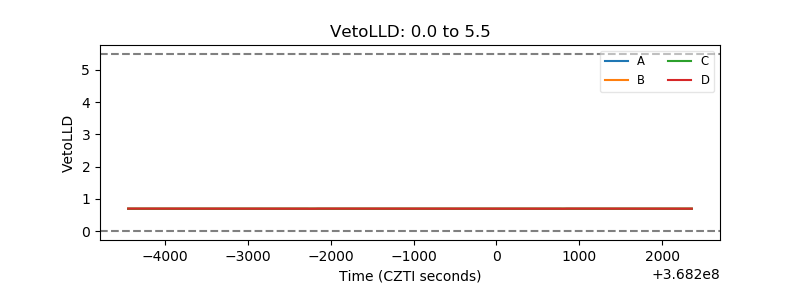 |
| Alpha Counter | 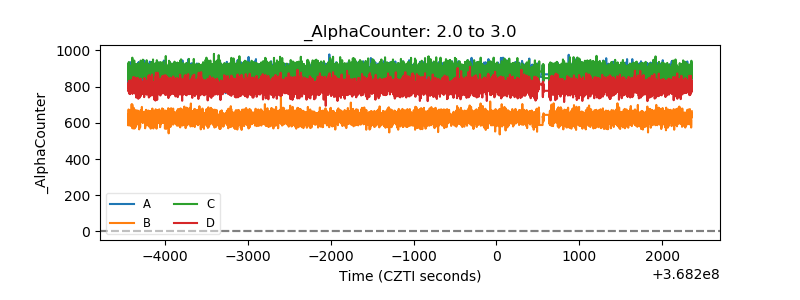 |
| _CPM_Rate | 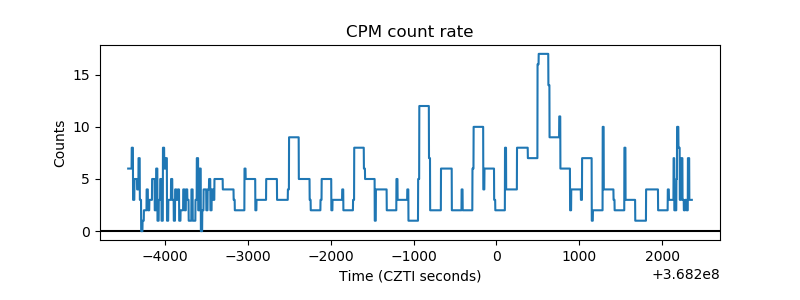 |
| CZT Counter | 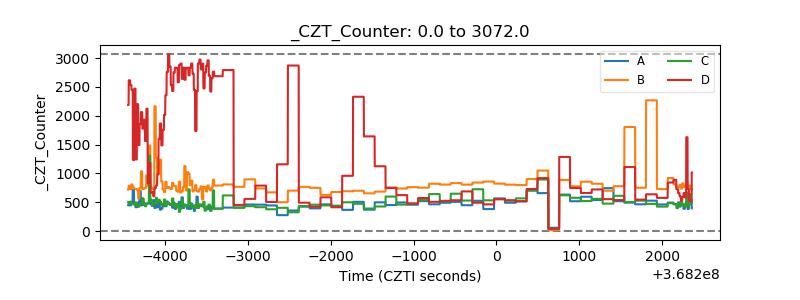 |
| +2.5 Volts monitor |  |
| +5 Volts monitor |  |
| _ROLL_ROT | 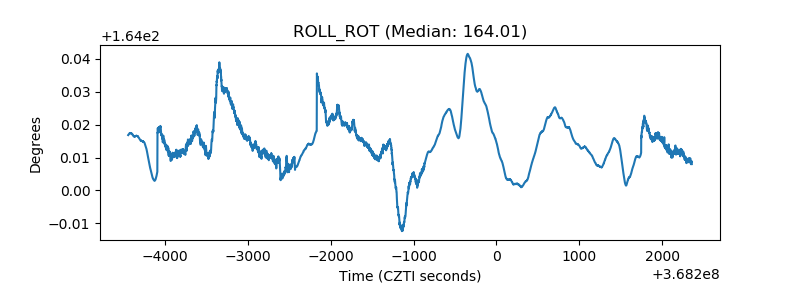 |
| _Roll_DEC | 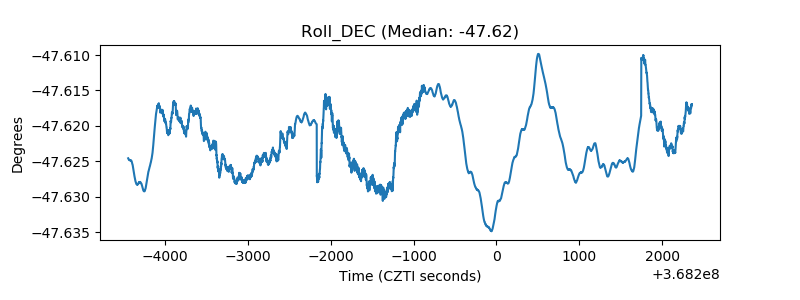 |
| _Roll_RA | 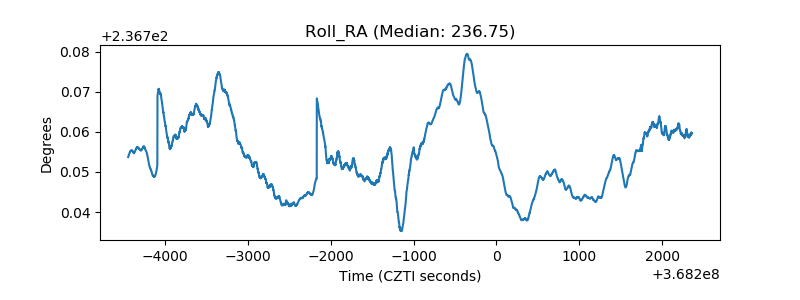 |
| Veto Counter | 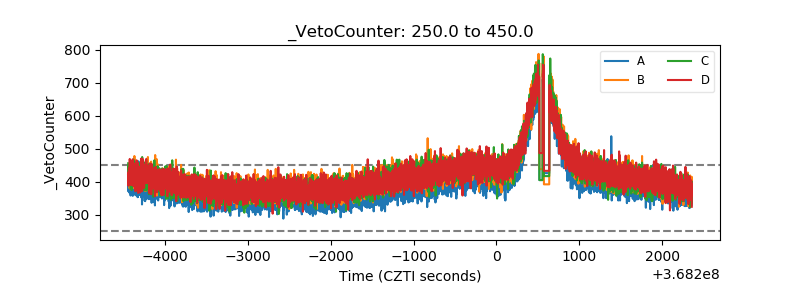 |