| Param | Original file | Final file |
|---|---|---|
| Filename | modeM0/AS1T04_046T01_9000004680_32053cztM0_level2.evt | modeM0/AS1T04_046T01_9000004680_32053cztM0_level2_quad_clean.evt |
| Size (bytes) | 576,803,520 | 97,983,360 |
| Size | 550.1 MB | 93.4 MB |
| Events in quadrant A | 3,234,020 | 646,276 |
| Events in quadrant B | 5,737,121 | 621,161 |
| Events in quadrant C | 3,456,198 | 627,519 |
| Events in quadrant D | 4,582,064 | 599,617 |
| Mode M0 | |||
|---|---|---|---|
| Quadrant | BADHDUFLAG | Total packets | Discarded packets |
| A | 0 | 13995 | 1 |
| B | 0 | 21874 | 1 |
| C | 0 | 14609 | 1 |
| D | 0 | 18040 | 1 |
| Mode M9 | |||
|---|---|---|---|
| Quadrant | BADHDUFLAG | Total packets | Discarded packets |
| A | 0 | 3 | 0 |
| B | 0 | 3 | 0 |
| C | 0 | 3 | 0 |
| D | 0 | 3 | 0 |
| Mode SS | |||
|---|---|---|---|
| Quadrant | BADHDUFLAG | Total packets | Discarded packets |
| A | 0 | 136 | 0 |
| B | 0 | 136 | 0 |
| C | 0 | 136 | 0 |
| D | 0 | 136 | 0 |
| Quadrant | Total seconds | Saturated seconds | Saturation percentage |
|---|---|---|---|
| A | 6791 | 67 | 0.986600% |
| B | 6792 | 357 | 5.256184% |
| C | 6792 | 142 | 2.090695% |
| D | 6792 | 221 | 3.253828% |
Noise dominated data is calculated using 1-second bins in cleaned event files. If a bin has >2000 counts, and if more than 50% of those come from <1% of pixels, then it is considered to be noise-dominated and hence unusable.
| Quadrant | # 1 sec bins | Bins with >0 counts | Bins with >2000 counts | High rate bins dominated by noise | Noise dominated (total time) | Noise dominated (detector-on time) | Marked lightcurve |
|---|---|---|---|---|---|---|---|
| A | 6986 | 6792 | 0 | 0 | 0.00% | 0.00% | 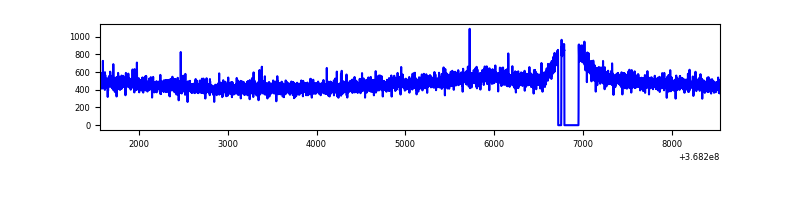 |
| B | 6987 | 6792 | 164 | 164 | 2.35% | 2.41% | 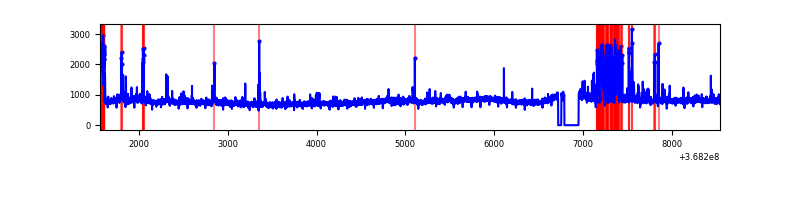 |
| C | 6987 | 6793 | 0 | 0 | 0.00% | 0.00% | 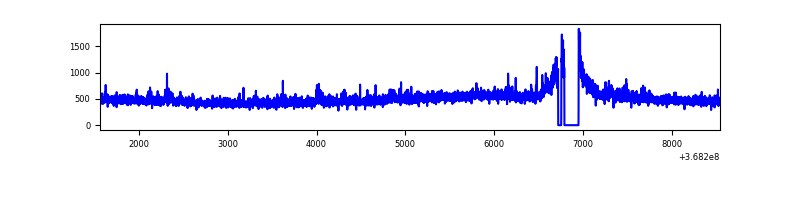 |
| D | 6987 | 6793 | 208 | 208 | 2.98% | 3.06% | 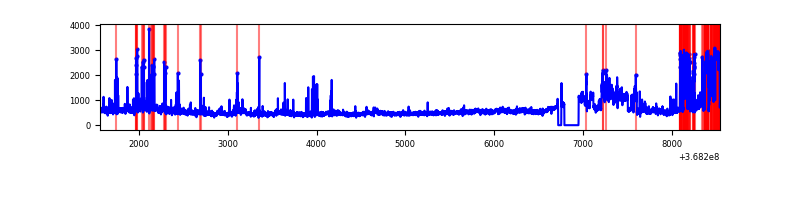 |
Top three noisy pixels from each quadrant. If the there are fewer than three noisy pixels in the level2.evt file, extra rows are filled as -1
| Pixel properties | Quadrant properties | ||||||
|---|---|---|---|---|---|---|---|
| Quadrant | DetID | PixID | Counts | Sigma | Mean | Median | Sigma |
| A | 13 | 254 | 13906 | 77.29 | 834 | 818 | 169.3 |
| A | 13 | 6 | 10870 | 59.36 | 834 | 818 | 169.3 |
| A | 3 | 137 | 8295 | 44.16 | 834 | 818 | 169.3 |
| B | 6 | 159 | 1911096 | 12374.16 | 806 | 785 | 154.4 |
| B | 5 | 172 | 429655 | 2778.03 | 806 | 785 | 154.4 |
| B | 0 | 190 | 70552 | 451.92 | 806 | 785 | 154.4 |
| C | 3 | 233 | 156914 | 841.46 | 790 | 794 | 185.5 |
| C | 14 | 238 | 127541 | 683.14 | 790 | 794 | 185.5 |
| C | 0 | 10 | 46147 | 244.44 | 790 | 794 | 185.5 |
| D | 8 | 195 | 763755 | 3996.96 | 792 | 770 | 190.9 |
| D | 12 | 218 | 552741 | 2891.55 | 792 | 770 | 190.9 |
| D | 12 | 227 | 152972 | 797.32 | 792 | 770 | 190.9 |
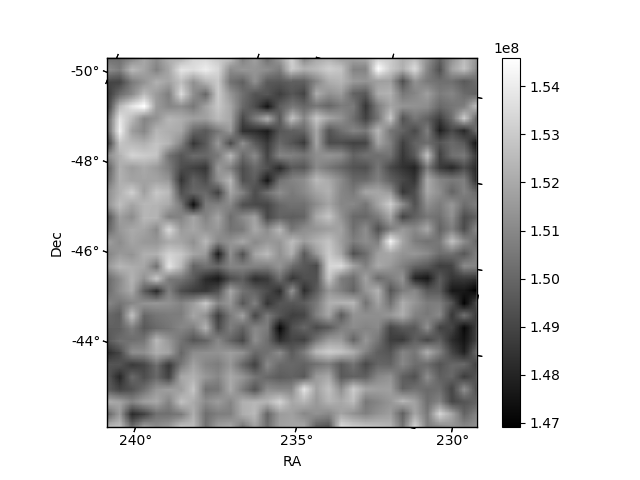
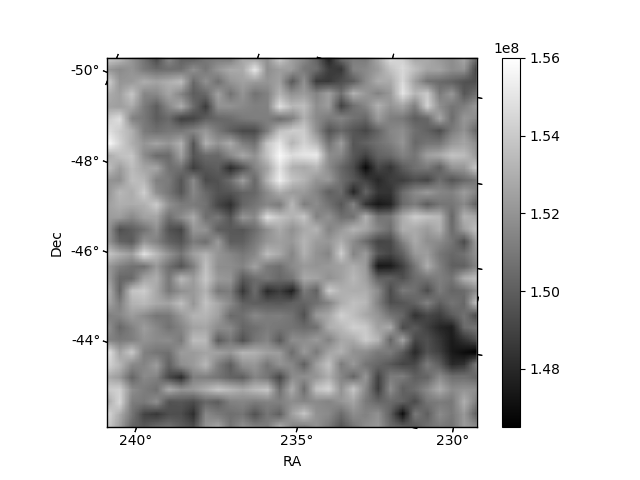
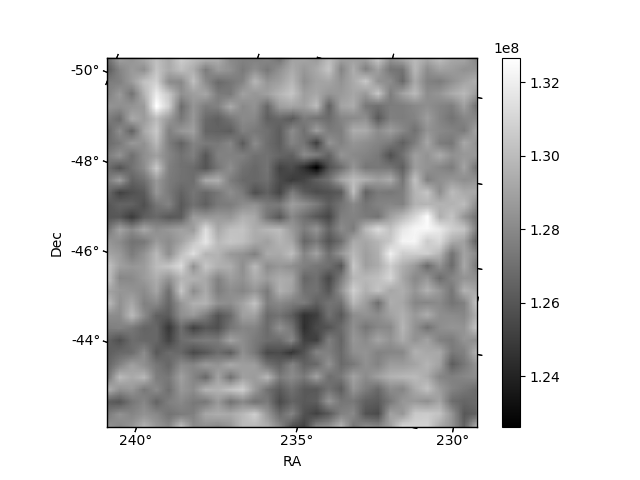
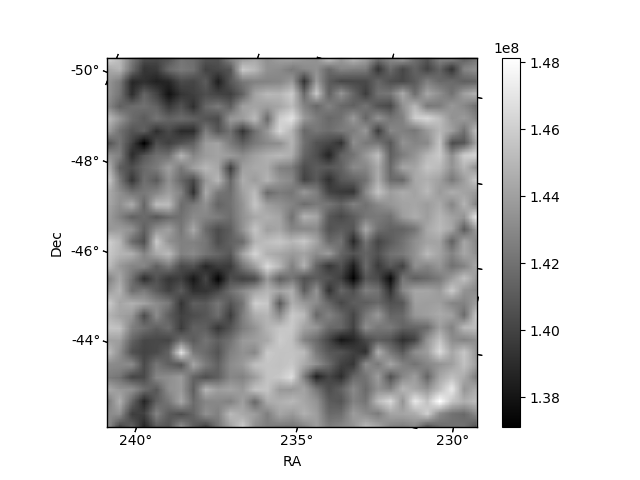
Histogram calculated using DETX and DETY for each event in the final _common_clean file
| Quadrant A | 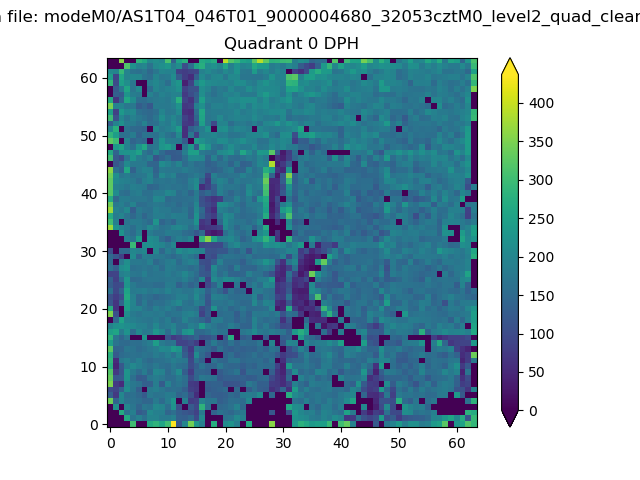 |
 |
Quadrant B |
|---|---|---|---|
| Quadrant D | 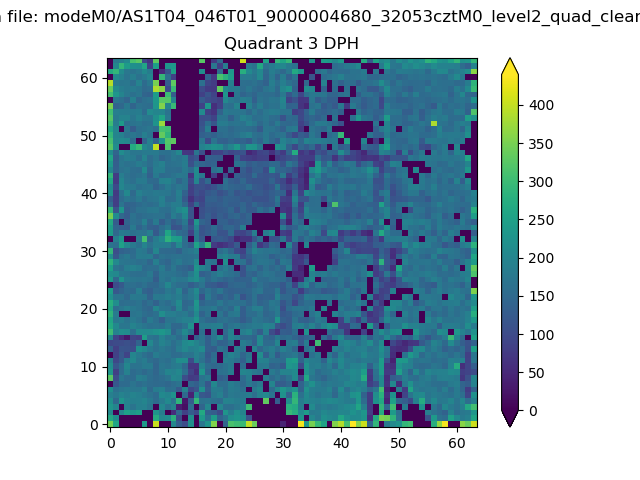 |
 |
Quadrant C |
| Plot type | Count rate plots | Images |
|---|---|---|
| Comparison with Poisson distribution Blue bars denote a histogram of data divided into 1 sec bins. Red curve is a Poisson curve with rate = median count rate of data. |
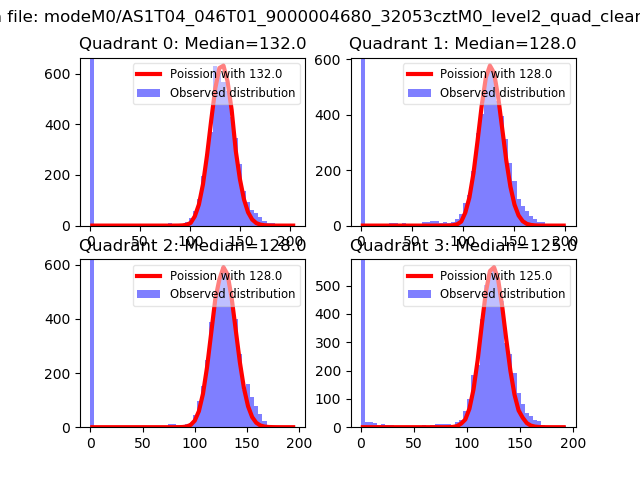 |
 |
| Quadrant-wise count rates Data is divided into 100 sec bins |
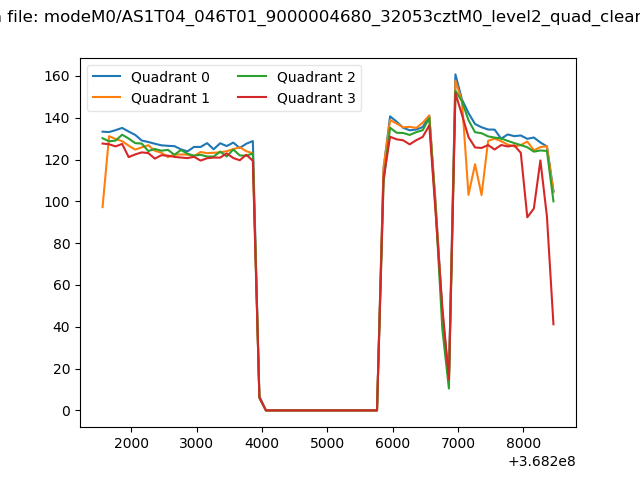 |
|
| Module-wise count rates for Quadrant A Data is divided into 100 sec bins |
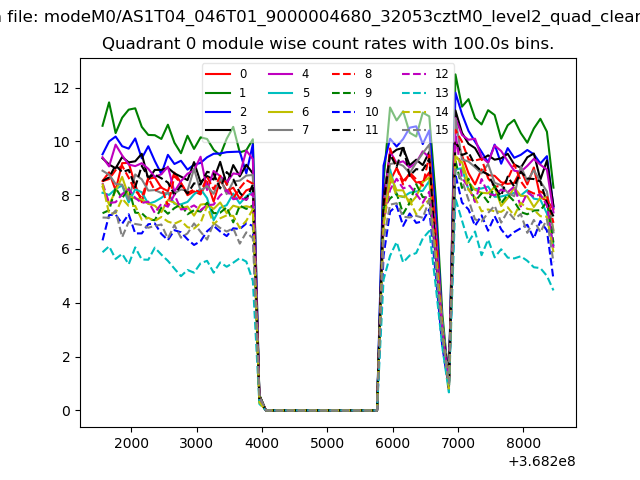 |
 |
| Module-wise count rates for Quadrant B Data is divided into 100 sec bins |
 |
 |
| Module-wise count rates for Quadrant C Data is divided into 100 sec bins |
 |
 |
| Module-wise count rates for Quadrant D Data is divided into 100 sec bins |
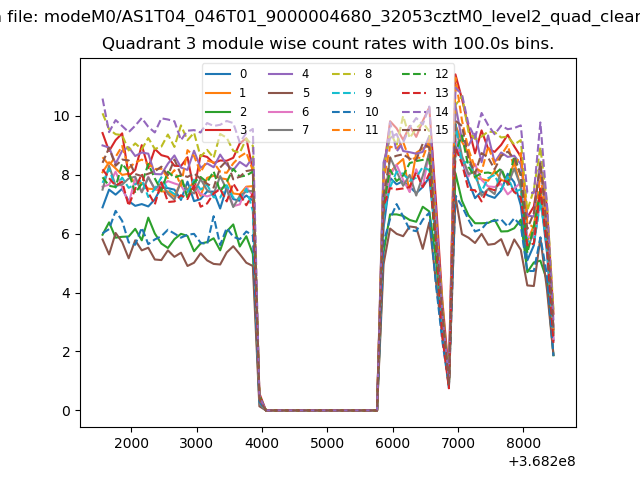 |
 |
| Parameter | Plot |
|---|---|
| CZT HV Monitor | 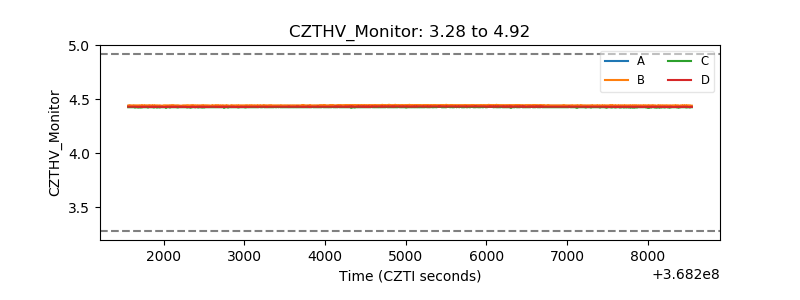 |
| D_VDD | 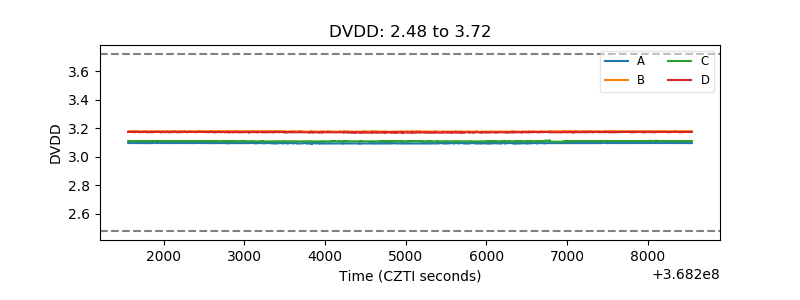 |
| Temperature 1 | 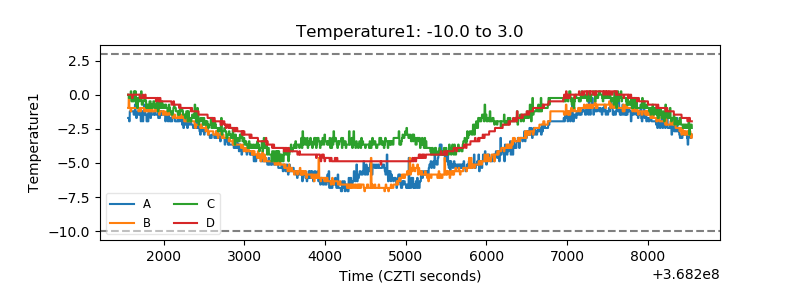 |
| Veto HV Monitor | 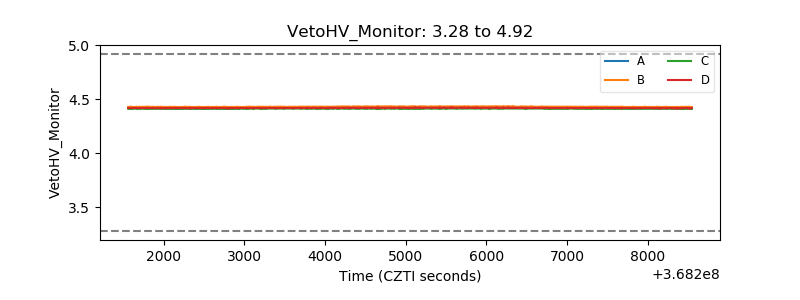 |
| Veto LLD | 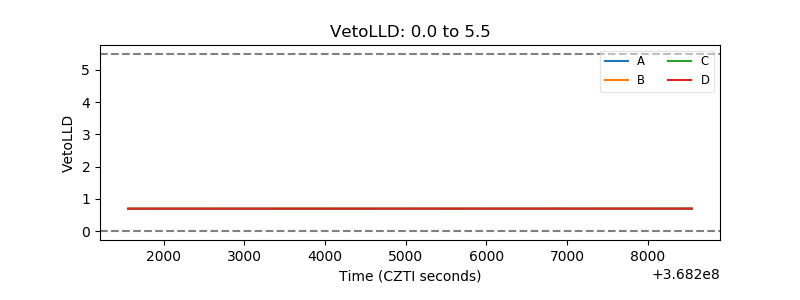 |
| Alpha Counter |  |
| _CPM_Rate | 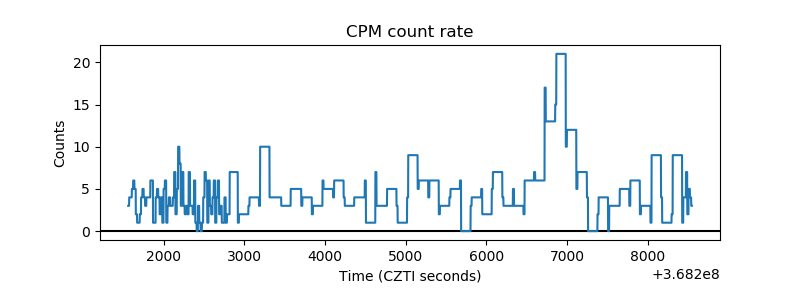 |
| CZT Counter |  |
| +2.5 Volts monitor |  |
| +5 Volts monitor | 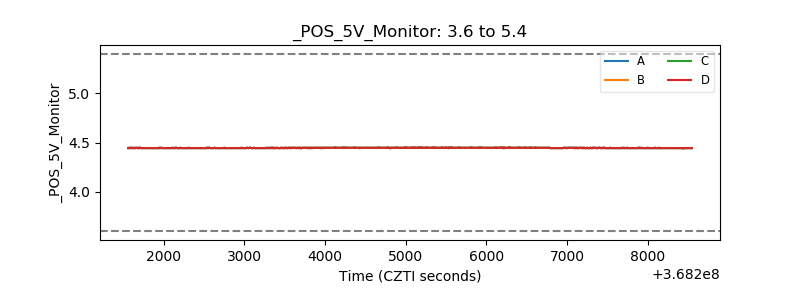 |
| _ROLL_ROT | 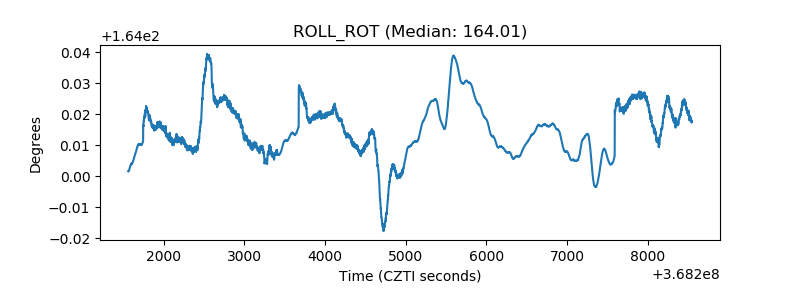 |
| _Roll_DEC | 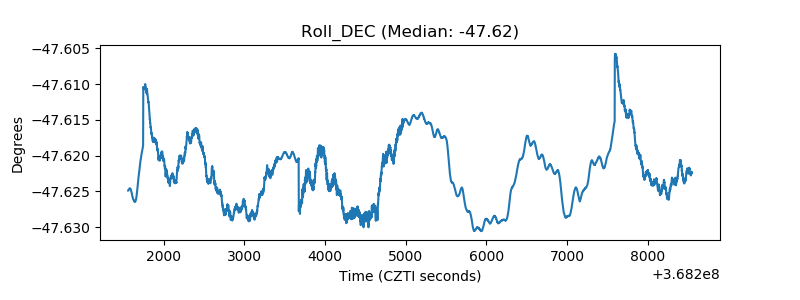 |
| _Roll_RA | 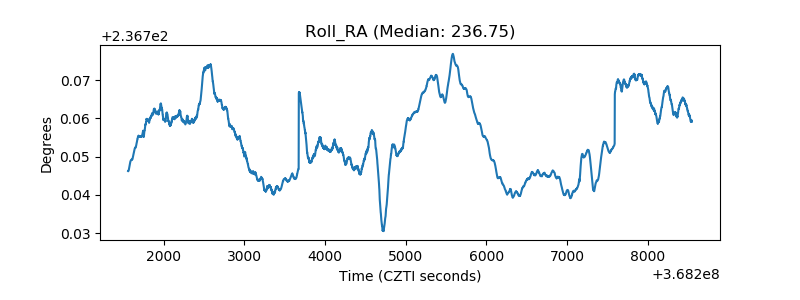 |
| Veto Counter | 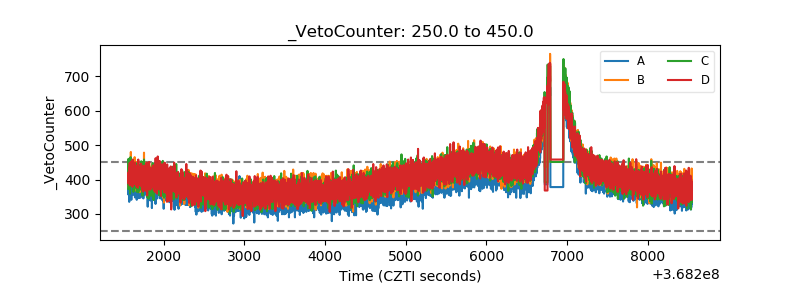 |