| Param | Original file | Final file |
|---|---|---|
| Filename | modeM0/AS1T04_046T01_9000004680_32054cztM0_level2.evt | modeM0/AS1T04_046T01_9000004680_32054cztM0_level2_quad_clean.evt |
| Size (bytes) | 583,453,440 | 97,188,480 |
| Size | 556.4 MB | 92.7 MB |
| Events in quadrant A | 3,168,910 | 639,365 |
| Events in quadrant B | 5,378,042 | 629,559 |
| Events in quadrant C | 3,745,827 | 613,511 |
| Events in quadrant D | 4,915,720 | 586,059 |
| Mode M0 | |||
|---|---|---|---|
| Quadrant | BADHDUFLAG | Total packets | Discarded packets |
| A | 0 | 13901 | 1 |
| B | 0 | 20913 | 1 |
| C | 0 | 15785 | 1 |
| D | 0 | 19109 | 1 |
| Mode M9 | |||
|---|---|---|---|
| Quadrant | BADHDUFLAG | Total packets | Discarded packets |
| A | 0 | 5 | 0 |
| B | 0 | 5 | 0 |
| C | 0 | 5 | 0 |
| D | 0 | 5 | 0 |
| Mode SS | |||
|---|---|---|---|
| Quadrant | BADHDUFLAG | Total packets | Discarded packets |
| A | 0 | 136 | 0 |
| B | 0 | 136 | 0 |
| C | 0 | 136 | 0 |
| D | 0 | 136 | 0 |
| Quadrant | Total seconds | Saturated seconds | Saturation percentage |
|---|---|---|---|
| A | 6818 | 14 | 0.205339% |
| B | 6819 | 82 | 1.202522% |
| C | 6819 | 783 | 11.482622% |
| D | 6819 | 245 | 3.592902% |
Noise dominated data is calculated using 1-second bins in cleaned event files. If a bin has >2000 counts, and if more than 50% of those come from <1% of pixels, then it is considered to be noise-dominated and hence unusable.
| Quadrant | # 1 sec bins | Bins with >0 counts | Bins with >2000 counts | High rate bins dominated by noise | Noise dominated (total time) | Noise dominated (detector-on time) | Marked lightcurve |
|---|---|---|---|---|---|---|---|
| A | 7263 | 6819 | 0 | 0 | 0.00% | 0.00% | 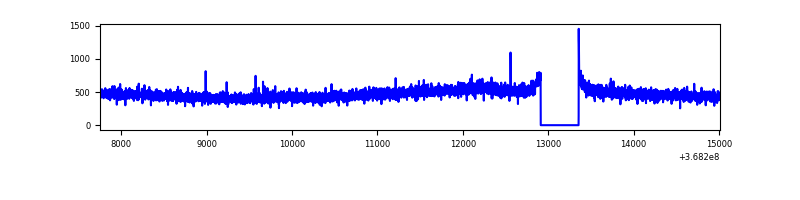 |
| B | 7264 | 6819 | 13 | 13 | 0.18% | 0.19% | 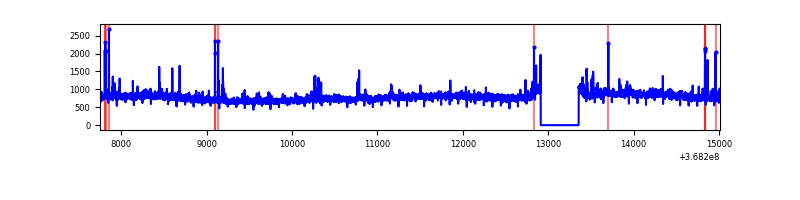 |
| C | 7264 | 6820 | 6 | 6 | 0.08% | 0.09% | 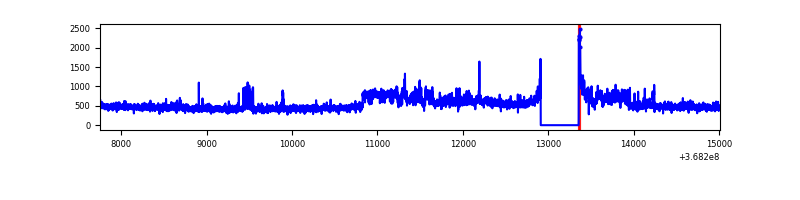 |
| D | 7264 | 6820 | 237 | 237 | 3.26% | 3.48% | 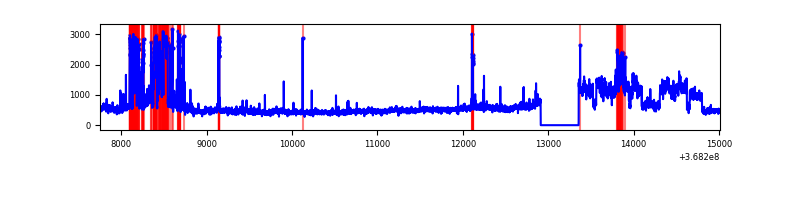 |
Top three noisy pixels from each quadrant. If the there are fewer than three noisy pixels in the level2.evt file, extra rows are filled as -1
| Pixel properties | Quadrant properties | ||||||
|---|---|---|---|---|---|---|---|
| Quadrant | DetID | PixID | Counts | Sigma | Mean | Median | Sigma |
| A | 13 | 254 | 13817 | 78.88 | 817 | 800 | 165.0 |
| A | 13 | 6 | 9889 | 55.08 | 817 | 800 | 165.0 |
| A | 3 | 137 | 8151 | 44.55 | 817 | 800 | 165.0 |
| B | 6 | 159 | 1997731 | 12893.08 | 806 | 786 | 154.9 |
| B | 0 | 190 | 74445 | 475.57 | 806 | 786 | 154.9 |
| B | 10 | 245 | 54235 | 345.09 | 806 | 786 | 154.9 |
| C | 14 | 238 | 341771 | 1964.21 | 735 | 739 | 173.6 |
| C | 14 | 254 | 282802 | 1624.57 | 735 | 739 | 173.6 |
| C | 3 | 233 | 129622 | 742.32 | 735 | 739 | 173.6 |
| D | 8 | 195 | 1186322 | 6400.57 | 770 | 746 | 185.2 |
| D | 12 | 218 | 687063 | 3705.22 | 770 | 746 | 185.2 |
| D | 2 | 250 | 44125 | 234.19 | 770 | 746 | 185.2 |
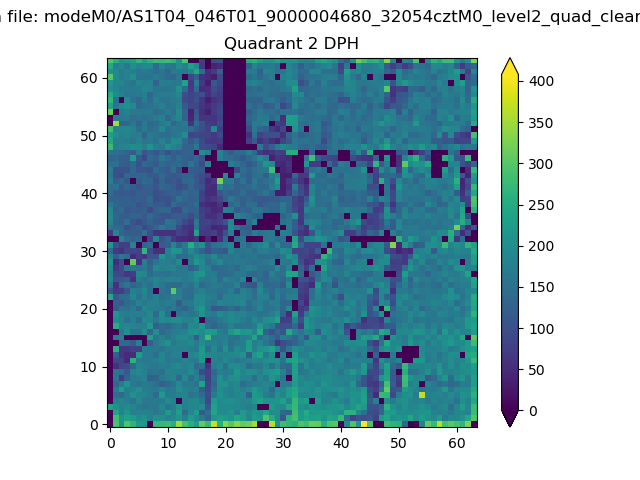
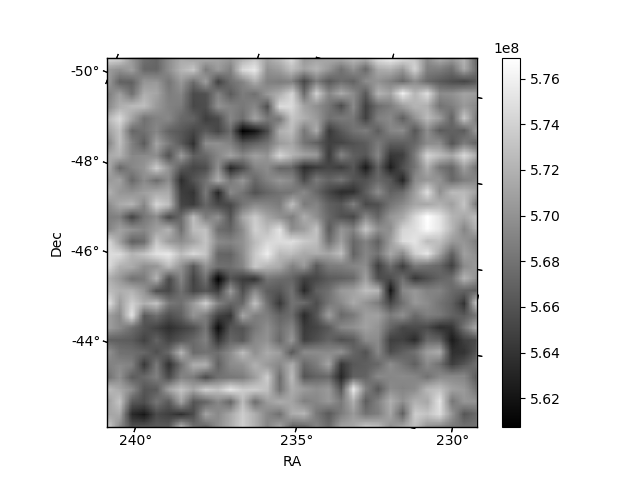
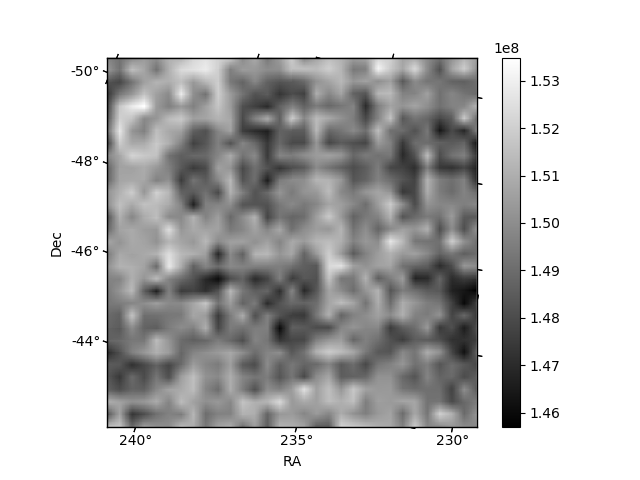
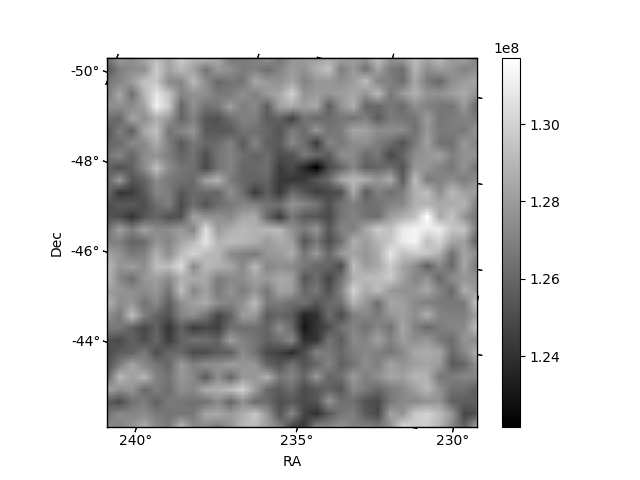
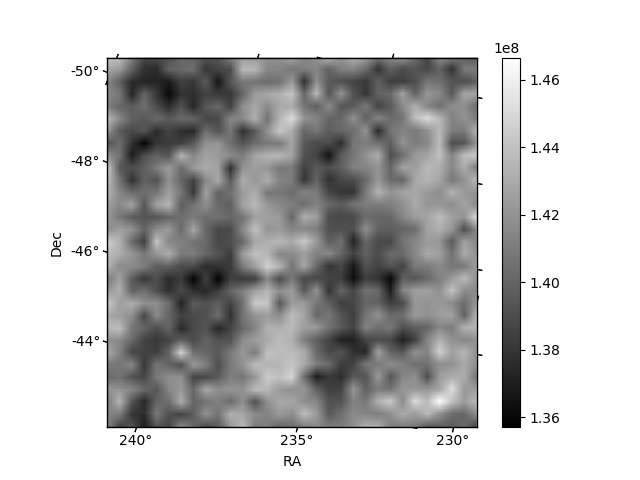
Histogram calculated using DETX and DETY for each event in the final _common_clean file
| Quadrant A | 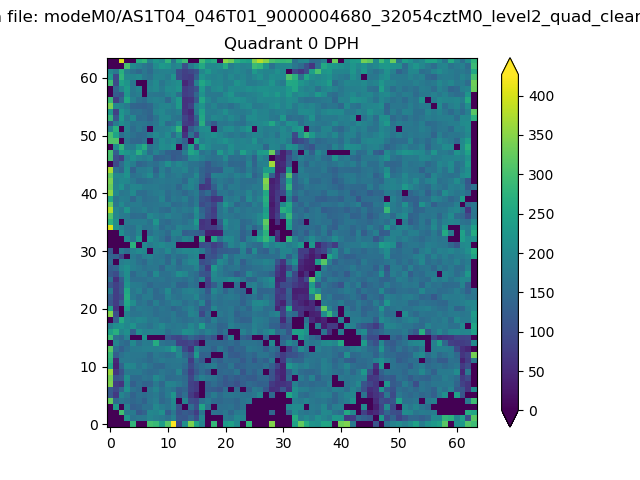 |
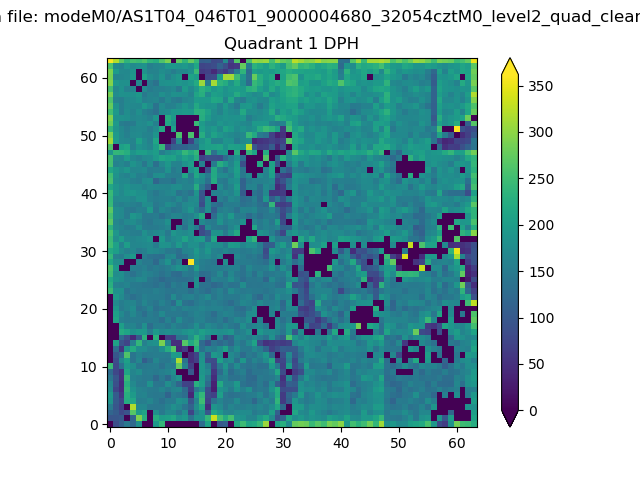 |
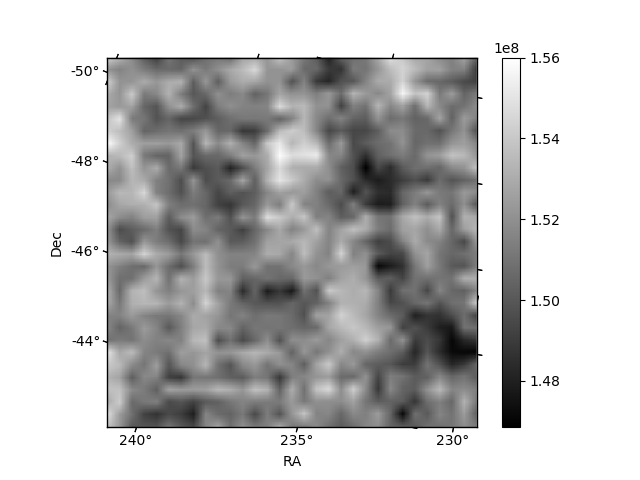
Quadrant B |
|---|---|---|---|
| Quadrant D | 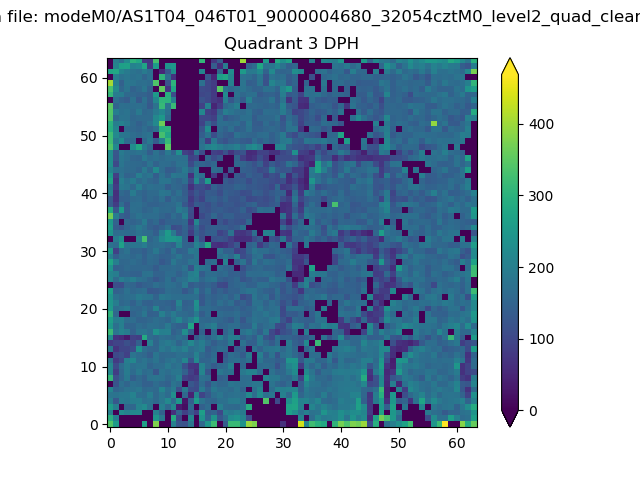 |
 |
Quadrant C |
| Plot type | Count rate plots | Images |
|---|---|---|
| Comparison with Poisson distribution Blue bars denote a histogram of data divided into 1 sec bins. Red curve is a Poisson curve with rate = median count rate of data. |
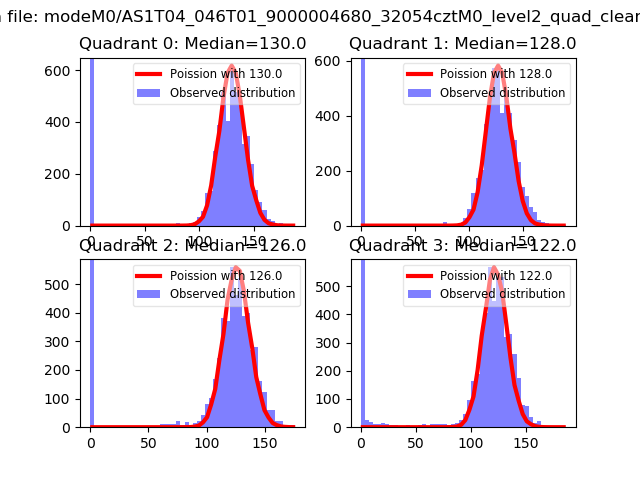 |
 |
| Quadrant-wise count rates Data is divided into 100 sec bins |
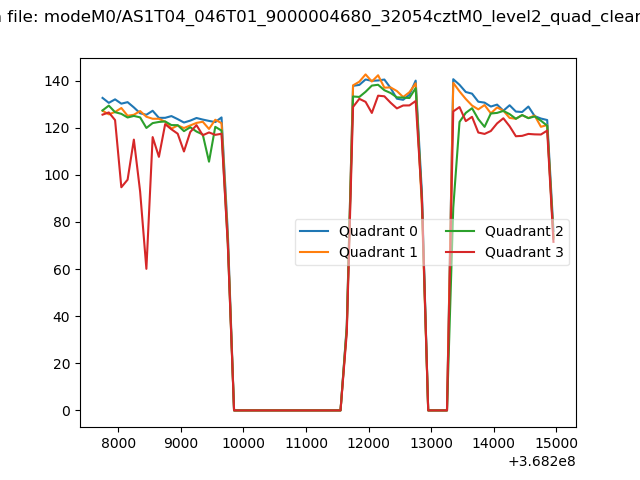 |
|
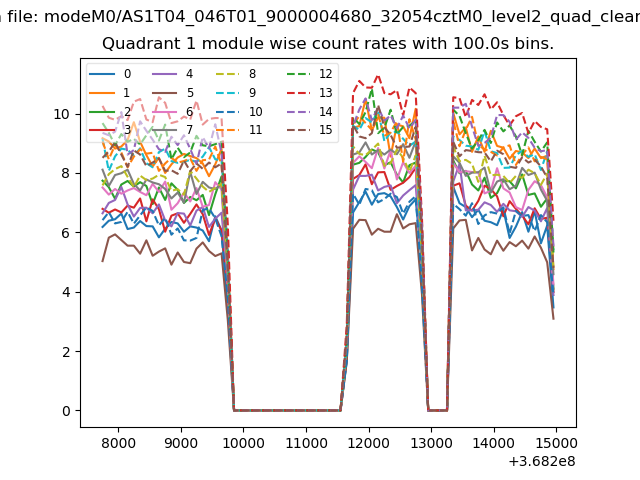
| Module-wise count rates for Quadrant A Data is divided into 100 sec bins |
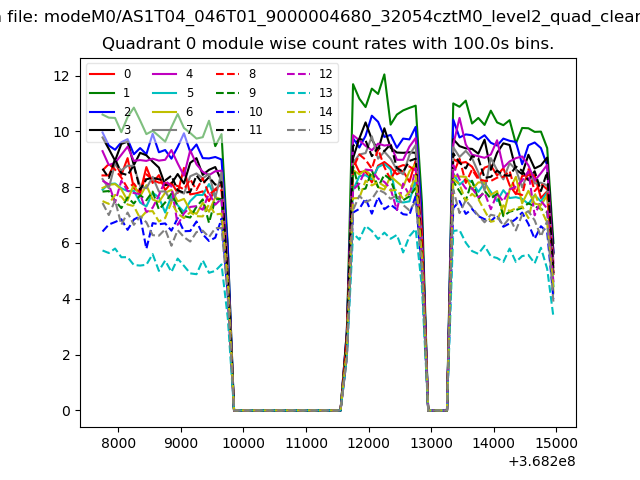 |
 |
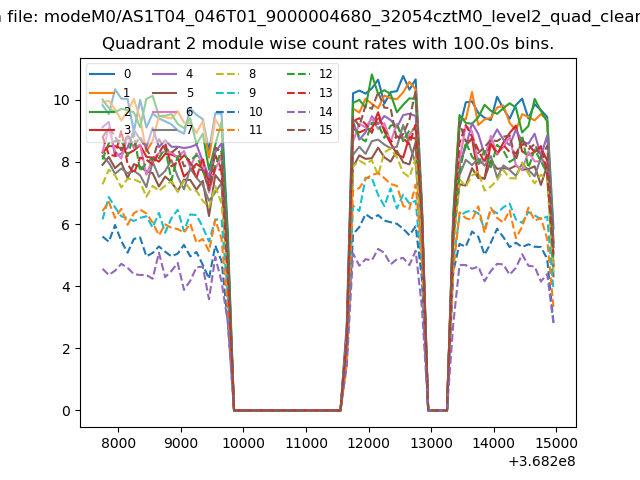
| Module-wise count rates for Quadrant B Data is divided into 100 sec bins |
 |
 |
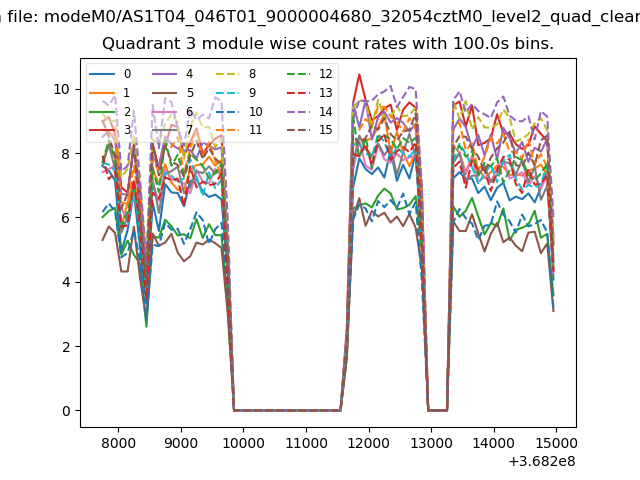
| Module-wise count rates for Quadrant C Data is divided into 100 sec bins |
 |
 |
| Module-wise count rates for Quadrant D Data is divided into 100 sec bins |
 |
 |
| Parameter | Plot |
|---|---|
| CZT HV Monitor | 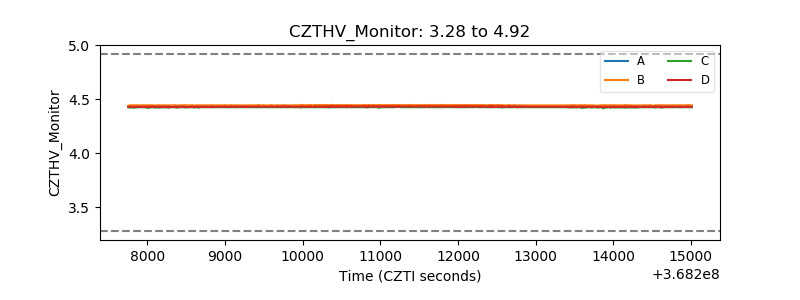 |
| D_VDD | 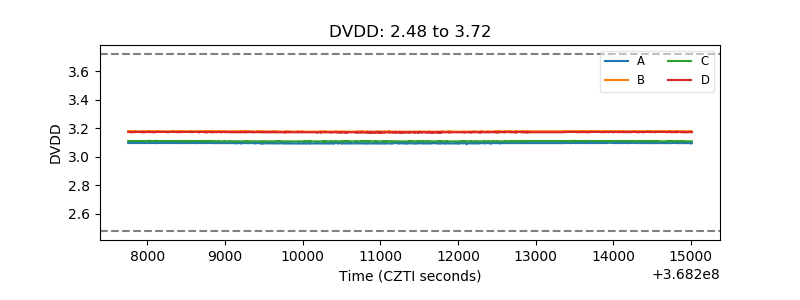 |
| Temperature 1 | 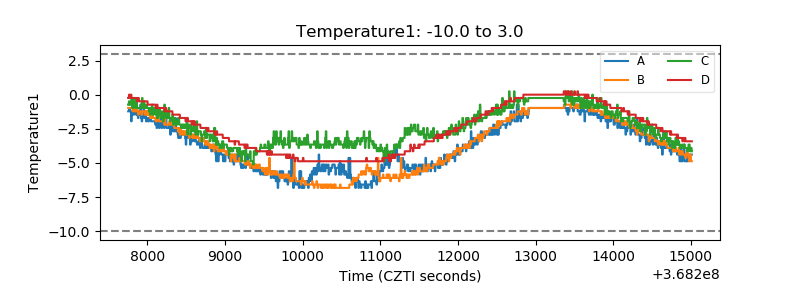 |
| Veto HV Monitor | 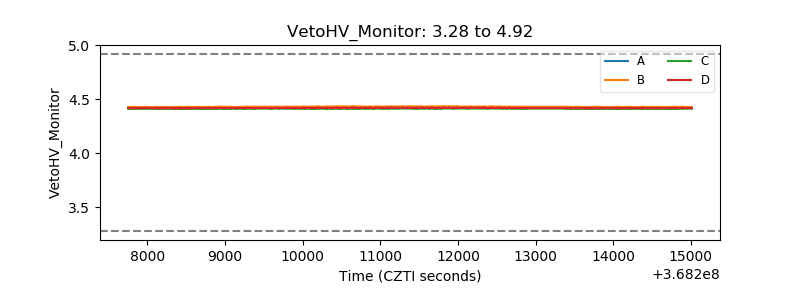 |
| Veto LLD | 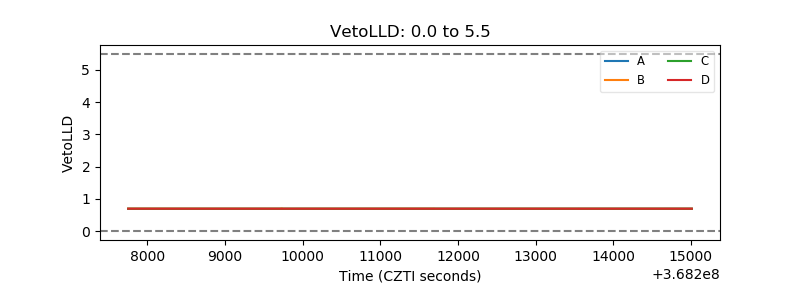 |
| Alpha Counter |  |
| _CPM_Rate | 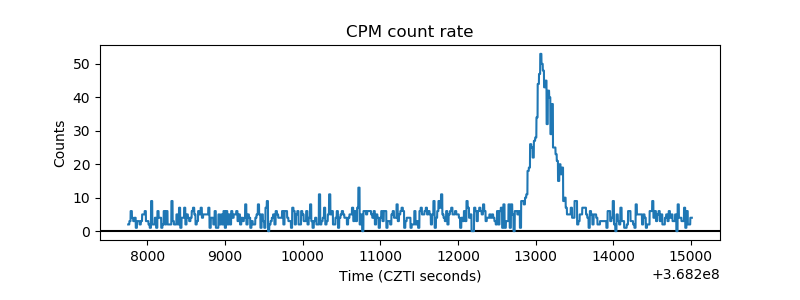 |
| CZT Counter | 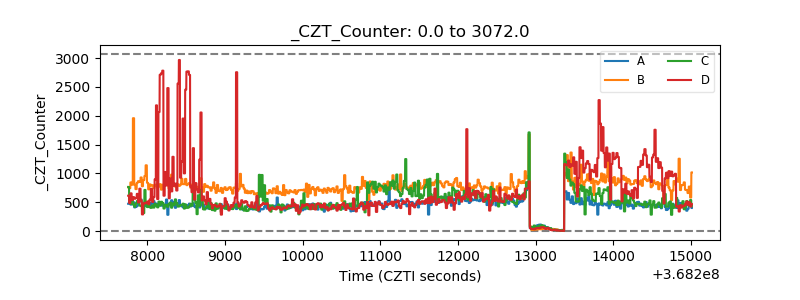 |
| +2.5 Volts monitor |  |
| +5 Volts monitor |  |
| _ROLL_ROT | 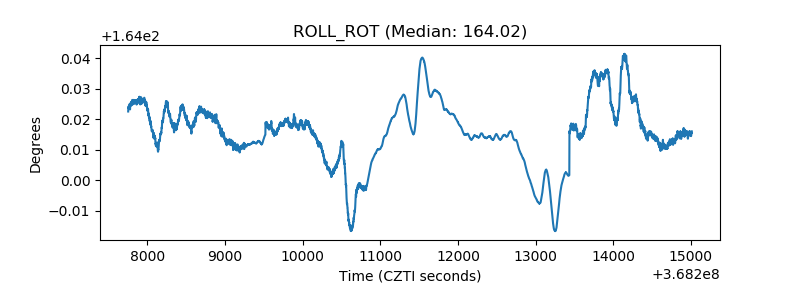 |
| _Roll_DEC | 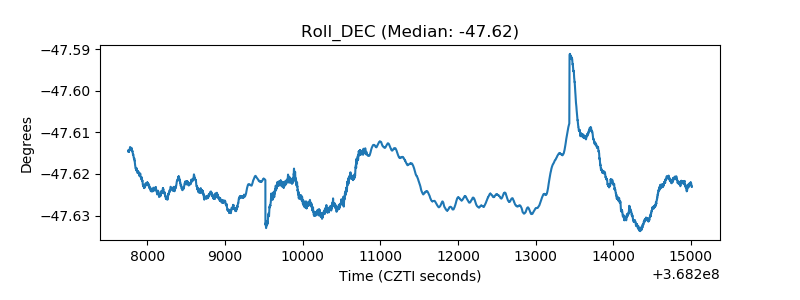 |
| _Roll_RA | 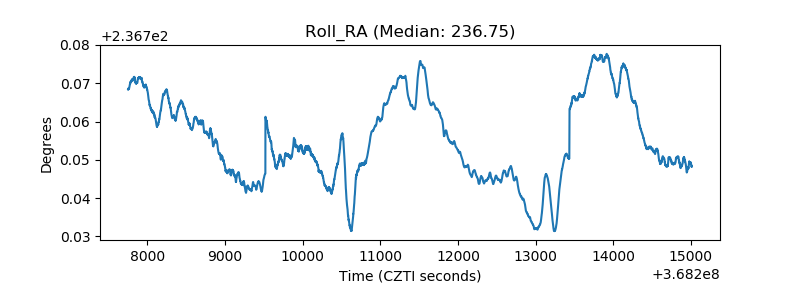 |
| Veto Counter | 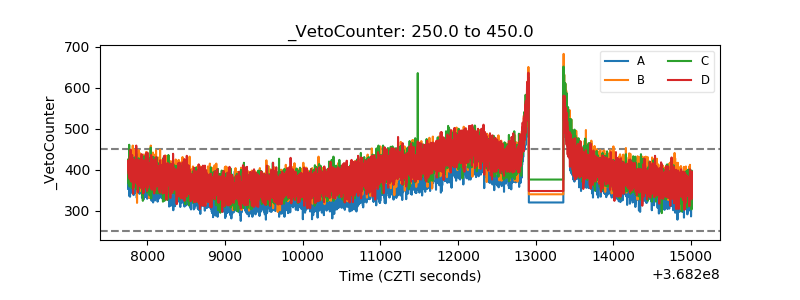 |