| Param | Original file | Final file |
|---|---|---|
| Filename | modeM0/AS1T04_046T01_9000004680_32056cztM0_level2.evt | modeM0/AS1T04_046T01_9000004680_32056cztM0_level2_quad_clean.evt |
| Size (bytes) | 123,238,080 | 27,256,320 |
| Size | 117.5 MB | 26.0 MB |
| Events in quadrant A | 634,315 | 183,320 |
| Events in quadrant B | 1,160,592 | 180,091 |
| Events in quadrant C | 704,285 | 179,643 |
| Events in quadrant D | 1,131,238 | 173,488 |
| Mode M0 | |||
|---|---|---|---|
| Quadrant | BADHDUFLAG | Total packets | Discarded packets |
| A | 0 | 2929 | 0 |
| B | 0 | 4477 | 0 |
| C | 0 | 3040 | 0 |
| D | 0 | 4383 | 0 |
| Mode SS | |||
|---|---|---|---|
| Quadrant | BADHDUFLAG | Total packets | Discarded packets |
| A | 0 | 28 | 0 |
| B | 0 | 28 | 0 |
| C | 0 | 28 | 0 |
| D | 0 | 28 | 0 |
| Quadrant | Total seconds | Saturated seconds | Saturation percentage |
|---|---|---|---|
| A | 1463 | 0 | 0.000000% |
| B | 1463 | 5 | 0.341763% |
| C | 1463 | 3 | 0.205058% |
| D | 1464 | 2 | 0.136612% |
Noise dominated data is calculated using 1-second bins in cleaned event files. If a bin has >2000 counts, and if more than 50% of those come from <1% of pixels, then it is considered to be noise-dominated and hence unusable.
| Quadrant | # 1 sec bins | Bins with >0 counts | Bins with >2000 counts | High rate bins dominated by noise | Noise dominated (total time) | Noise dominated (detector-on time) | Marked lightcurve |
|---|---|---|---|---|---|---|---|
| A | 1463 | 1463 | 0 | 0 | 0.00% | 0.00% | 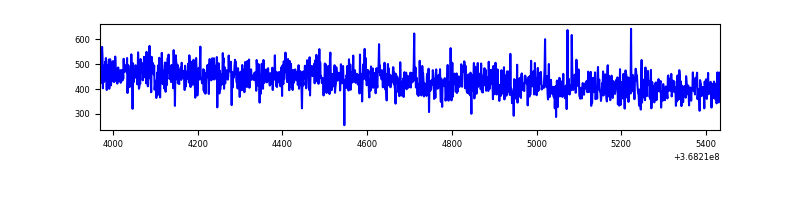 |
| B | 1463 | 1463 | 4 | 4 | 0.27% | 0.27% | 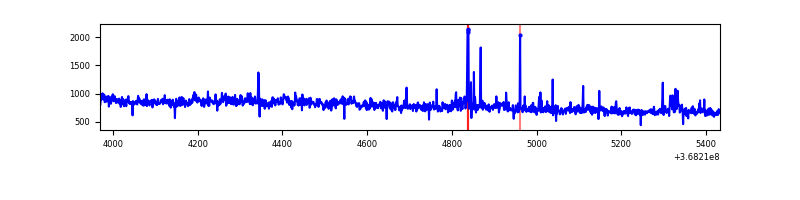 |
| C | 1463 | 1463 | 2 | 2 | 0.14% | 0.14% | 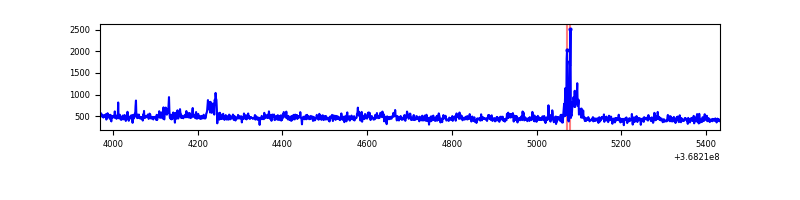 |
| D | 1464 | 1464 | 1 | 1 | 0.07% | 0.07% | 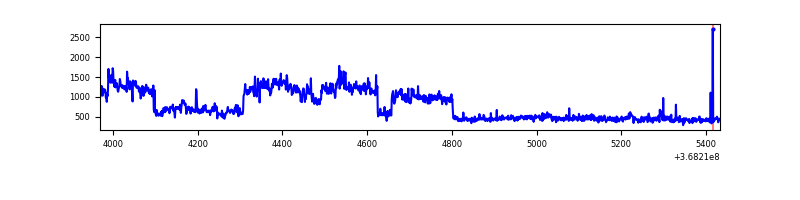 |
Top three noisy pixels from each quadrant. If the there are fewer than three noisy pixels in the level2.evt file, extra rows are filled as -1
| Pixel properties | Quadrant properties | ||||||
|---|---|---|---|---|---|---|---|
| Quadrant | DetID | PixID | Counts | Sigma | Mean | Median | Sigma |
| A | 13 | 254 | 3136 | 86.48 | 163 | 160 | 34.4 |
| A | 13 | 6 | 2424 | 65.79 | 163 | 160 | 34.4 |
| A | 3 | 137 | 1536 | 39.98 | 163 | 160 | 34.4 |
| B | 6 | 159 | 456456 | 13551.11 | 162 | 158 | 33.7 |
| B | 10 | 245 | 29453 | 870.0 | 162 | 158 | 33.7 |
| B | 0 | 190 | 14171 | 416.16 | 162 | 158 | 33.7 |
| C | 3 | 233 | 36728 | 956.06 | 153 | 155 | 38.3 |
| C | 14 | 238 | 25767 | 669.53 | 153 | 155 | 38.3 |
| C | 14 | 225 | 21990 | 570.79 | 153 | 155 | 38.3 |
| D | 8 | 195 | 528201 | 13520.38 | 154 | 149 | 39.1 |
| D | 2 | 234 | 8896 | 223.96 | 154 | 149 | 39.1 |
| D | 2 | 250 | 6406 | 160.21 | 154 | 149 | 39.1 |
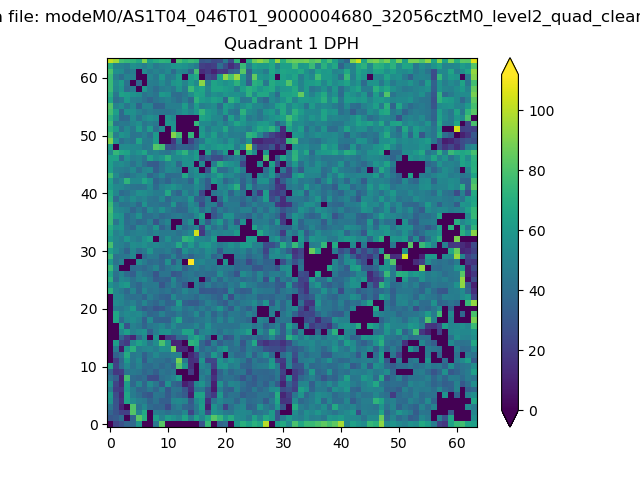
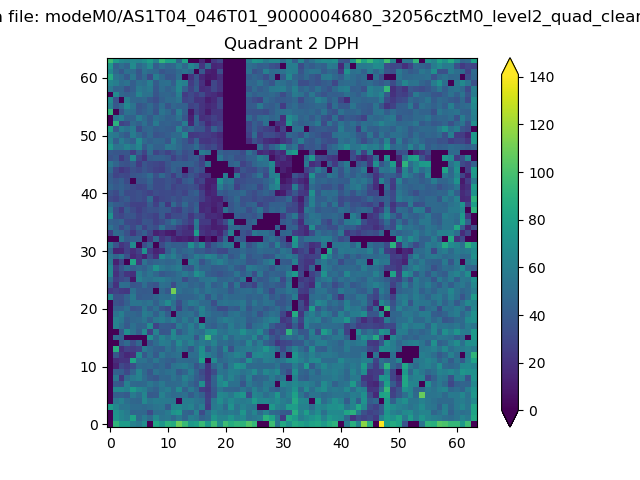
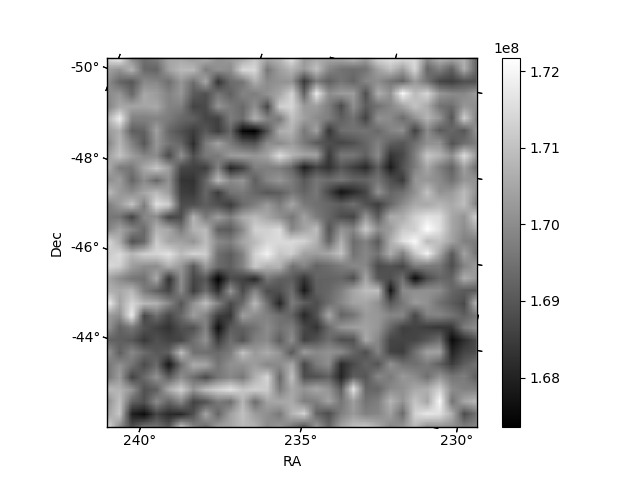
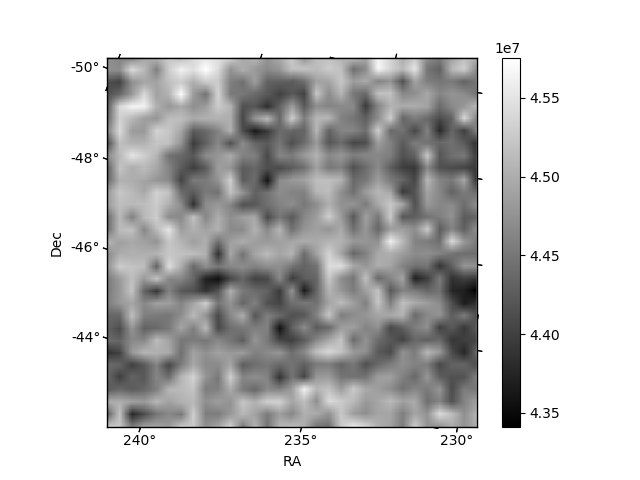
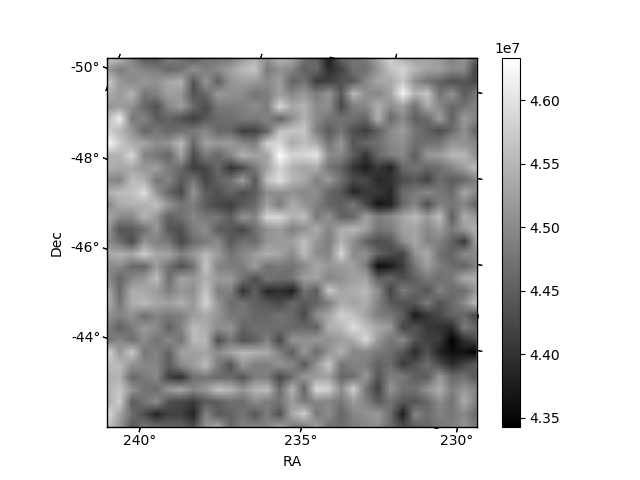
Histogram calculated using DETX and DETY for each event in the final _common_clean file
| Quadrant A |  |
 |
Quadrant B |
|---|---|---|---|
| Quadrant D | 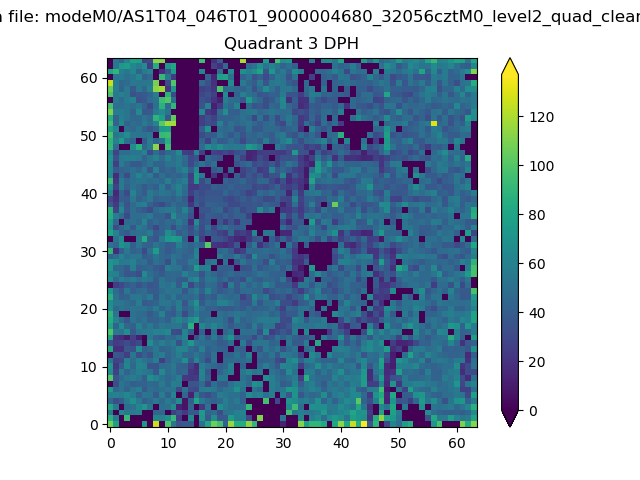 |
 |
Quadrant C |
| Plot type | Count rate plots | Images |
|---|---|---|
| Comparison with Poisson distribution Blue bars denote a histogram of data divided into 1 sec bins. Red curve is a Poisson curve with rate = median count rate of data. |
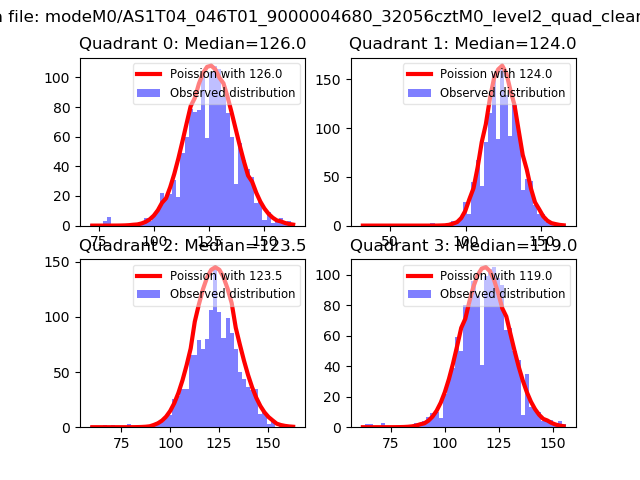 |
 |
| Quadrant-wise count rates Data is divided into 100 sec bins |
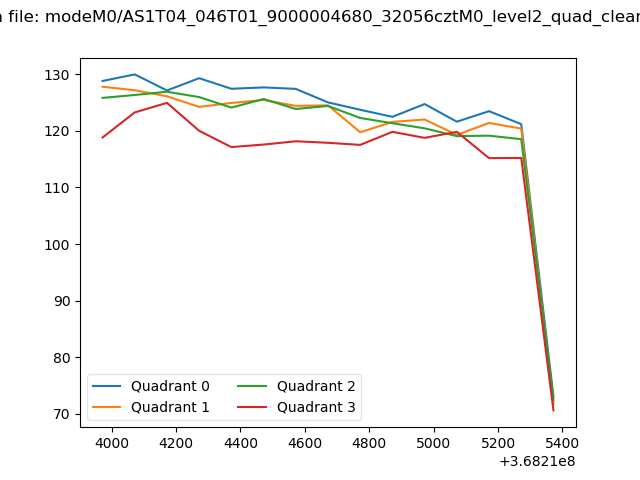 |
|
| Module-wise count rates for Quadrant A Data is divided into 100 sec bins |
 |
 |
| Module-wise count rates for Quadrant B Data is divided into 100 sec bins |
 |
 |
| Module-wise count rates for Quadrant C Data is divided into 100 sec bins |
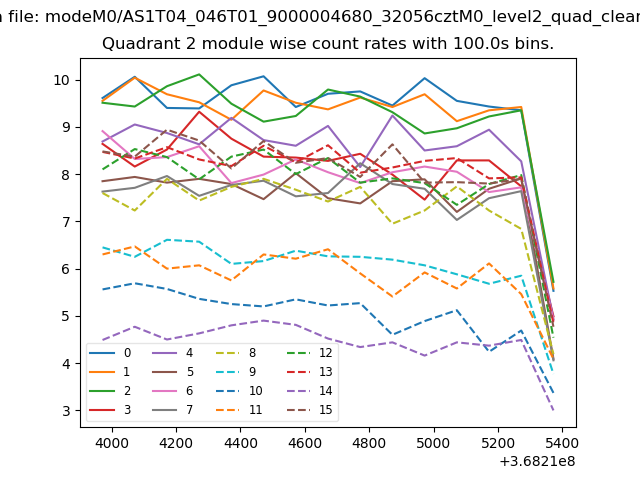 |
 |
| Module-wise count rates for Quadrant D Data is divided into 100 sec bins |
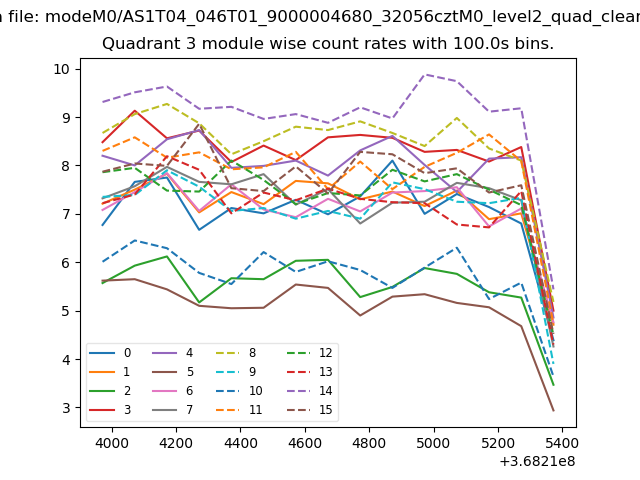 |
 |
| Parameter | Plot |
|---|---|
| CZT HV Monitor |  |
| D_VDD | 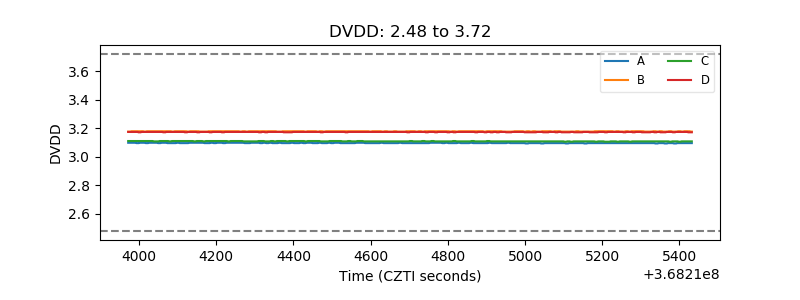 |
| Temperature 1 | 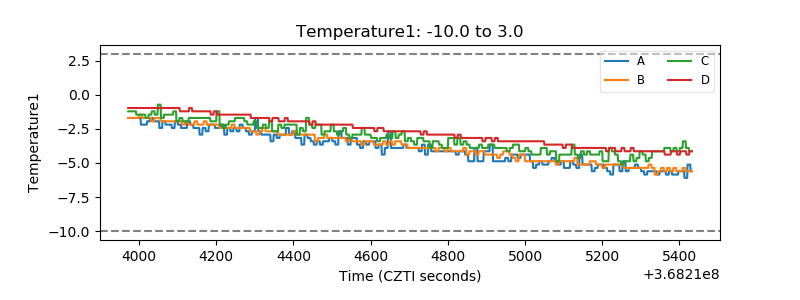 |
| Veto HV Monitor | 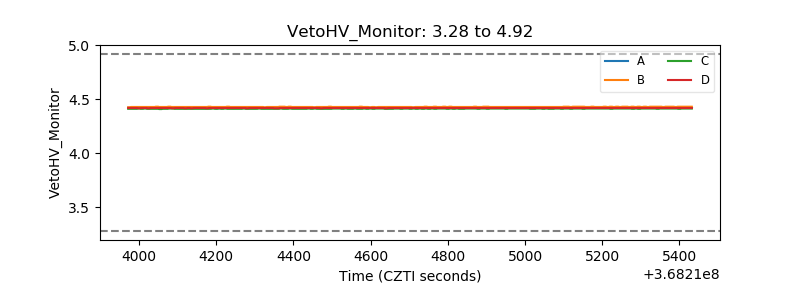 |
| Veto LLD | 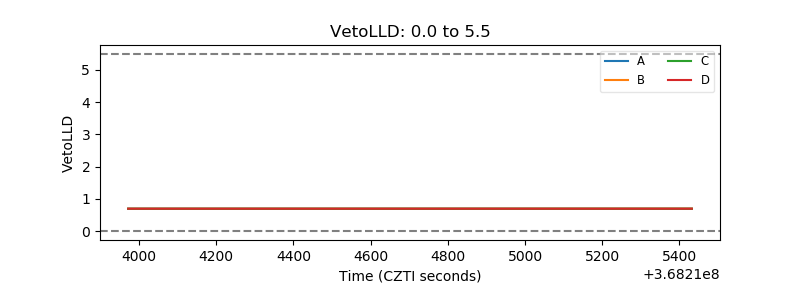 |
| Alpha Counter | 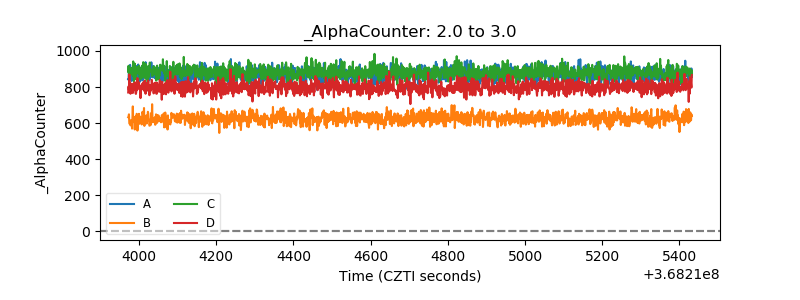 |
| _CPM_Rate | 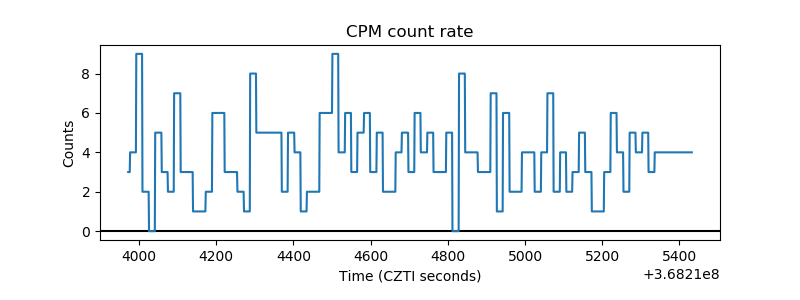 |
| CZT Counter | 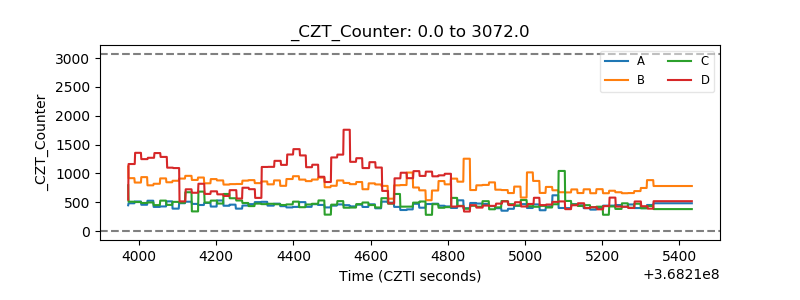 |
| +2.5 Volts monitor |  |
| +5 Volts monitor |  |
| _ROLL_ROT | 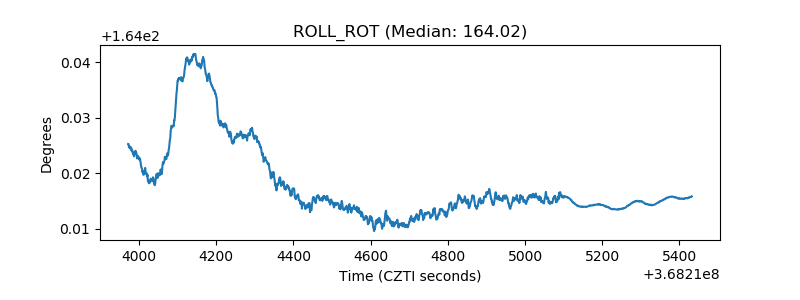 |
| _Roll_DEC | 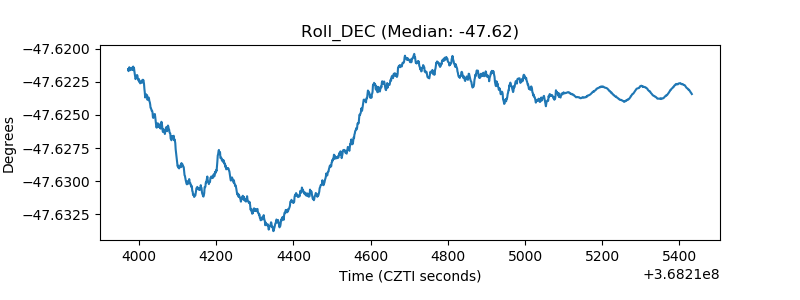 |
| _Roll_RA | 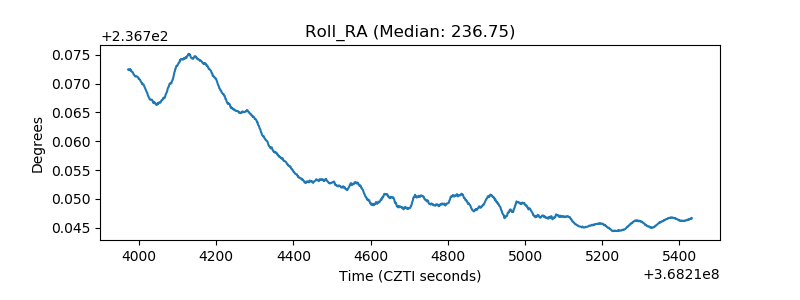 |
| Veto Counter | 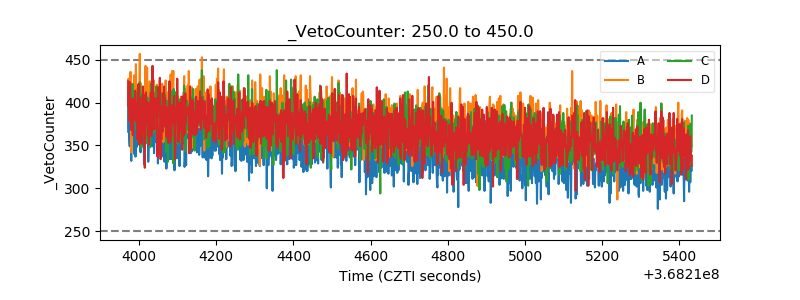 |