| Param | Original file | Final file |
|---|---|---|
| Filename | modeM0/AS1A10_109T01_9000004682cztM0_level2.fits | modeM0/AS1A10_109T01_9000004682cztM0_level2_quad_clean.evt |
| Size (bytes) | 951,969,600 | 814,832,640 |
| Size | 907.9 MB | 777.1 MB |
| Events in quadrant A | 6,078,540 | 4,969,713 |
| Events in quadrant B | 5,591,284 | 4,639,966 |
| Events in quadrant C | 5,630,744 | 4,503,067 |
| Events in quadrant D | 5,052,058 | 4,089,381 |
| Mode M9 | |||
|---|---|---|---|
| Quadrant | BADHDUFLAG | Total packets | Discarded packets |
| A | 0 | 156 | 0 |
| B | 0 | 156 | 0 |
| C | 0 | 156 | 0 |
| D | 0 | 156 | 0 |
| Mode M0 | |||
|---|---|---|---|
| Quadrant | BADHDUFLAG | Total packets | Discarded packets |
| A | 0 | 198830 | 0 |
| B | 0 | 315711 | 0 |
| C | 0 | 228395 | 0 |
| D | 0 | 280654 | 0 |
| Mode SS | |||
|---|---|---|---|
| Quadrant | BADHDUFLAG | Total packets | Discarded packets |
| A | 0 | 1918 | 0 |
| B | 0 | 1918 | 0 |
| C | 0 | 1918 | 0 |
| D | 0 | 1918 | 0 |
| Quadrant | Total seconds | Saturated seconds | Saturation percentage |
|---|---|---|---|
| A | 94436 | 1064 | 1.126689% |
| B | 94438 | 5626 | 5.957348% |
| C | 94438 | 6171 | 6.534446% |
| D | 94438 | 4010 | 4.246172% |
Noise dominated data is calculated using 1-second bins in cleaned event files. If a bin has >2000 counts, and if more than 50% of those come from <1% of pixels, then it is considered to be noise-dominated and hence unusable.
| Quadrant | # 1 sec bins | Bins with >0 counts | Bins with >2000 counts | High rate bins dominated by noise | Noise dominated (total time) | Noise dominated (detector-on time) | Marked lightcurve |
|---|---|---|---|---|---|---|---|
| A | 109999 | 94424 | 0 | 0 | 0.00% | 0.00% | 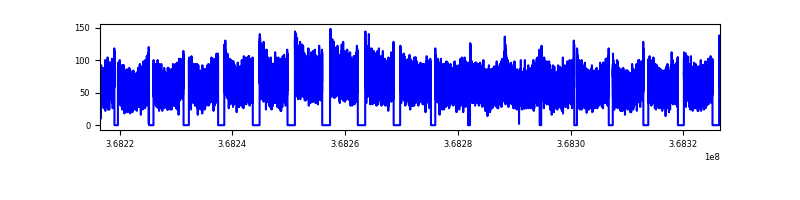 |
| B | 109999 | 94416 | 0 | 0 | 0.00% | 0.00% | 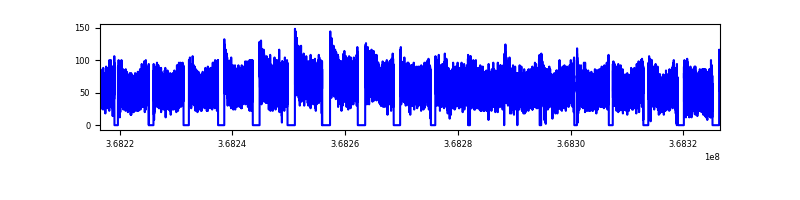 |
| C | 109999 | 94285 | 0 | 0 | 0.00% | 0.00% | 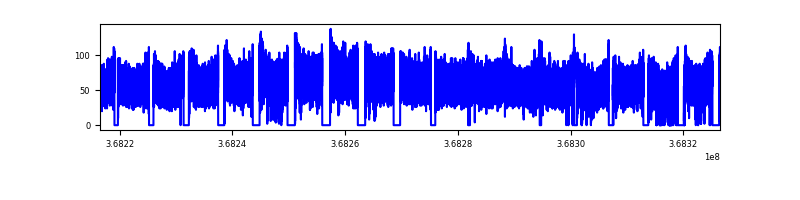 |
| D | 109999 | 94418 | 0 | 0 | 0.00% | 0.00% | 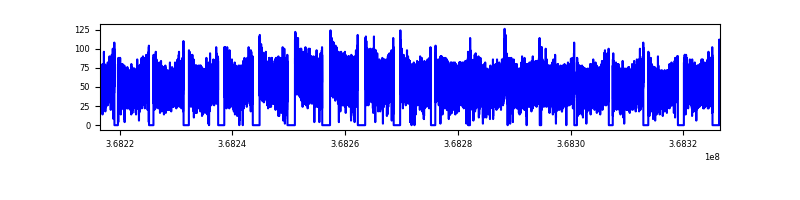 |
Top three noisy pixels from each quadrant. If the there are fewer than three noisy pixels in the level2.evt file, extra rows are filled as -1
| Pixel properties | Quadrant properties | ||||||
|---|---|---|---|---|---|---|---|
| Quadrant | DetID | PixID | Counts | Sigma | Mean | Median | Sigma |
| A | 0 | 29 | 5976 | 11.57 | 1583 | 1493 | 387.4 |
| A | 0 | 30 | 4857 | 8.68 | 1583 | 1493 | 387.4 |
| A | 7 | 110 | 4846 | 8.66 | 1583 | 1493 | 387.4 |
| B | 2 | 9 | 4436 | 10.5 | 1476 | 1412 | 288.0 |
| B | 3 | 80 | 3648 | 7.76 | 1476 | 1412 | 288.0 |
| B | 5 | 232 | 3616 | 7.65 | 1476 | 1412 | 288.0 |
| C | 12 | 241 | 3878 | 6.61 | 1491 | 1400 | 374.5 |
| C | 3 | 126 | 3794 | 6.39 | 1491 | 1400 | 374.5 |
| C | 3 | 187 | 3759 | 6.3 | 1491 | 1400 | 374.5 |
| D | 4 | 246 | 3991 | 7.01 | 1437 | 1309 | 382.6 |
| D | 10 | 189 | 3660 | 6.15 | 1437 | 1309 | 382.6 |
| D | 15 | 47 | 3635 | 6.08 | 1437 | 1309 | 382.6 |
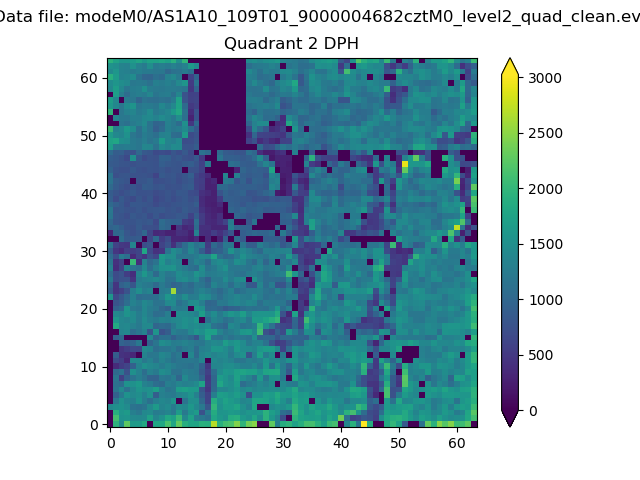
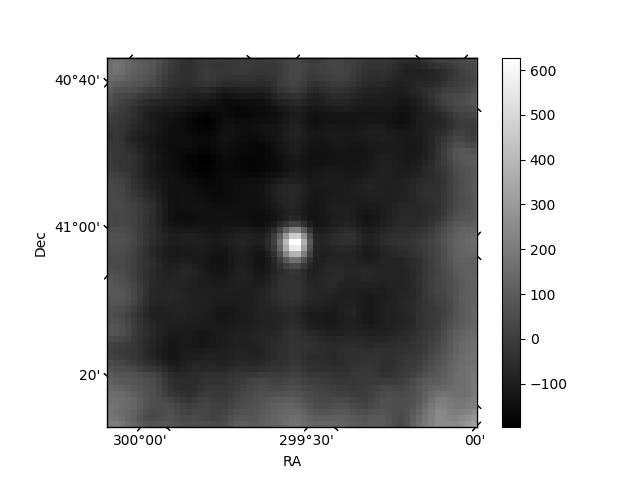
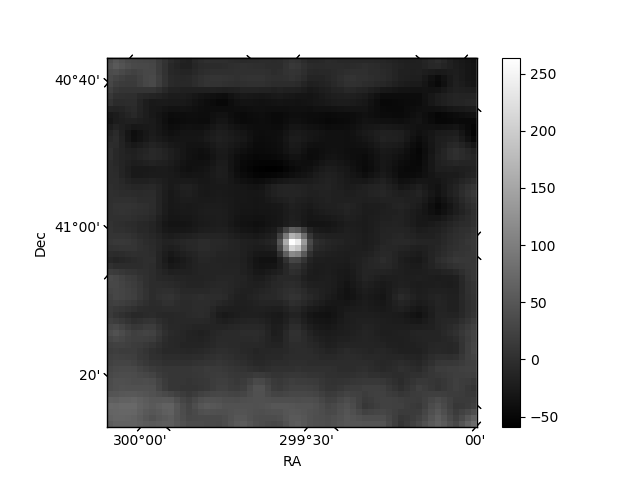
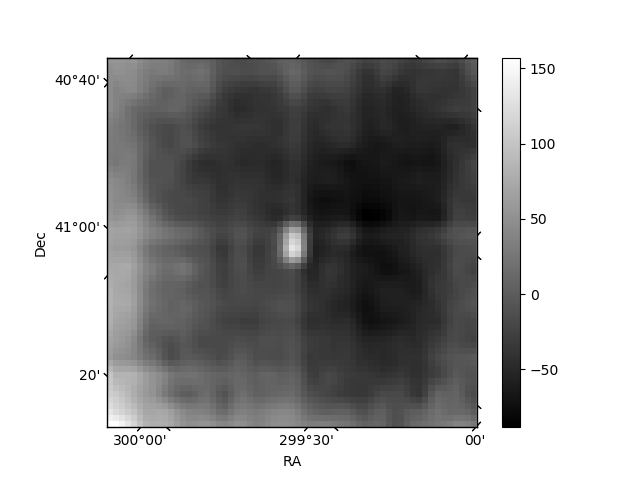
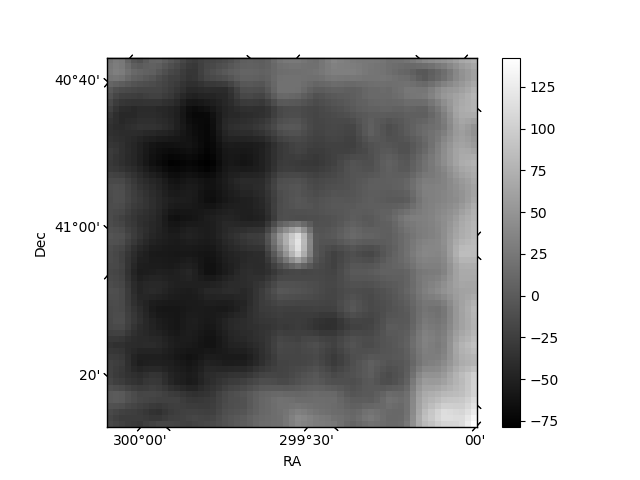
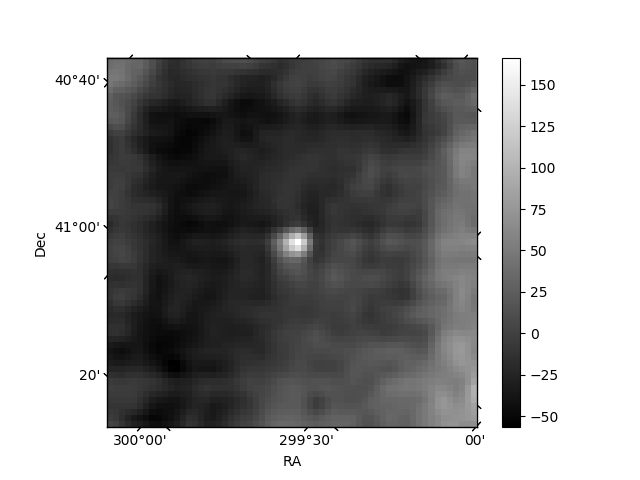
Histogram calculated using DETX and DETY for each event in the final _common_clean file
| Quadrant A | 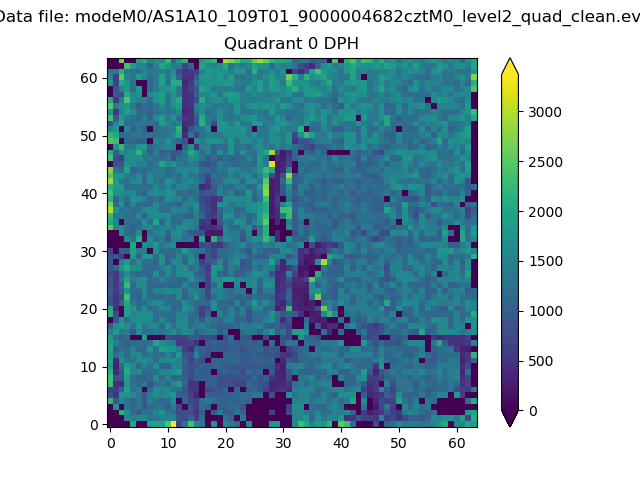 |
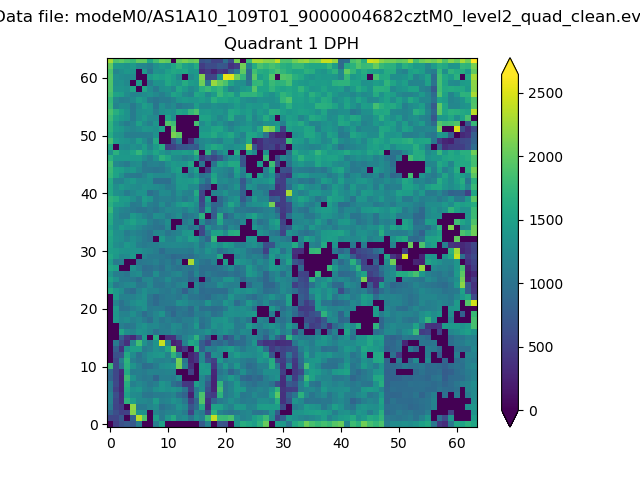 |
Quadrant B |
|---|---|---|---|
| Quadrant D | 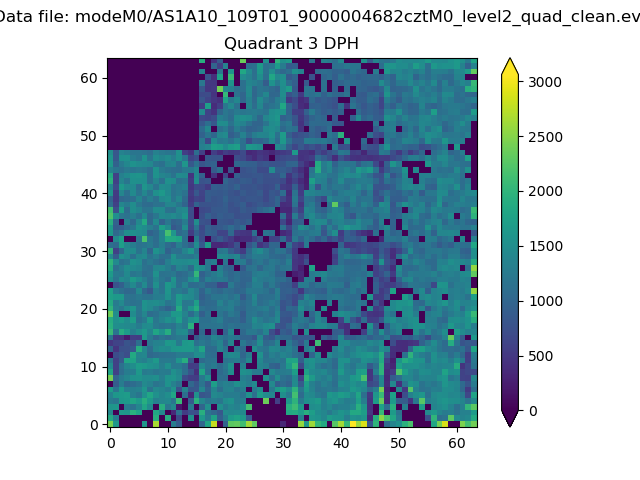 |
 |
Quadrant C |
| Plot type | Count rate plots | Images |
|---|---|---|
| Comparison with Poisson distribution Blue bars denote a histogram of data divided into 1 sec bins. Red curve is a Poisson curve with rate = median count rate of data. |
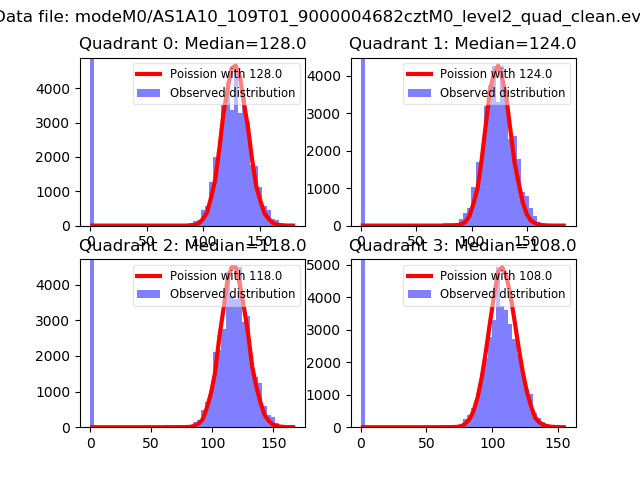 |
 |
| Quadrant-wise count rates Data is divided into 100 sec bins |
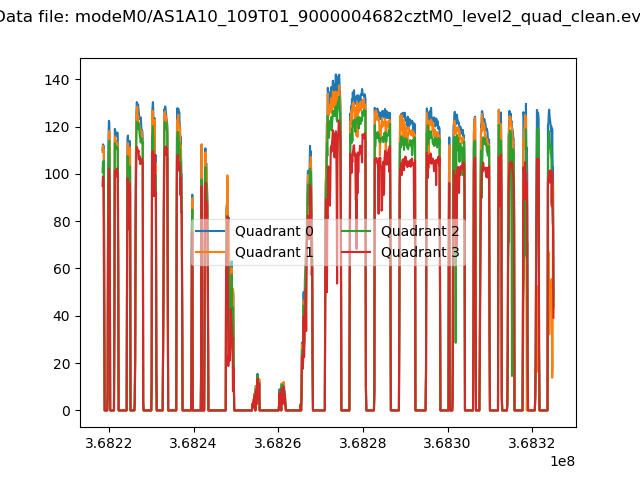 |
|
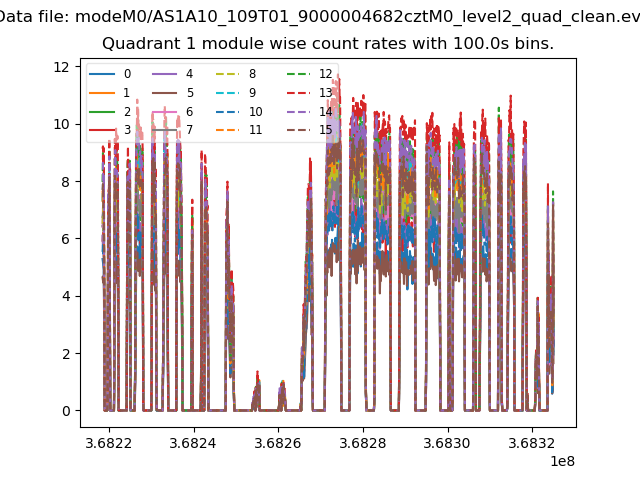
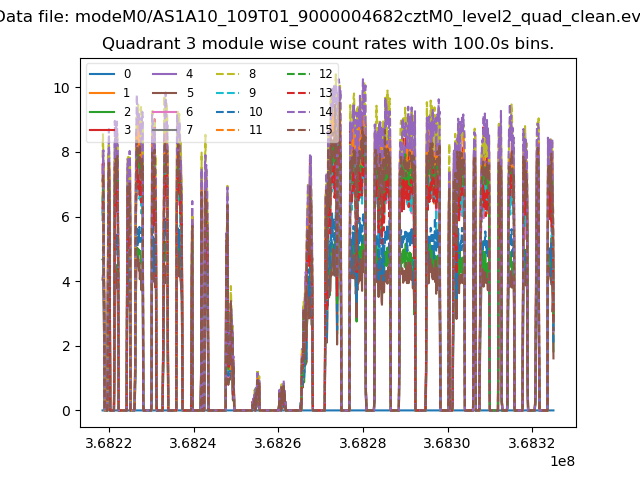
| Module-wise count rates for Quadrant A Data is divided into 100 sec bins |
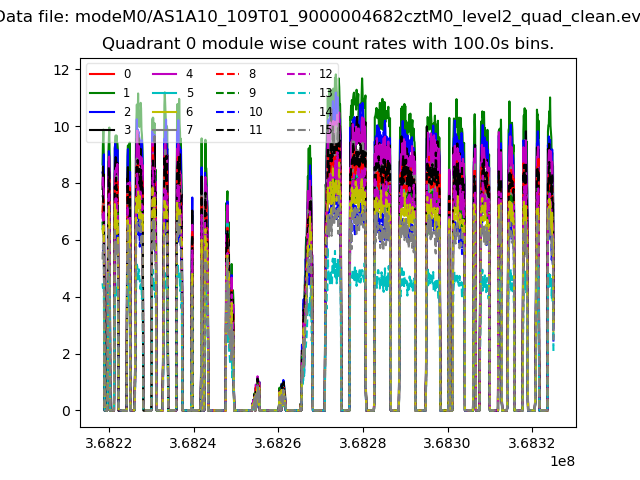 |
 |
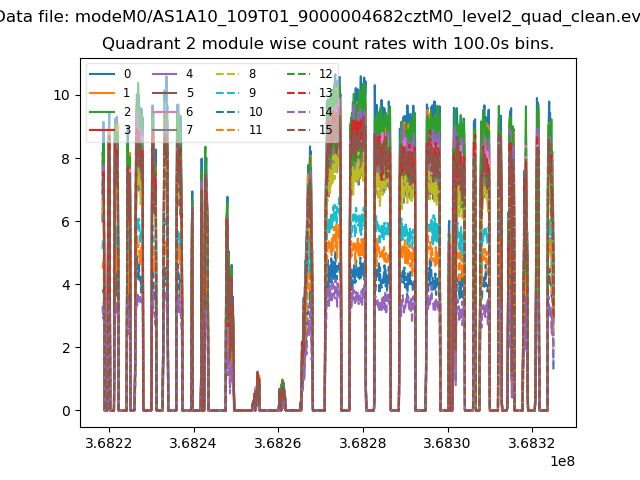
| Module-wise count rates for Quadrant B Data is divided into 100 sec bins |
 |
 |
| Module-wise count rates for Quadrant C Data is divided into 100 sec bins |
 |
 |
| Module-wise count rates for Quadrant D Data is divided into 100 sec bins |
 |
 |
| Parameter | Plot |
|---|---|
| CZT HV Monitor | 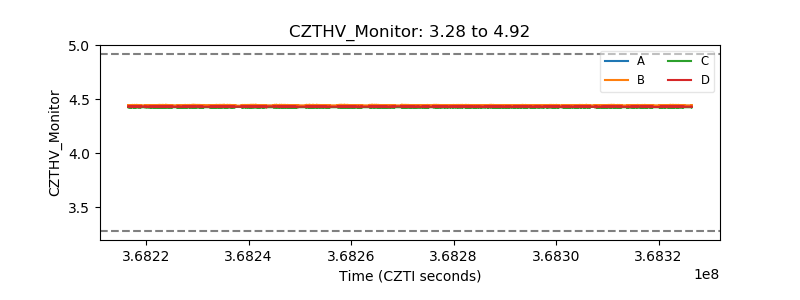 |
| D_VDD | 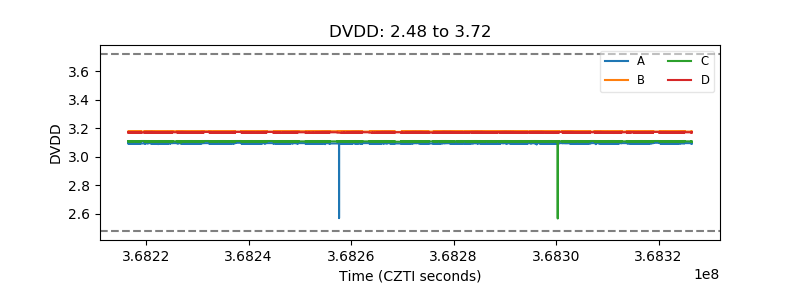 |
| Temperature 1 | 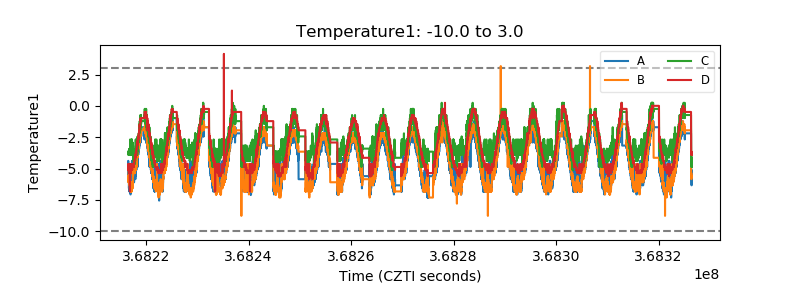 |
| Veto HV Monitor | 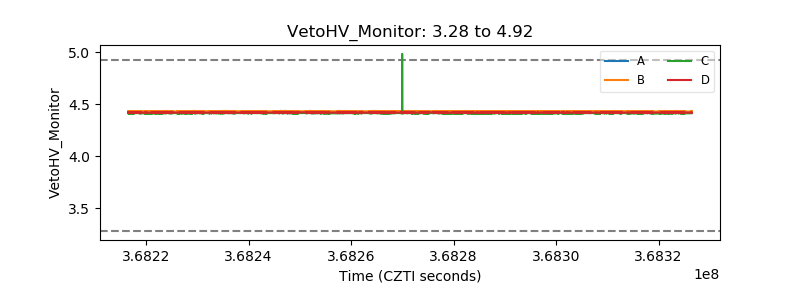 |
| Veto LLD | 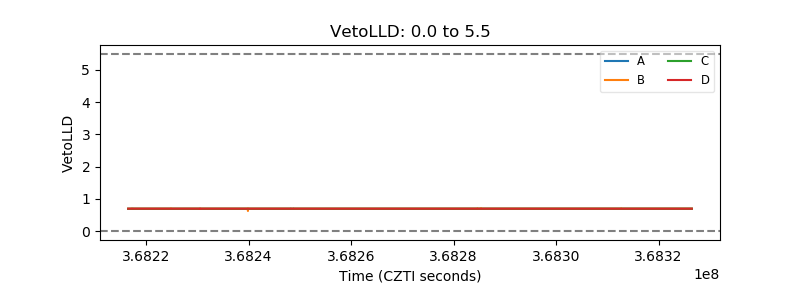 |
| Alpha Counter | 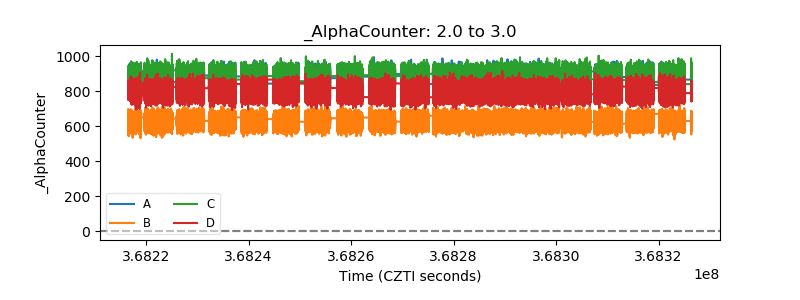 |
| _CPM_Rate | 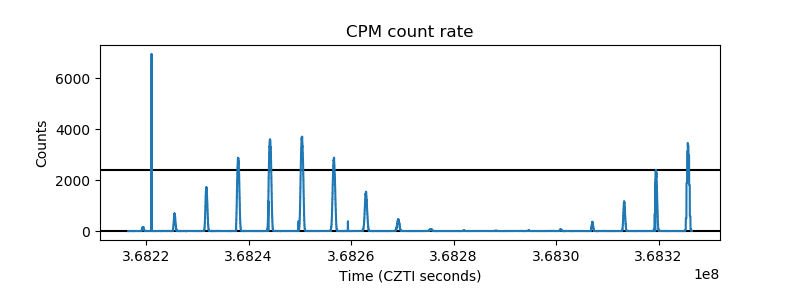 |
| CZT Counter | 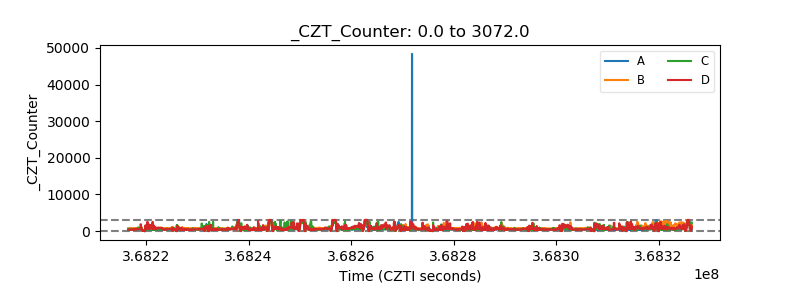 |
| +2.5 Volts monitor | 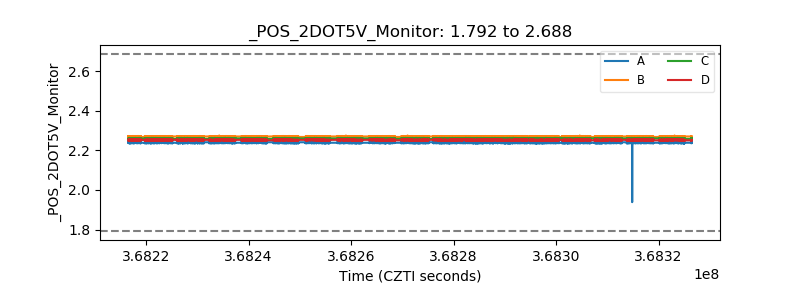 |
| +5 Volts monitor | 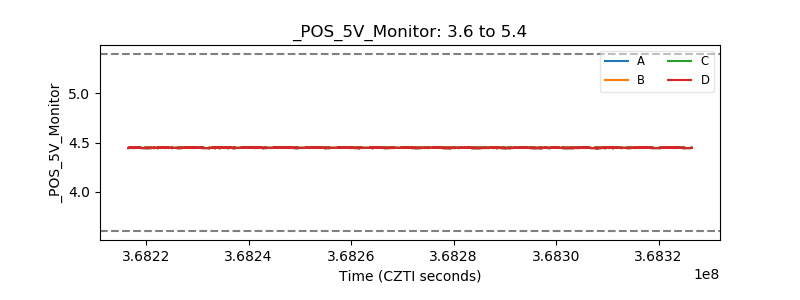 |
| _ROLL_ROT | 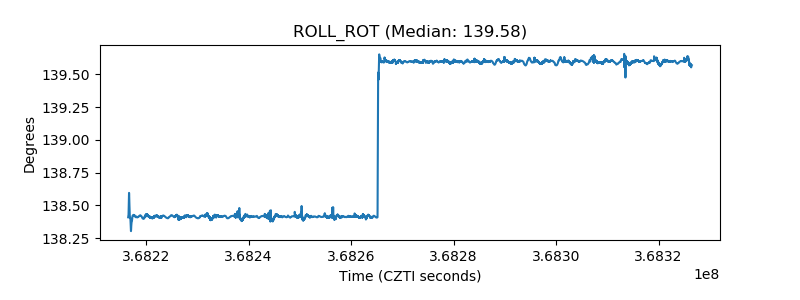 |
| _Roll_DEC | 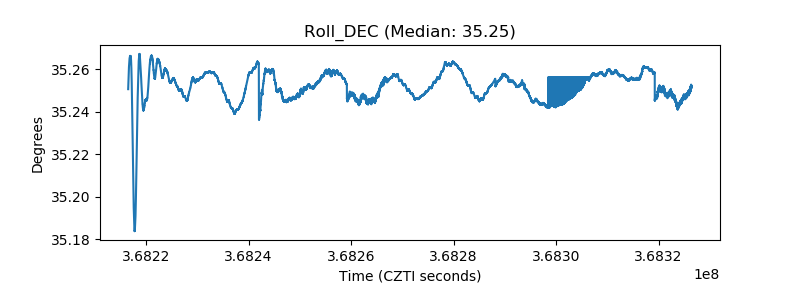 |
| _Roll_RA | 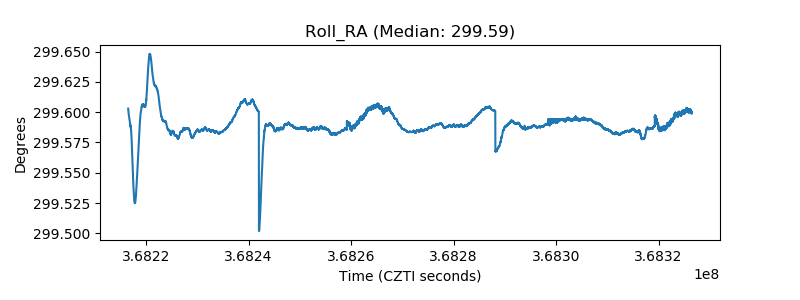 |
| Veto Counter | 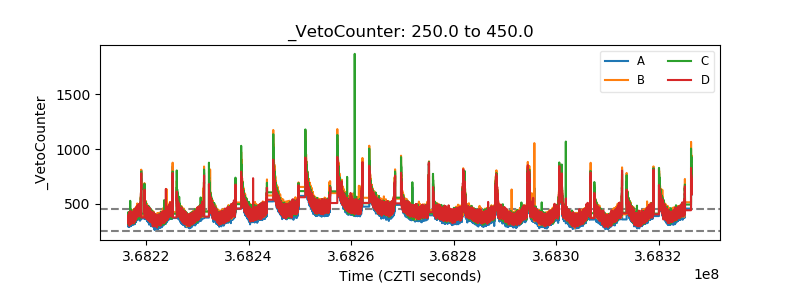 |