| Param | Original file | Final file |
|---|---|---|
| Filename | modeM0/AS1A10_109T01_9000004682_32056cztM0_level2.evt | modeM0/AS1A10_109T01_9000004682_32056cztM0_level2_quad_clean.evt |
| Size (bytes) | 824,307,840 | 124,070,400 |
| Size | 786.1 MB | 118.3 MB |
| Events in quadrant A | 4,606,700 | 808,560 |
| Events in quadrant B | 7,748,294 | 784,911 |
| Events in quadrant C | 5,060,952 | 766,002 |
| Events in quadrant D | 6,909,301 | 741,491 |
| Mode M9 | |||
|---|---|---|---|
| Quadrant | BADHDUFLAG | Total packets | Discarded packets |
| A | 0 | 14 | 0 |
| B | 0 | 14 | 0 |
| C | 0 | 14 | 0 |
| D | 0 | 14 | 0 |
| Mode M0 | |||
|---|---|---|---|
| Quadrant | BADHDUFLAG | Total packets | Discarded packets |
| A | 0 | 19743 | 2 |
| B | 0 | 29854 | 2 |
| C | 0 | 21052 | 2 |
| D | 0 | 26778 | 2 |
| Mode SS | |||
|---|---|---|---|
| Quadrant | BADHDUFLAG | Total packets | Discarded packets |
| A | 0 | 192 | 0 |
| B | 0 | 192 | 0 |
| C | 0 | 192 | 0 |
| D | 0 | 192 | 0 |
| Quadrant | Total seconds | Saturated seconds | Saturation percentage |
|---|---|---|---|
| A | 9463 | 52 | 0.549509% |
| B | 9463 | 271 | 2.863785% |
| C | 9462 | 211 | 2.229973% |
| D | 9462 | 215 | 2.272247% |
Noise dominated data is calculated using 1-second bins in cleaned event files. If a bin has >2000 counts, and if more than 50% of those come from <1% of pixels, then it is considered to be noise-dominated and hence unusable.
| Quadrant | # 1 sec bins | Bins with >0 counts | Bins with >2000 counts | High rate bins dominated by noise | Noise dominated (total time) | Noise dominated (detector-on time) | Marked lightcurve |
|---|---|---|---|---|---|---|---|
| A | 10894 | 9464 | 0 | 0 | 0.00% | 0.00% | 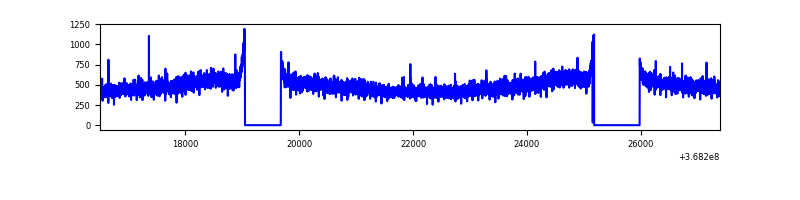 |
| B | 10894 | 9463 | 92 | 92 | 0.84% | 0.97% | 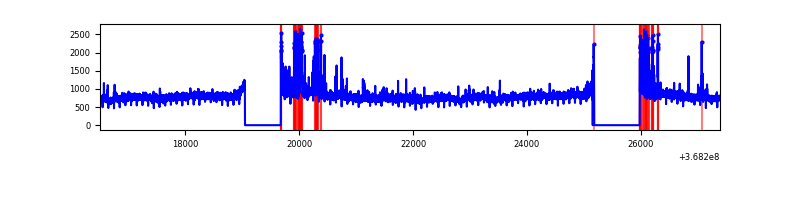 |
| C | 10893 | 9464 | 12 | 12 | 0.11% | 0.13% | 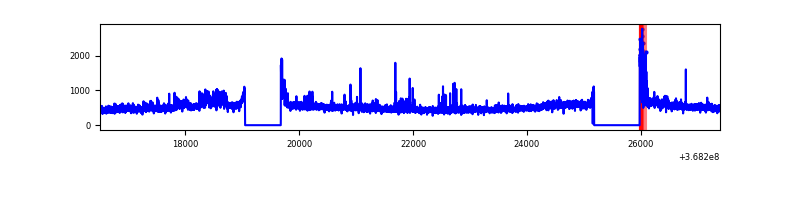 |
| D | 10893 | 9464 | 153 | 153 | 1.40% | 1.62% | 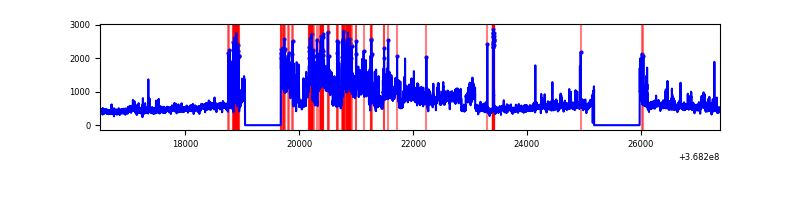 |
Top three noisy pixels from each quadrant. If the there are fewer than three noisy pixels in the level2.evt file, extra rows are filled as -1
| Pixel properties | Quadrant properties | ||||||
|---|---|---|---|---|---|---|---|
| Quadrant | DetID | PixID | Counts | Sigma | Mean | Median | Sigma |
| A | 13 | 254 | 18127 | 71.09 | 1189 | 1169 | 238.5 |
| A | 13 | 6 | 16460 | 64.1 | 1189 | 1169 | 238.5 |
| A | 3 | 137 | 12010 | 45.45 | 1189 | 1169 | 238.5 |
| B | 6 | 159 | 2573860 | 11552.48 | 1164 | 1132 | 222.7 |
| B | 5 | 172 | 382190 | 1711.09 | 1164 | 1132 | 222.7 |
| B | 10 | 245 | 121184 | 539.08 | 1164 | 1132 | 222.7 |
| C | 0 | 10 | 242277 | 907.39 | 1133 | 1140 | 265.7 |
| C | 14 | 238 | 196645 | 735.68 | 1133 | 1140 | 265.7 |
| C | 3 | 233 | 80678 | 299.3 | 1133 | 1140 | 265.7 |
| D | 8 | 195 | 1851302 | 6816.43 | 1139 | 1109 | 271.4 |
| D | 12 | 233 | 647995 | 2383.24 | 1139 | 1109 | 271.4 |
| D | 2 | 250 | 82695 | 300.58 | 1139 | 1109 | 271.4 |
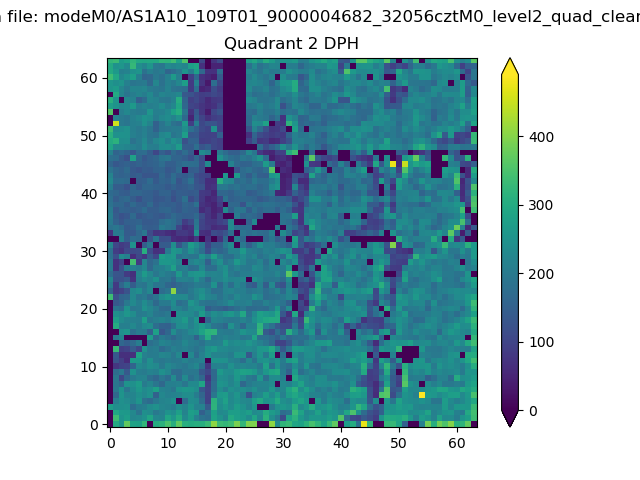
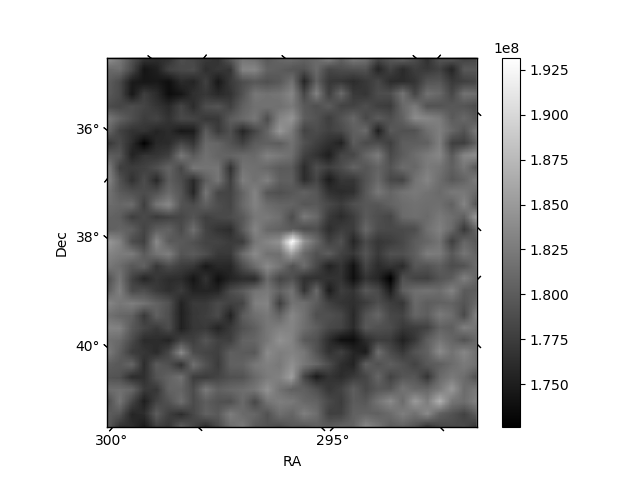
Histogram calculated using DETX and DETY for each event in the final _common_clean file
| Quadrant A | 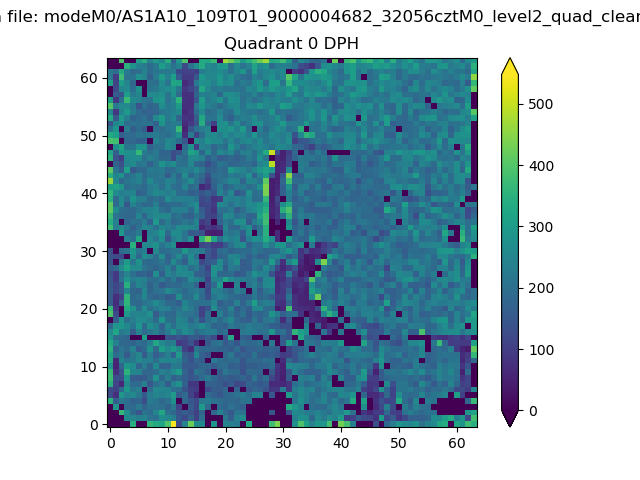 |
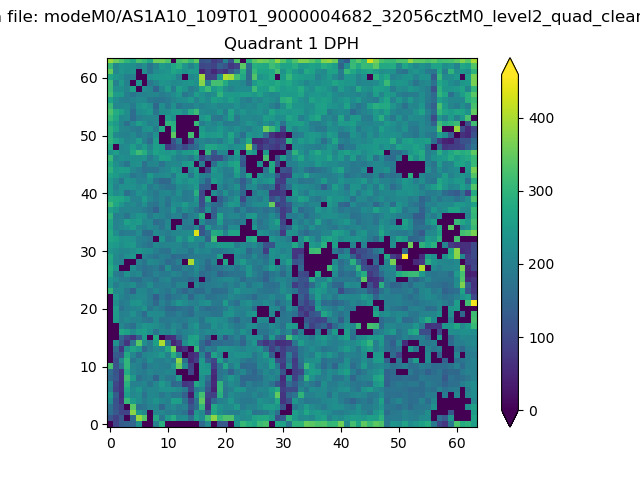 |
Quadrant B |
|---|---|---|---|
| Quadrant D | 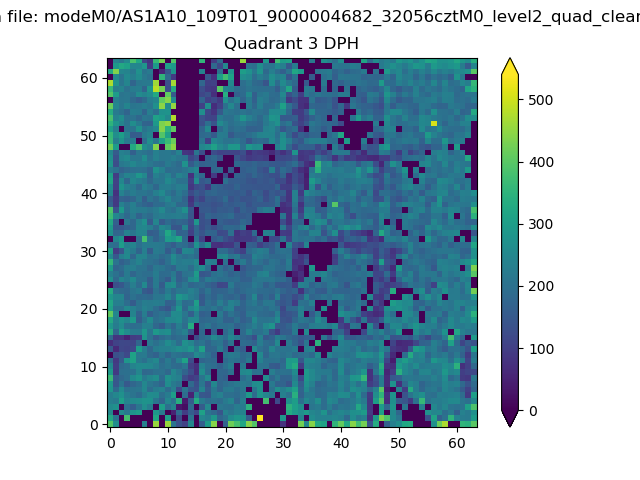 |
 |
Quadrant C |
| Plot type | Count rate plots | Images |
|---|---|---|
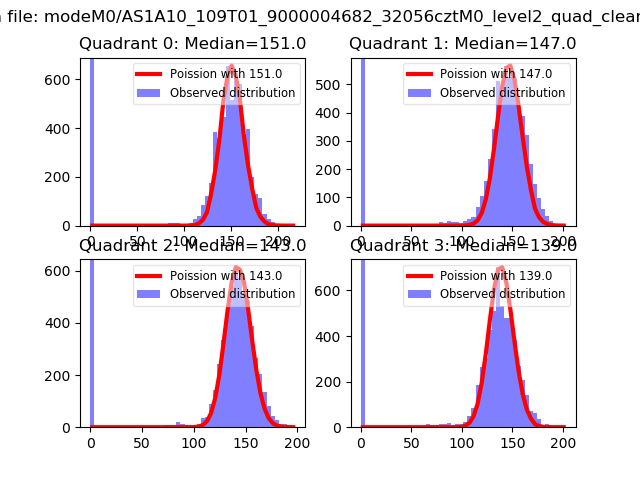
| Comparison with Poisson distribution Blue bars denote a histogram of data divided into 1 sec bins. Red curve is a Poisson curve with rate = median count rate of data. |
 |
 |
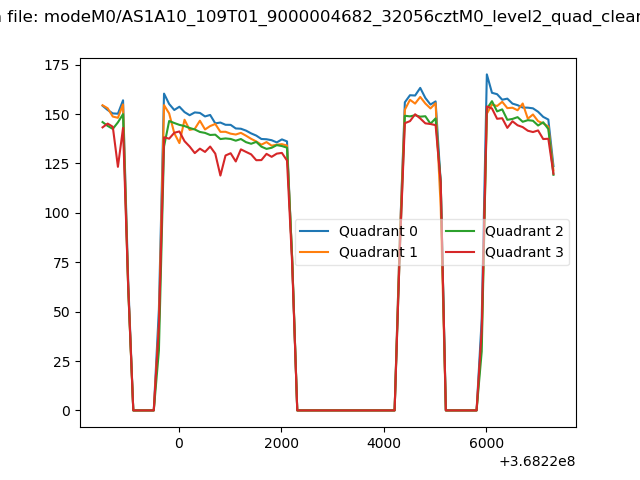
| Quadrant-wise count rates Data is divided into 100 sec bins |
 |
|
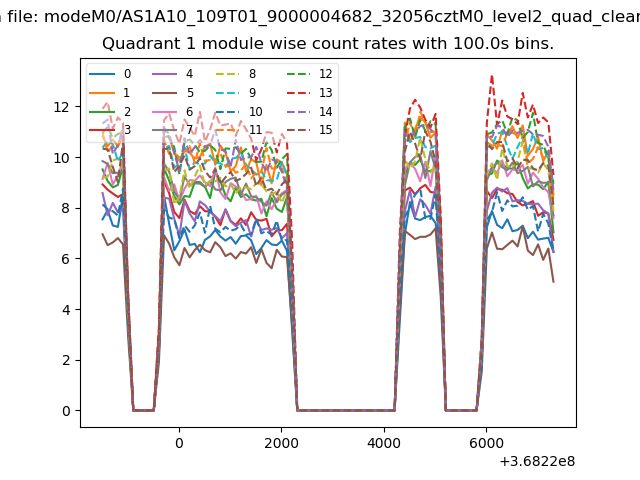
| Module-wise count rates for Quadrant A Data is divided into 100 sec bins |
 |
 |
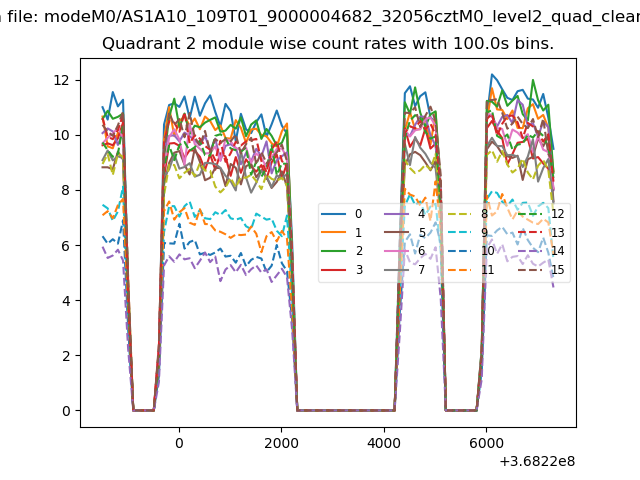
| Module-wise count rates for Quadrant B Data is divided into 100 sec bins |
 |
 |
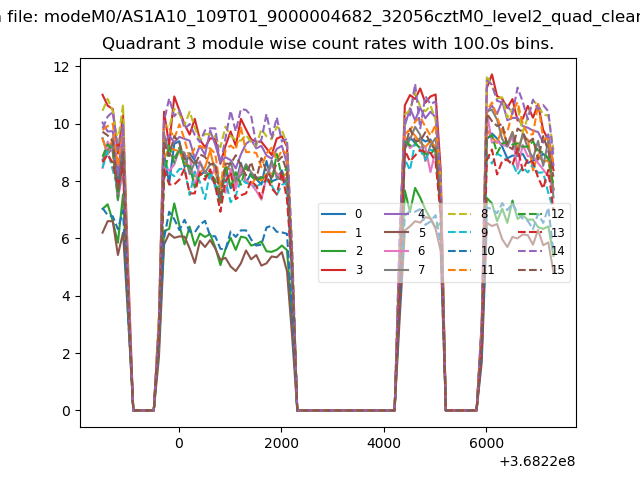
| Module-wise count rates for Quadrant C Data is divided into 100 sec bins |
 |
 |
| Module-wise count rates for Quadrant D Data is divided into 100 sec bins |
 |
 |
| Parameter | Plot |
|---|---|
| CZT HV Monitor | 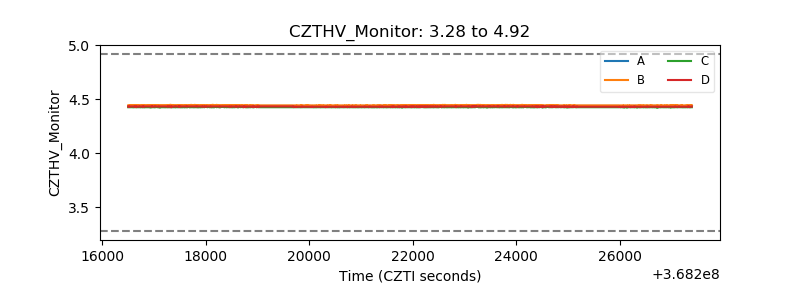 |
| D_VDD | 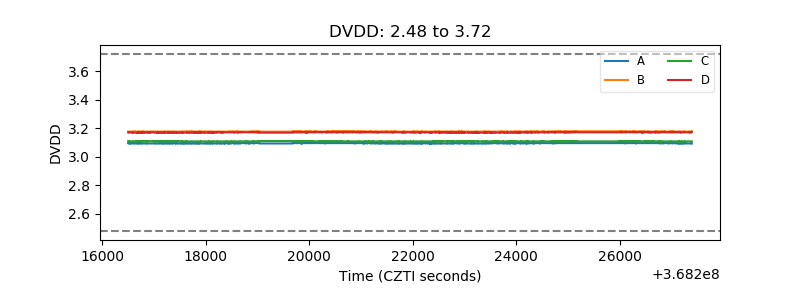 |
| Temperature 1 | 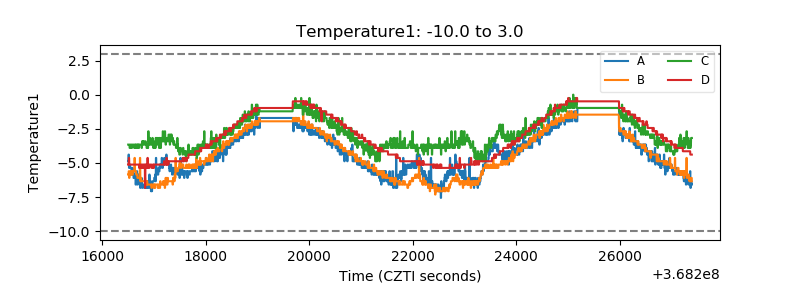 |
| Veto HV Monitor | 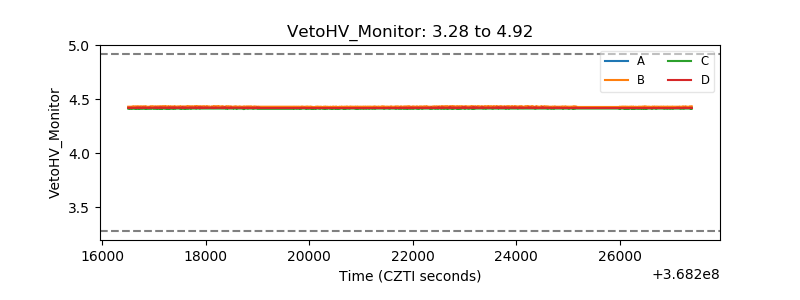 |
| Veto LLD | 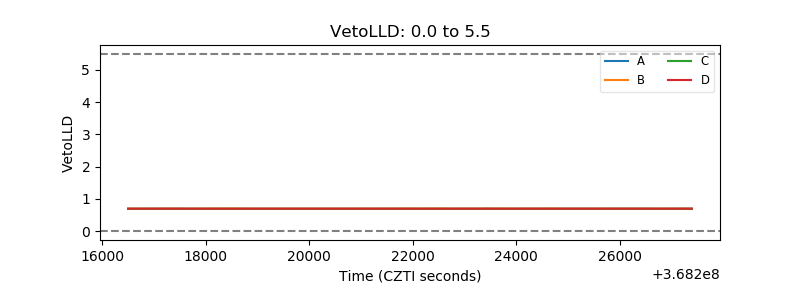 |
| Alpha Counter | 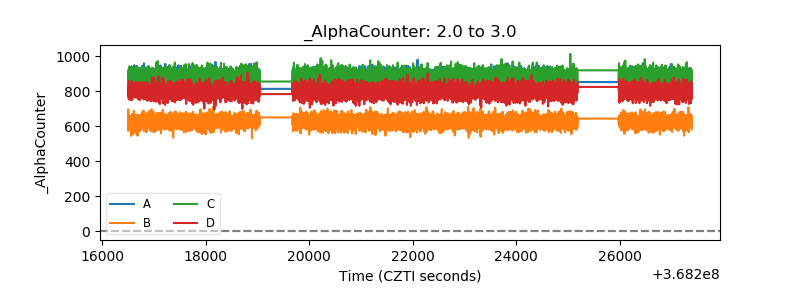 |
| _CPM_Rate | 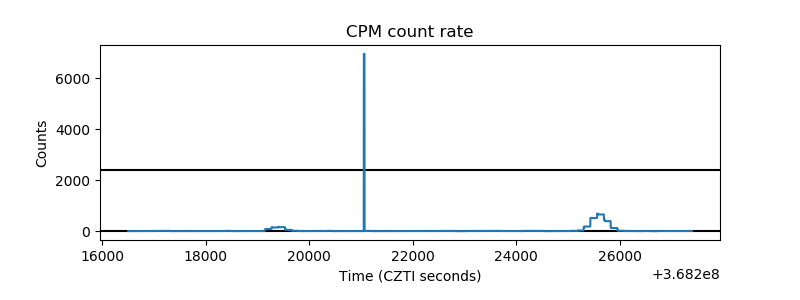 |
| CZT Counter | 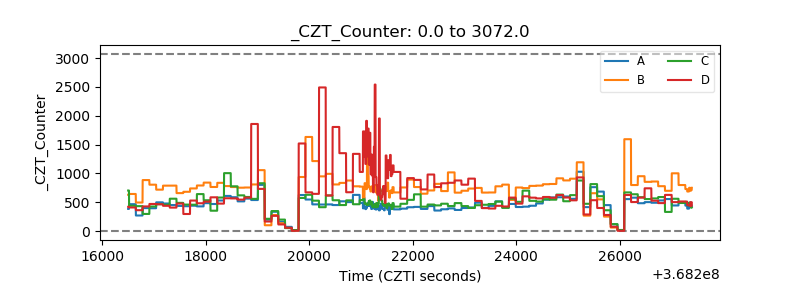 |
| +2.5 Volts monitor |  |
| +5 Volts monitor |  |
| _ROLL_ROT |  |
| _Roll_DEC | 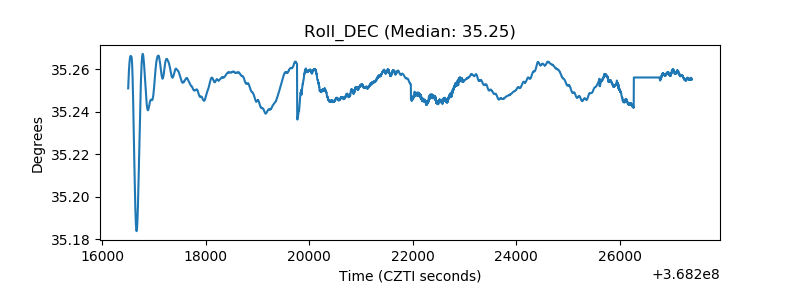 |
| _Roll_RA | 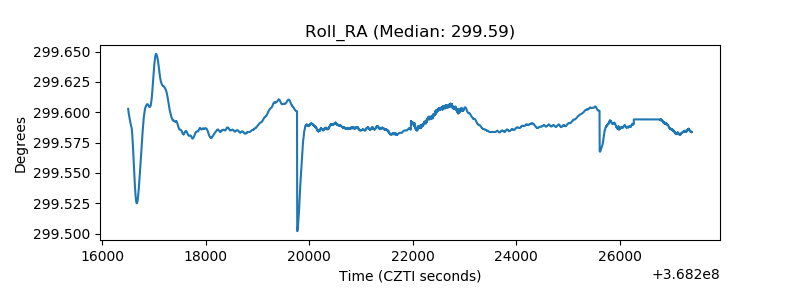 |
| Veto Counter |  |