| Param | Original file | Final file |
|---|---|---|
| Filename | modeM0/AS1A10_109T01_9000004682_32057cztM0_level2.evt | modeM0/AS1A10_109T01_9000004682_32057cztM0_level2_quad_clean.evt |
| Size (bytes) | 549,097,920 | 107,496,000 |
| Size | 523.7 MB | 102.5 MB |
| Events in quadrant A | 3,273,679 | 720,296 |
| Events in quadrant B | 5,402,226 | 708,661 |
| Events in quadrant C | 3,825,671 | 682,283 |
| Events in quadrant D | 3,672,277 | 675,527 |
| Mode M9 | |||
|---|---|---|---|
| Quadrant | BADHDUFLAG | Total packets | Discarded packets |
| A | 0 | 14 | 0 |
| B | 0 | 15 | 0 |
| C | 0 | 15 | 0 |
| D | 0 | 15 | 0 |
| Mode M0 | |||
|---|---|---|---|
| Quadrant | BADHDUFLAG | Total packets | Discarded packets |
| A | 0 | 14004 | 2 |
| B | 0 | 20835 | 2 |
| C | 0 | 15670 | 2 |
| D | 0 | 15416 | 2 |
| Mode SS | |||
|---|---|---|---|
| Quadrant | BADHDUFLAG | Total packets | Discarded packets |
| A | 0 | 136 | 0 |
| B | 0 | 136 | 0 |
| C | 0 | 136 | 0 |
| D | 0 | 136 | 0 |
| Quadrant | Total seconds | Saturated seconds | Saturation percentage |
|---|---|---|---|
| A | 6727 | 22 | 0.327040% |
| B | 6727 | 134 | 1.991973% |
| C | 6727 | 203 | 3.017690% |
| D | 6727 | 41 | 0.609484% |
Noise dominated data is calculated using 1-second bins in cleaned event files. If a bin has >2000 counts, and if more than 50% of those come from <1% of pixels, then it is considered to be noise-dominated and hence unusable.
| Quadrant | # 1 sec bins | Bins with >0 counts | Bins with >2000 counts | High rate bins dominated by noise | Noise dominated (total time) | Noise dominated (detector-on time) | Marked lightcurve |
|---|---|---|---|---|---|---|---|
| A | 7682 | 6727 | 0 | 0 | 0.00% | 0.00% | 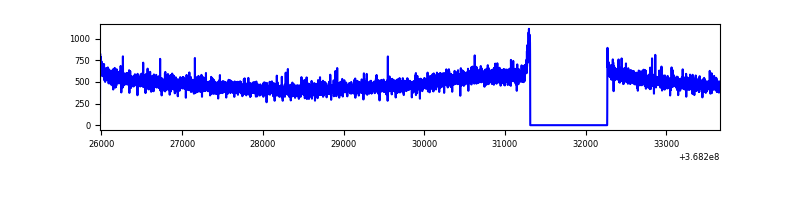 |
| B | 7682 | 6727 | 42 | 42 | 0.55% | 0.62% | 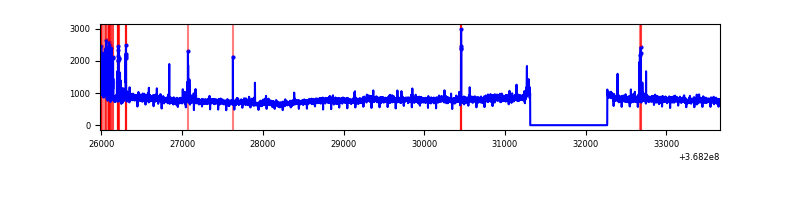 |
| C | 7682 | 6727 | 58 | 58 | 0.76% | 0.86% | 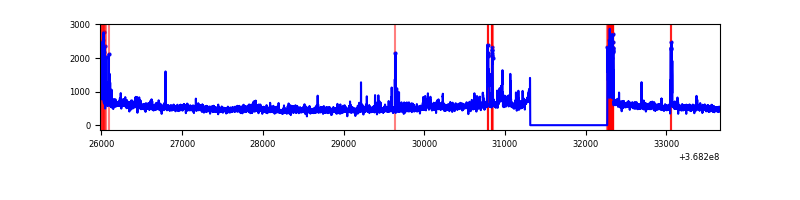 |
| D | 7682 | 6727 | 14 | 14 | 0.18% | 0.21% | 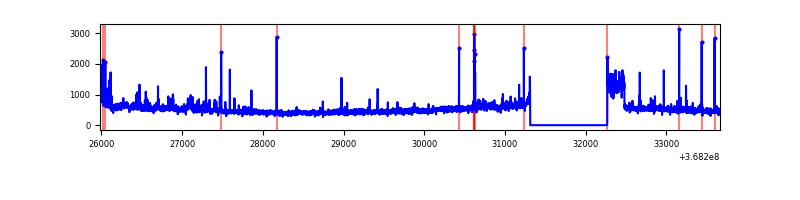 |
Top three noisy pixels from each quadrant. If the there are fewer than three noisy pixels in the level2.evt file, extra rows are filled as -1
| Pixel properties | Quadrant properties | ||||||
|---|---|---|---|---|---|---|---|
| Quadrant | DetID | PixID | Counts | Sigma | Mean | Median | Sigma |
| A | 13 | 254 | 12689 | 69.47 | 843 | 829 | 170.7 |
| A | 13 | 6 | 12587 | 68.88 | 843 | 829 | 170.7 |
| A | 3 | 137 | 8194 | 43.14 | 843 | 829 | 170.7 |
| B | 6 | 159 | 1883664 | 11897.02 | 831 | 810 | 158.3 |
| B | 5 | 172 | 167844 | 1055.42 | 831 | 810 | 158.3 |
| B | 10 | 245 | 30297 | 186.32 | 831 | 810 | 158.3 |
| C | 0 | 10 | 177285 | 932.35 | 809 | 817 | 189.3 |
| C | 3 | 233 | 154271 | 810.76 | 809 | 817 | 189.3 |
| C | 14 | 238 | 131487 | 690.38 | 809 | 817 | 189.3 |
| D | 8 | 195 | 422349 | 2179.17 | 815 | 793 | 193.4 |
| D | 12 | 233 | 125663 | 645.5 | 815 | 793 | 193.4 |
| D | 2 | 234 | 32120 | 161.94 | 815 | 793 | 193.4 |
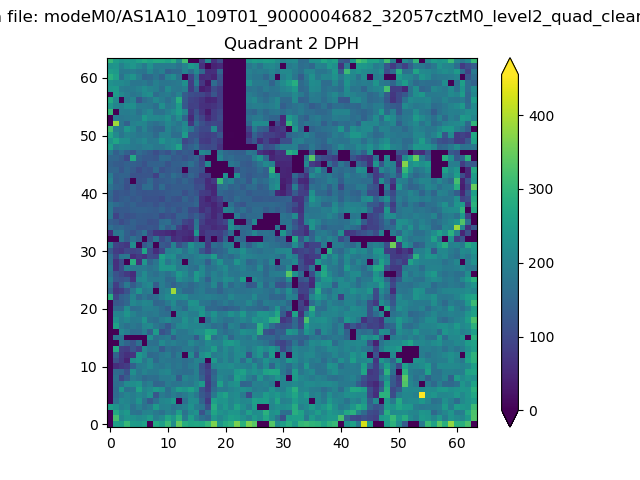
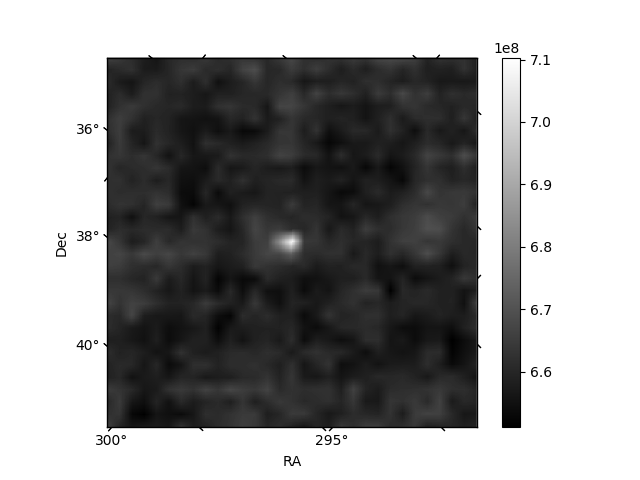
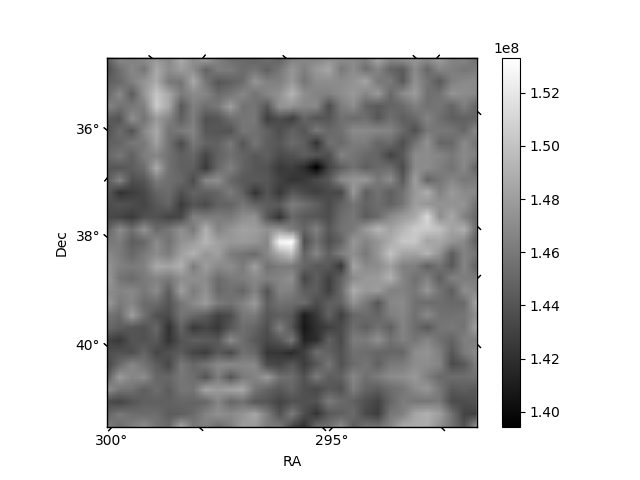
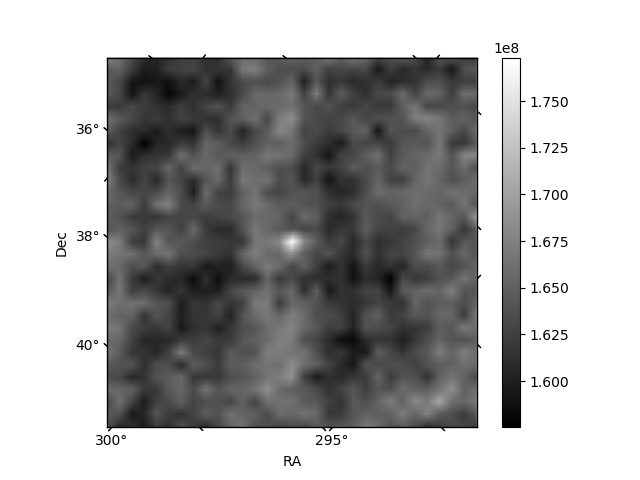
Histogram calculated using DETX and DETY for each event in the final _common_clean file
| Quadrant A | 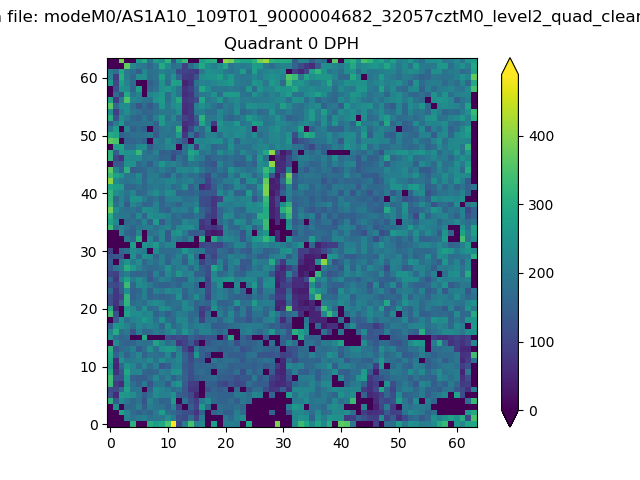 |
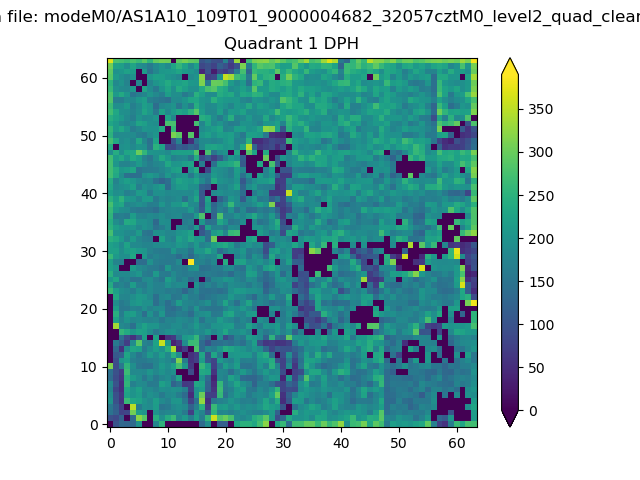 |
Quadrant B |
|---|---|---|---|
| Quadrant D | 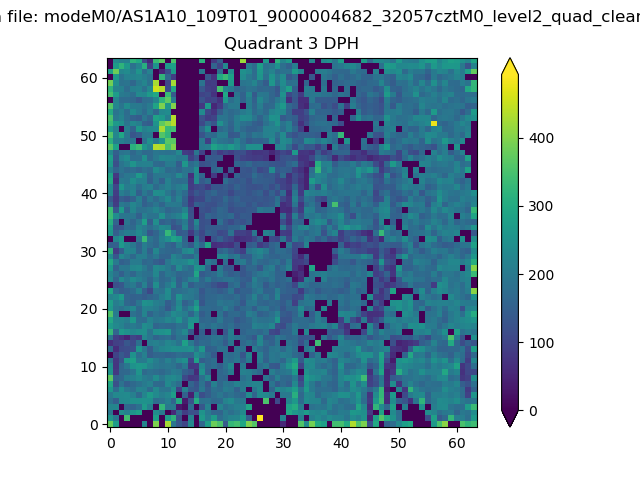 |
 |
Quadrant C |
| Plot type | Count rate plots | Images |
|---|---|---|
| Comparison with Poisson distribution Blue bars denote a histogram of data divided into 1 sec bins. Red curve is a Poisson curve with rate = median count rate of data. |
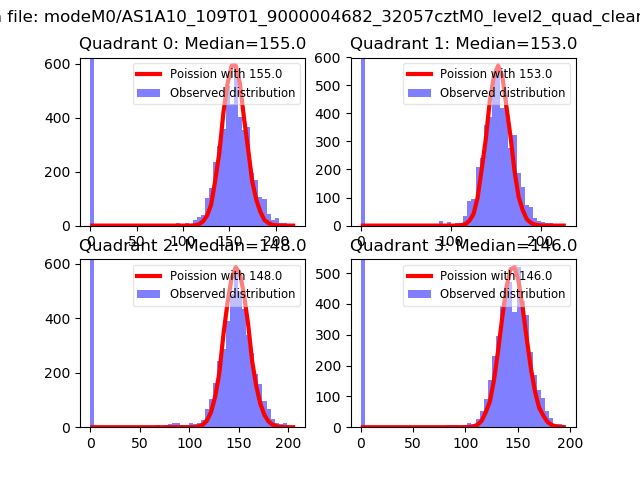 |
 |
| Quadrant-wise count rates Data is divided into 100 sec bins |
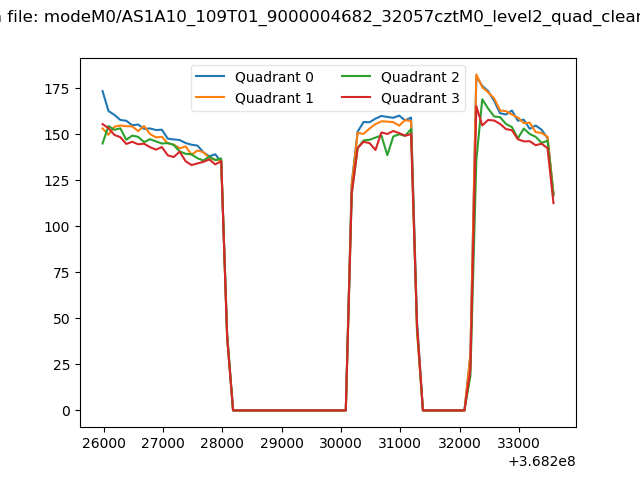 |
|
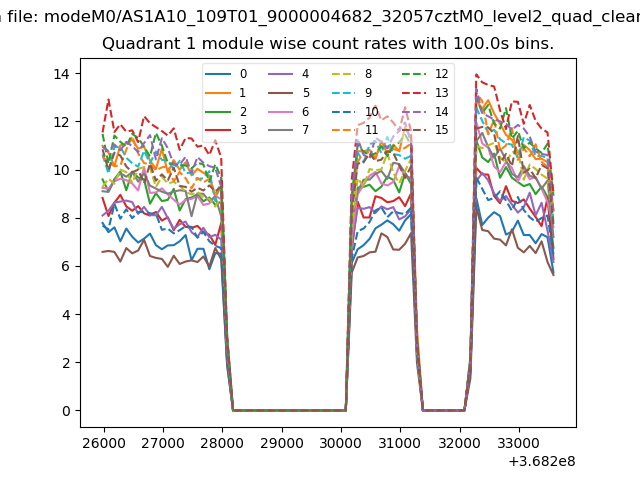
| Module-wise count rates for Quadrant A Data is divided into 100 sec bins |
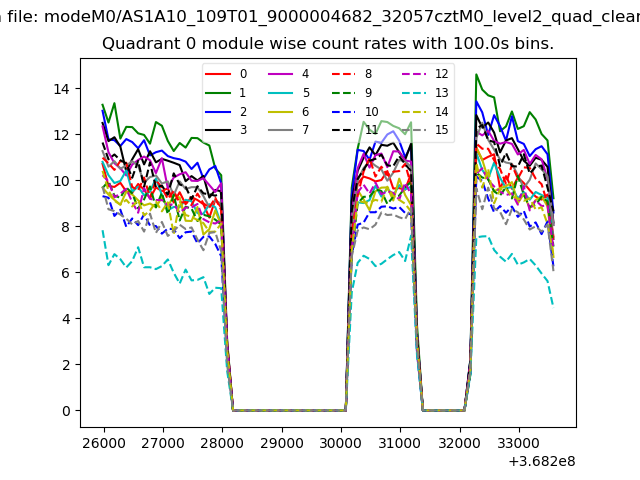 |
 |
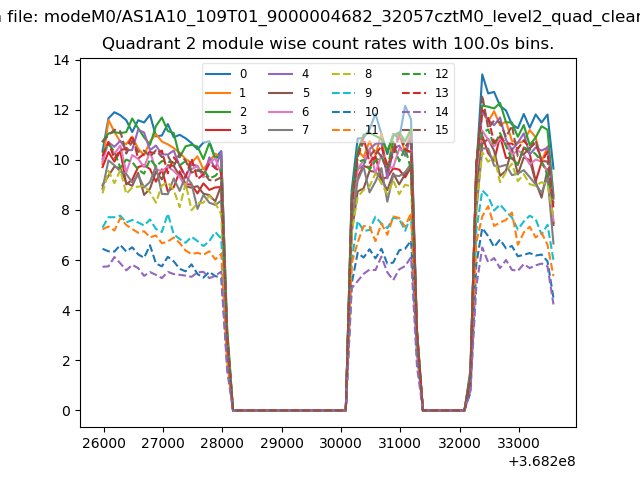
| Module-wise count rates for Quadrant B Data is divided into 100 sec bins |
 |
 |
| Module-wise count rates for Quadrant C Data is divided into 100 sec bins |
 |
 |
| Module-wise count rates for Quadrant D Data is divided into 100 sec bins |
 |
 |
| Parameter | Plot |
|---|---|
| CZT HV Monitor | 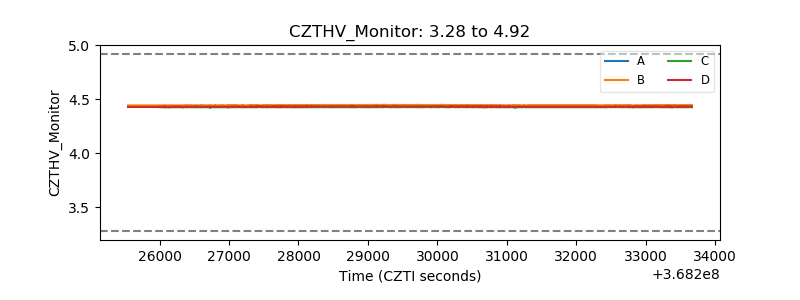 |
| D_VDD | 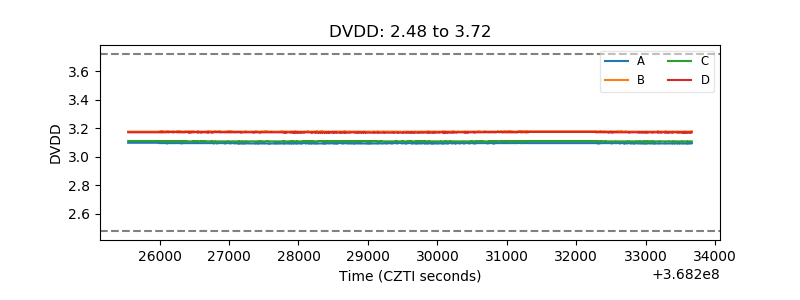 |
| Temperature 1 | 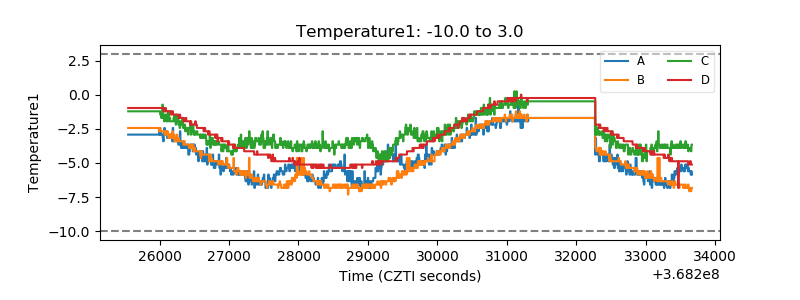 |
| Veto HV Monitor | 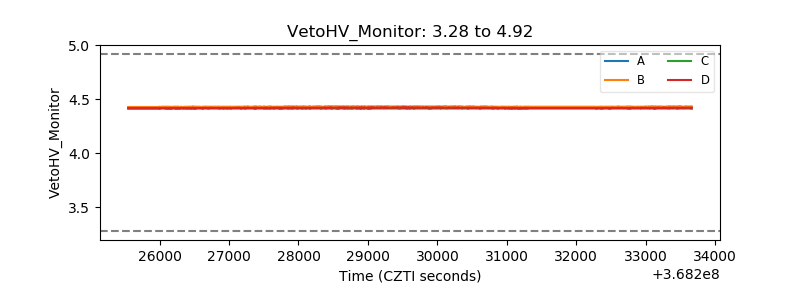 |
| Veto LLD | 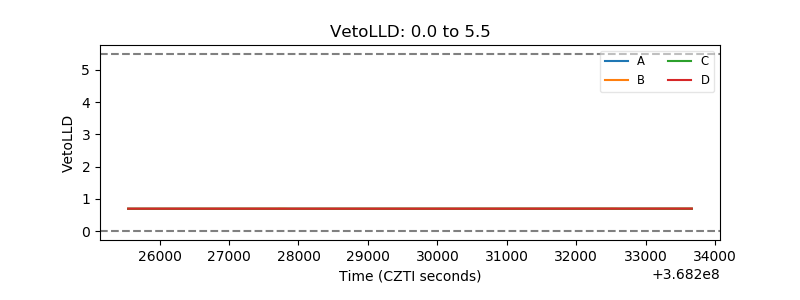 |
| Alpha Counter | 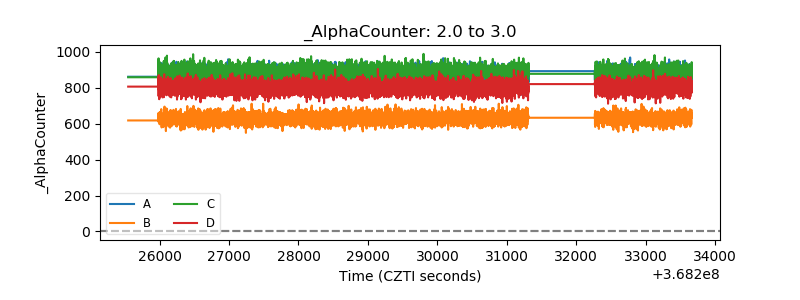 |
| _CPM_Rate | 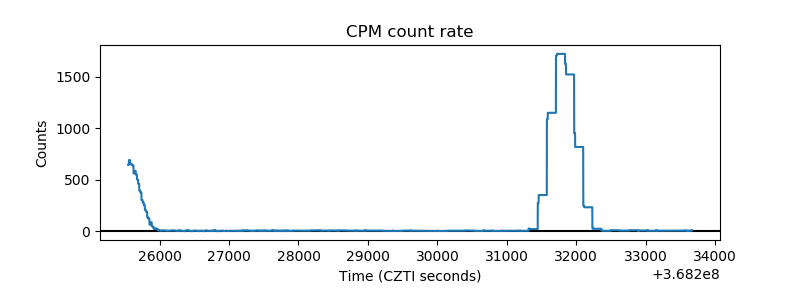 |
| CZT Counter | 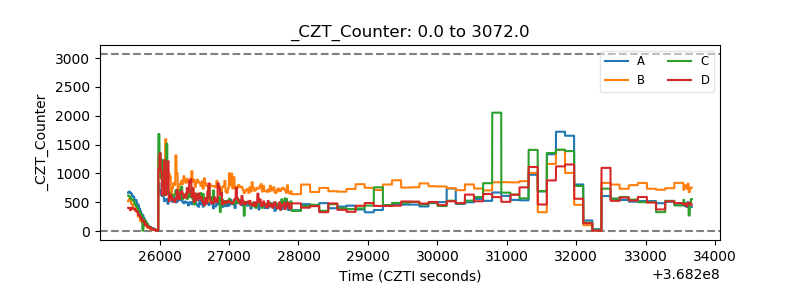 |
| +2.5 Volts monitor |  |
| +5 Volts monitor |  |
| _ROLL_ROT | 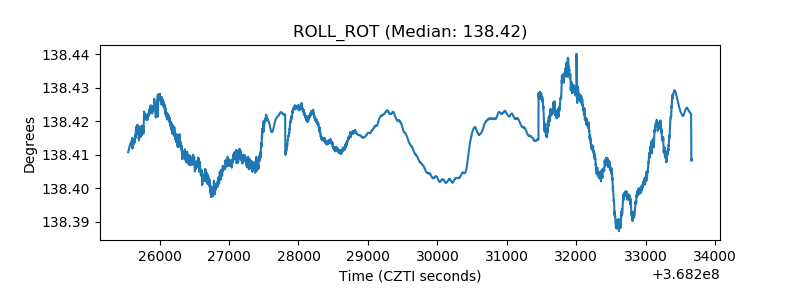 |
| _Roll_DEC |  |
| _Roll_RA | 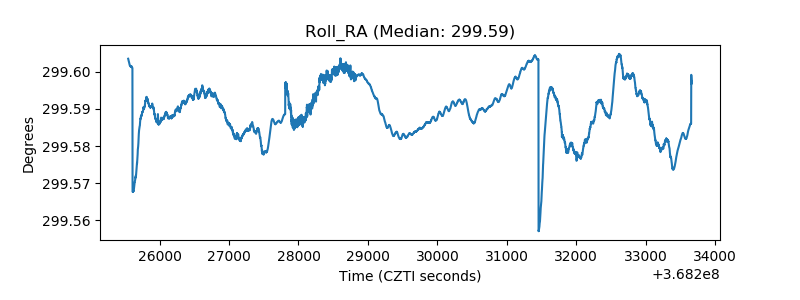 |
| Veto Counter |  |