| Param | Original file | Final file |
|---|---|---|
| Filename | modeM0/AS1A10_109T01_9000004682_32060cztM0_level2.evt | modeM0/AS1A10_109T01_9000004682_32060cztM0_level2_quad_clean.evt |
| Size (bytes) | 555,837,120 | 97,519,680 |
| Size | 530.1 MB | 93.0 MB |
| Events in quadrant A | 3,246,469 | 652,909 |
| Events in quadrant B | 5,089,277 | 654,187 |
| Events in quadrant C | 3,754,148 | 611,893 |
| Events in quadrant D | 4,318,466 | 595,672 |
| Mode M9 | |||
|---|---|---|---|
| Quadrant | BADHDUFLAG | Total packets | Discarded packets |
| A | 0 | 16 | 0 |
| B | 0 | 17 | 0 |
| C | 0 | 17 | 0 |
| D | 0 | 17 | 0 |
| Mode M0 | |||
|---|---|---|---|
| Quadrant | BADHDUFLAG | Total packets | Discarded packets |
| A | 0 | 13490 | 1 |
| B | 0 | 19449 | 1 |
| C | 0 | 15146 | 1 |
| D | 0 | 17182 | 1 |
| Mode SS | |||
|---|---|---|---|
| Quadrant | BADHDUFLAG | Total packets | Discarded packets |
| A | 0 | 128 | 0 |
| B | 0 | 128 | 0 |
| C | 0 | 128 | 0 |
| D | 0 | 128 | 0 |
| Quadrant | Total seconds | Saturated seconds | Saturation percentage |
|---|---|---|---|
| A | 6283 | 24 | 0.381983% |
| B | 6283 | 86 | 1.368773% |
| C | 6283 | 179 | 2.848958% |
| D | 6283 | 38 | 0.604807% |
Noise dominated data is calculated using 1-second bins in cleaned event files. If a bin has >2000 counts, and if more than 50% of those come from <1% of pixels, then it is considered to be noise-dominated and hence unusable.
| Quadrant | # 1 sec bins | Bins with >0 counts | Bins with >2000 counts | High rate bins dominated by noise | Noise dominated (total time) | Noise dominated (detector-on time) | Marked lightcurve |
|---|---|---|---|---|---|---|---|
| A | 7503 | 6283 | 0 | 0 | 0.00% | 0.00% | 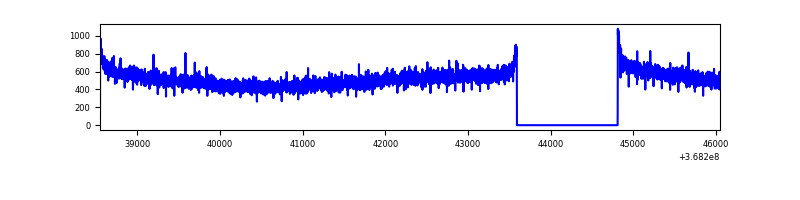 |
| B | 7503 | 6283 | 0 | 0 | 0.00% | 0.00% | 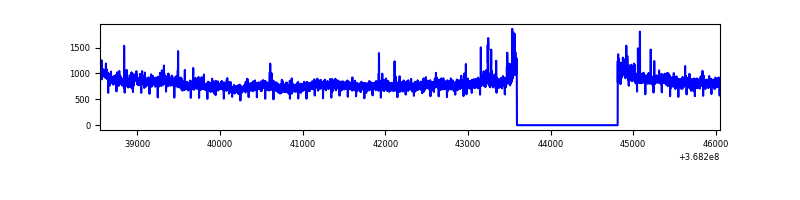 |
| C | 7503 | 6283 | 56 | 56 | 0.75% | 0.89% | 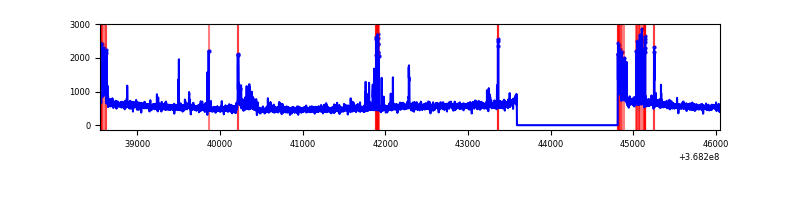 |
| D | 7503 | 6284 | 22 | 22 | 0.29% | 0.35% | 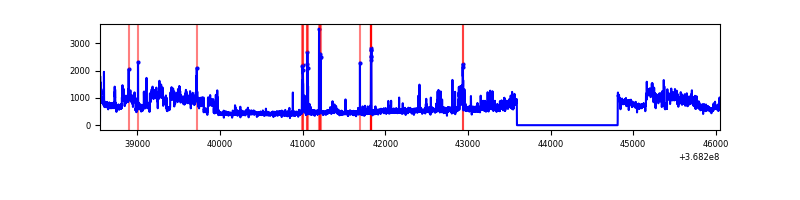 |
Top three noisy pixels from each quadrant. If the there are fewer than three noisy pixels in the level2.evt file, extra rows are filled as -1
| Pixel properties | Quadrant properties | ||||||
|---|---|---|---|---|---|---|---|
| Quadrant | DetID | PixID | Counts | Sigma | Mean | Median | Sigma |
| A | 13 | 254 | 11082 | 61.55 | 839 | 825 | 166.7 |
| A | 13 | 6 | 10163 | 56.03 | 839 | 825 | 166.7 |
| A | 3 | 137 | 7768 | 41.66 | 839 | 825 | 166.7 |
| B | 6 | 159 | 1699435 | 10799.75 | 834 | 816 | 157.3 |
| B | 5 | 172 | 41840 | 260.83 | 834 | 816 | 157.3 |
| B | 10 | 245 | 39688 | 247.15 | 834 | 816 | 157.3 |
| C | 0 | 10 | 338233 | 1815.34 | 796 | 804 | 185.9 |
| C | 14 | 238 | 131762 | 704.54 | 796 | 804 | 185.9 |
| C | 3 | 233 | 52860 | 280.06 | 796 | 804 | 185.9 |
| D | 8 | 195 | 1075257 | 5655.05 | 798 | 779 | 190.0 |
| D | 12 | 218 | 102998 | 537.99 | 798 | 779 | 190.0 |
| D | 2 | 250 | 48275 | 249.97 | 798 | 779 | 190.0 |
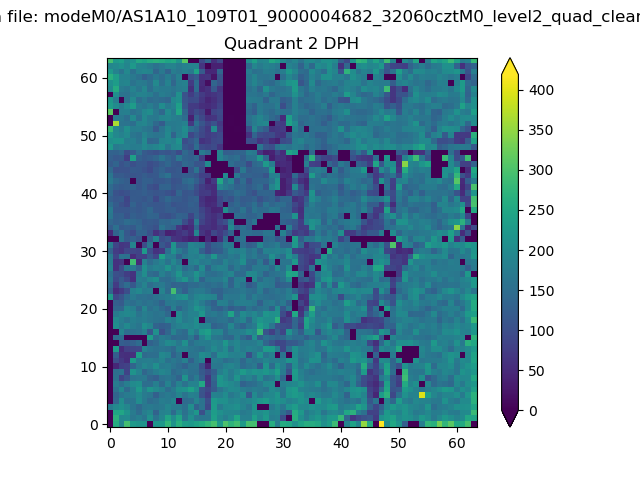
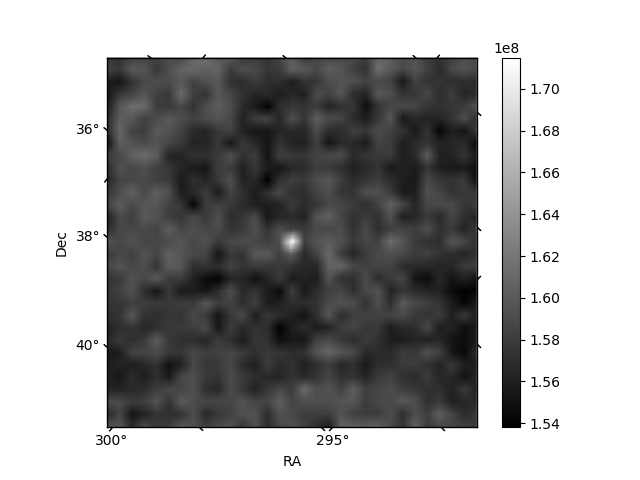
Histogram calculated using DETX and DETY for each event in the final _common_clean file
| Quadrant A | 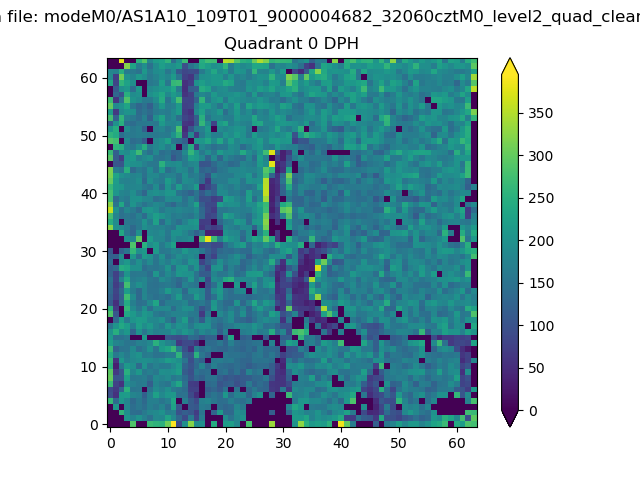 |
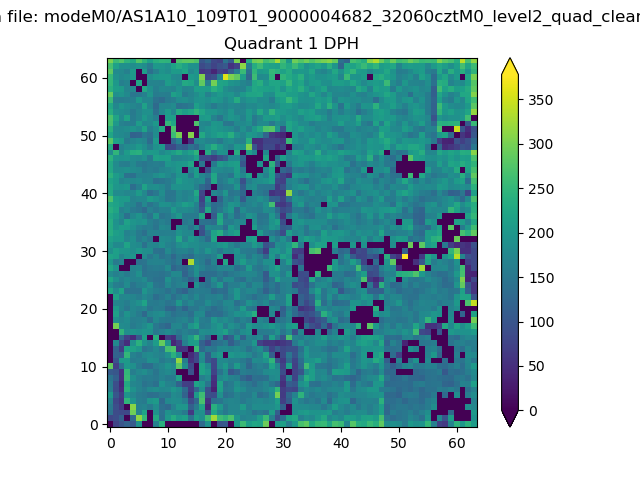 |
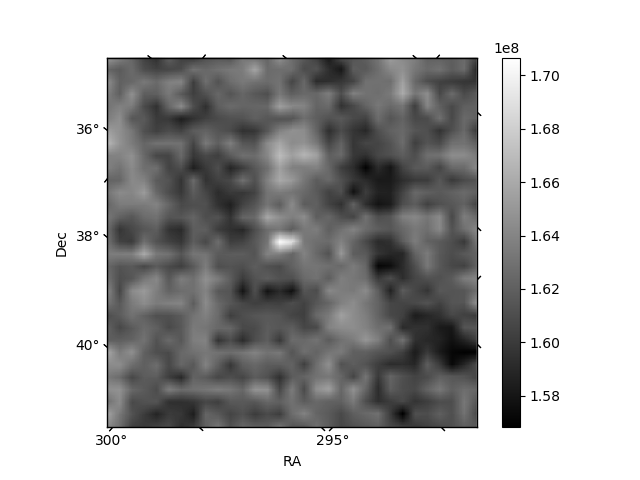
Quadrant B |
|---|---|---|---|
| Quadrant D | 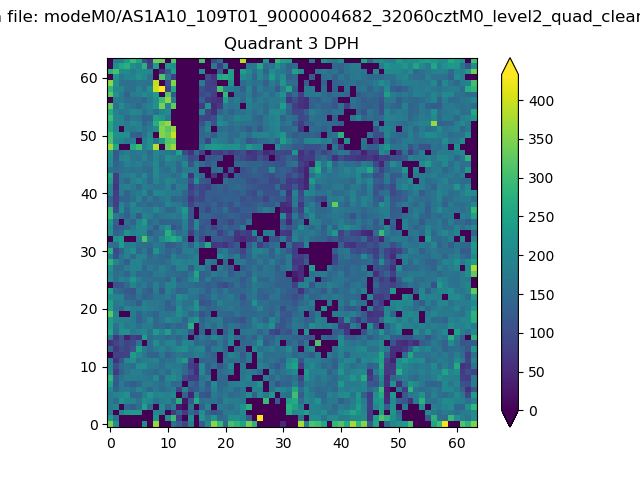 |
 |
Quadrant C |
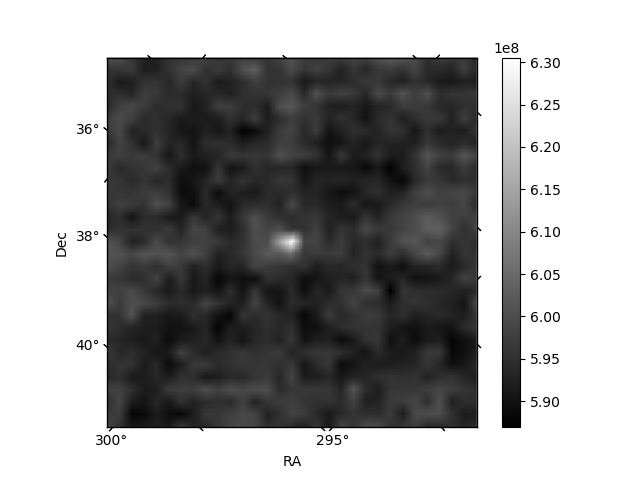
| Plot type | Count rate plots | Images |
|---|---|---|
| Comparison with Poisson distribution Blue bars denote a histogram of data divided into 1 sec bins. Red curve is a Poisson curve with rate = median count rate of data. |
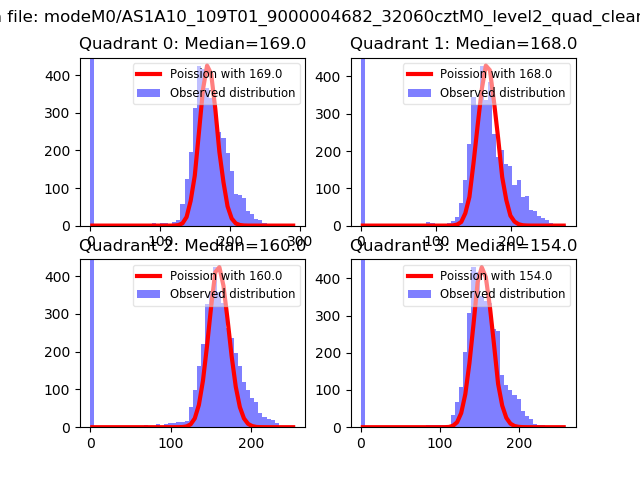 |
 |
| Quadrant-wise count rates Data is divided into 100 sec bins |
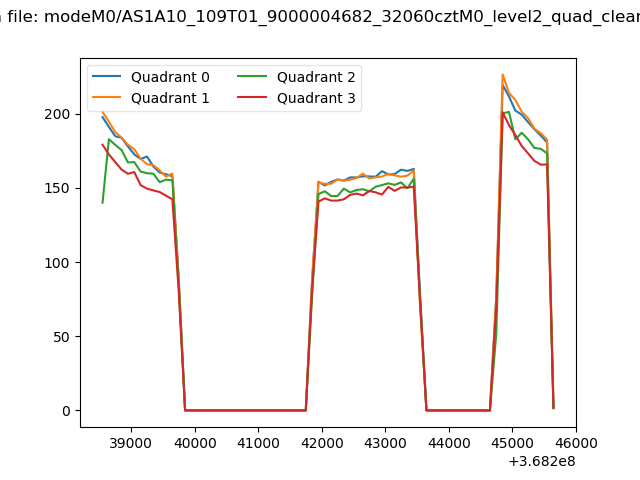 |
|
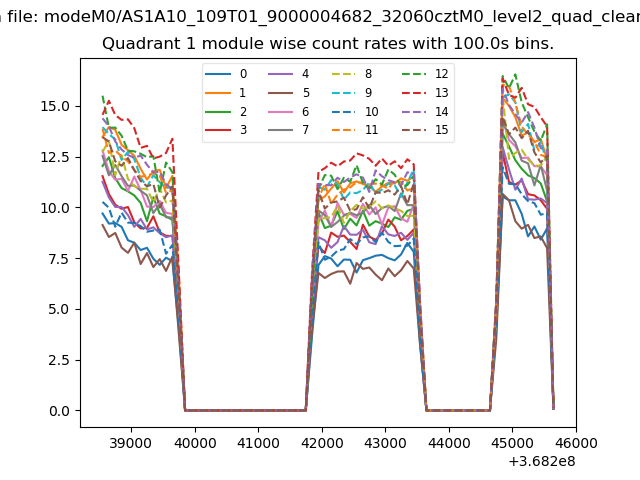
| Module-wise count rates for Quadrant A Data is divided into 100 sec bins |
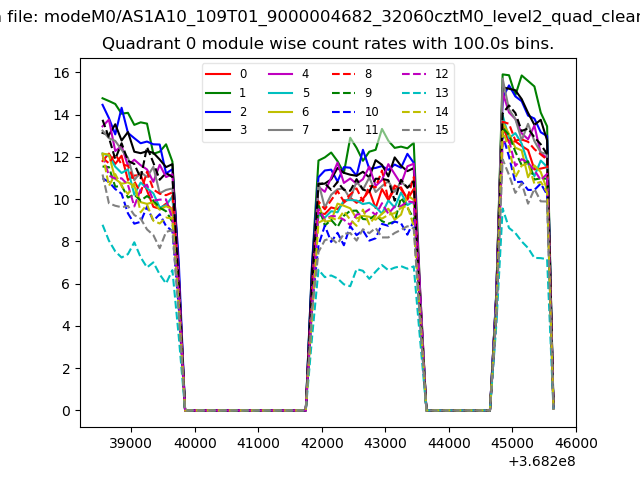 |
 |
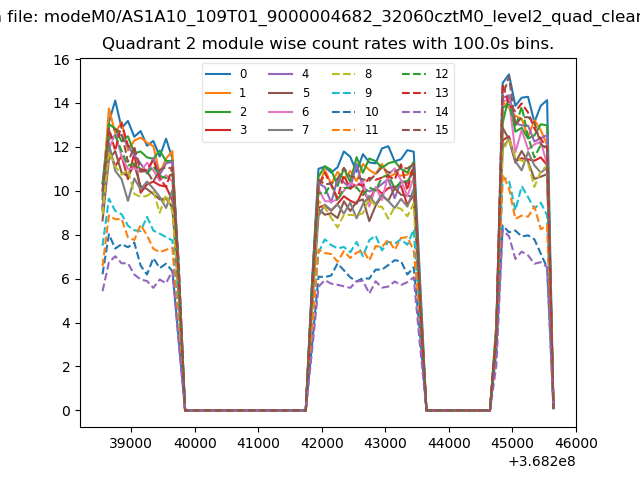
| Module-wise count rates for Quadrant B Data is divided into 100 sec bins |
 |
 |
| Module-wise count rates for Quadrant C Data is divided into 100 sec bins |
 |
 |
| Module-wise count rates for Quadrant D Data is divided into 100 sec bins |
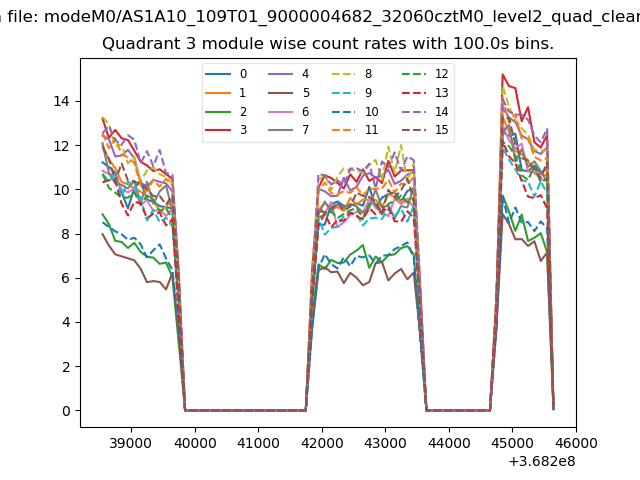 |
 |
| Parameter | Plot |
|---|---|
| CZT HV Monitor | 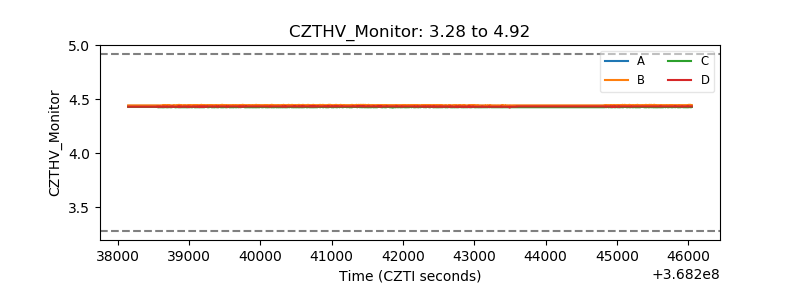 |
| D_VDD | 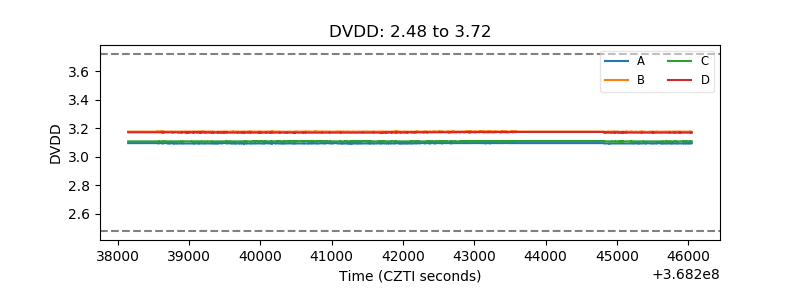 |
| Temperature 1 | 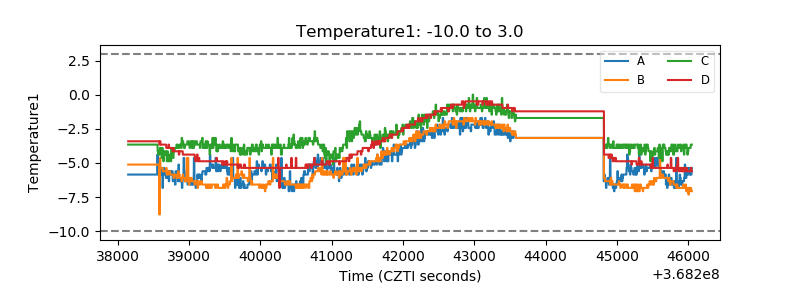 |
| Veto HV Monitor | 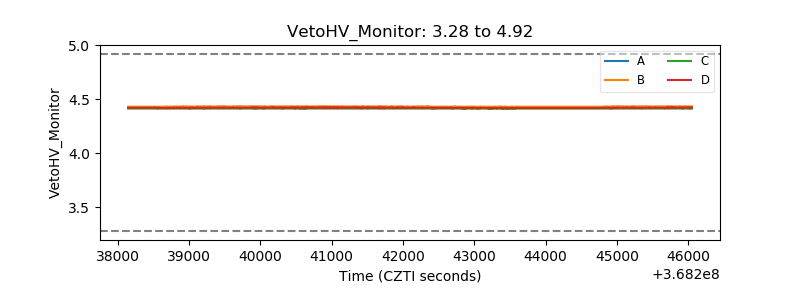 |
| Veto LLD | 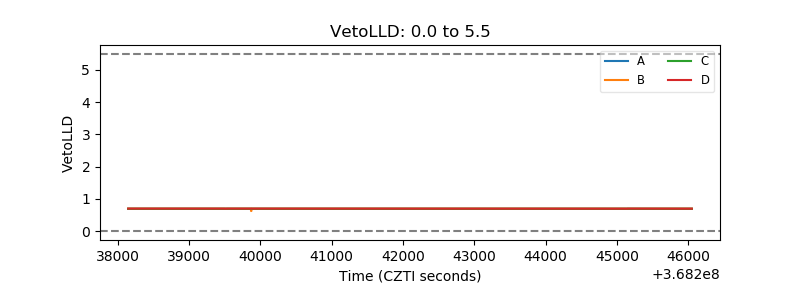 |
| Alpha Counter | 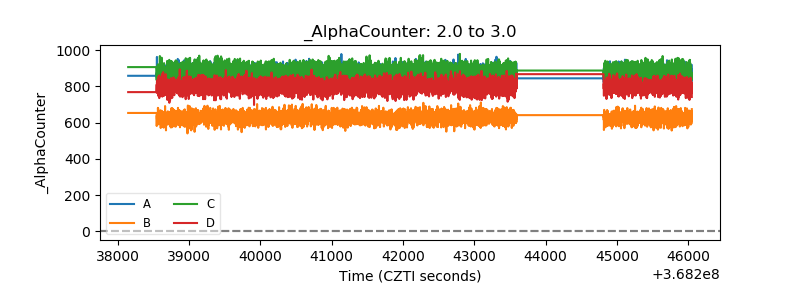 |
| _CPM_Rate | 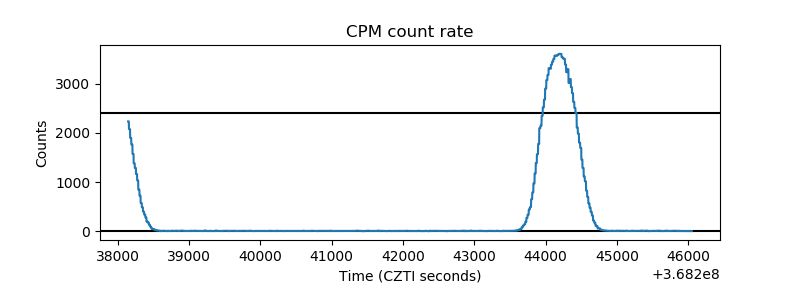 |
| CZT Counter | 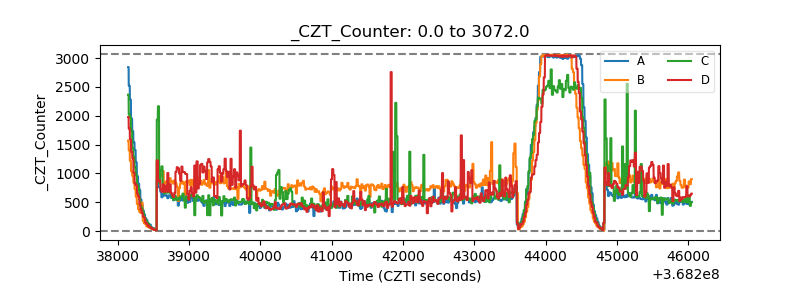 |
| +2.5 Volts monitor |  |
| +5 Volts monitor |  |
| _ROLL_ROT | 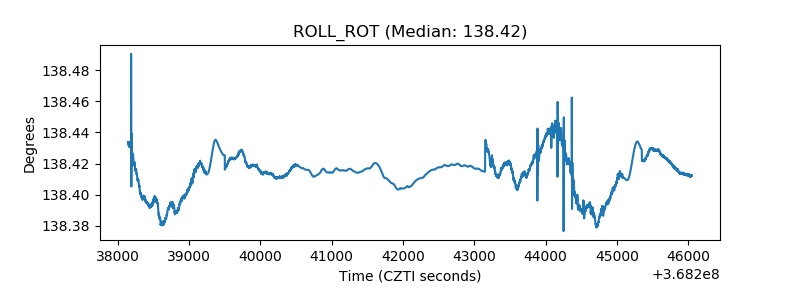 |
| _Roll_DEC |  |
| _Roll_RA | 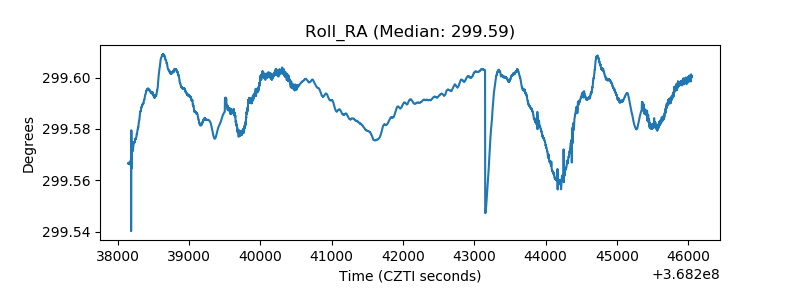 |
| Veto Counter | 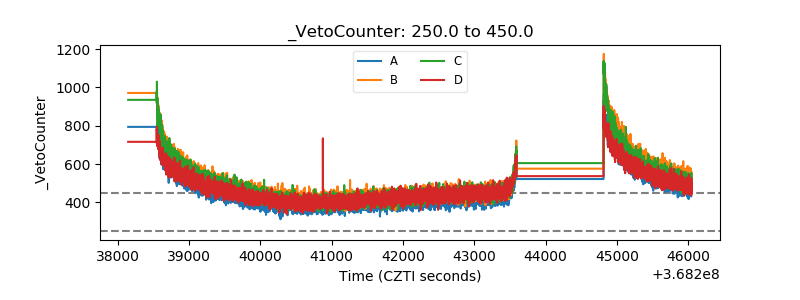 |