| Param | Original file | Final file |
|---|---|---|
| Filename | modeM0/AS1A10_109T01_9000004682_32065cztM0_level2.evt | modeM0/AS1A10_109T01_9000004682_32065cztM0_level2_quad_clean.evt |
| Size (bytes) | 722,721,600 | 119,557,440 |
| Size | 689.2 MB | 114.0 MB |
| Events in quadrant A | 4,065,219 | 813,361 |
| Events in quadrant B | 6,893,319 | 794,679 |
| Events in quadrant C | 4,392,944 | 765,154 |
| Events in quadrant D | 6,019,992 | 716,113 |
| Mode M9 | |||
|---|---|---|---|
| Quadrant | BADHDUFLAG | Total packets | Discarded packets |
| A | 0 | 20 | 0 |
| B | 0 | 20 | 0 |
| C | 0 | 20 | 0 |
| D | 0 | 20 | 0 |
| Mode M0 | |||
|---|---|---|---|
| Quadrant | BADHDUFLAG | Total packets | Discarded packets |
| A | 0 | 16239 | 1 |
| B | 0 | 25650 | 1 |
| C | 0 | 17373 | 1 |
| D | 0 | 22610 | 1 |
| Mode SS | |||
|---|---|---|---|
| Quadrant | BADHDUFLAG | Total packets | Discarded packets |
| A | 0 | 156 | 0 |
| B | 0 | 156 | 0 |
| C | 0 | 156 | 0 |
| D | 0 | 156 | 0 |
| Quadrant | Total seconds | Saturated seconds | Saturation percentage |
|---|---|---|---|
| A | 7642 | 212 | 2.774143% |
| B | 7643 | 473 | 6.188669% |
| C | 7643 | 320 | 4.186838% |
| D | 7643 | 632 | 8.269004% |
Noise dominated data is calculated using 1-second bins in cleaned event files. If a bin has >2000 counts, and if more than 50% of those come from <1% of pixels, then it is considered to be noise-dominated and hence unusable.
| Quadrant | # 1 sec bins | Bins with >0 counts | Bins with >2000 counts | High rate bins dominated by noise | Noise dominated (total time) | Noise dominated (detector-on time) | Marked lightcurve |
|---|---|---|---|---|---|---|---|
| A | 9572 | 7642 | 0 | 0 | 0.00% | 0.00% | 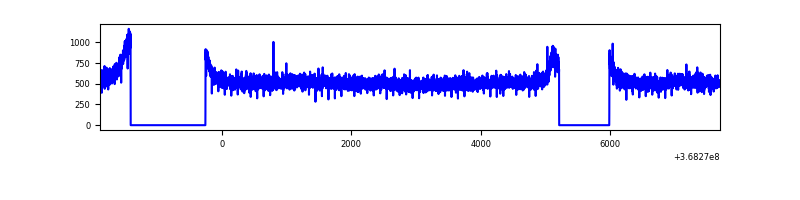 |
| B | 9573 | 7643 | 20 | 20 | 0.21% | 0.26% | 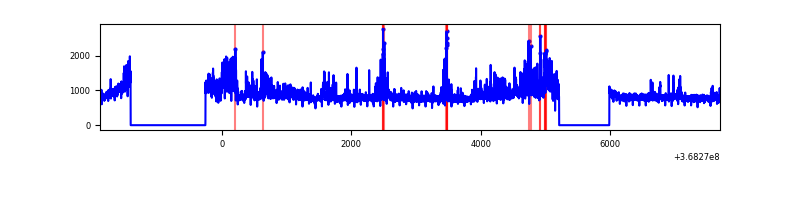 |
| C | 9573 | 7643 | 14 | 14 | 0.15% | 0.18% | 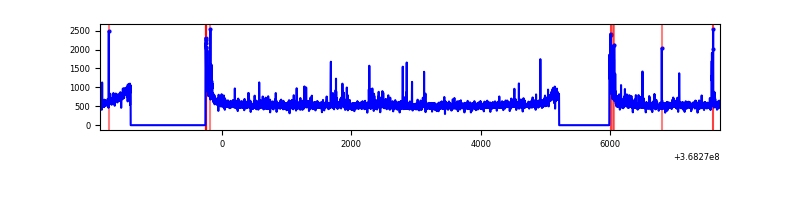 |
| D | 9573 | 7643 | 436 | 436 | 4.55% | 5.70% | 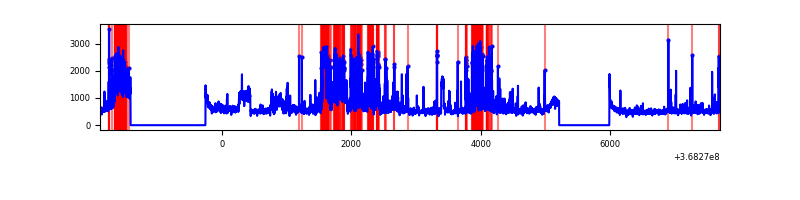 |
Top three noisy pixels from each quadrant. If the there are fewer than three noisy pixels in the level2.evt file, extra rows are filled as -1
| Pixel properties | Quadrant properties | ||||||
|---|---|---|---|---|---|---|---|
| Quadrant | DetID | PixID | Counts | Sigma | Mean | Median | Sigma |
| A | 13 | 254 | 13718 | 60.08 | 1052 | 1033 | 211.1 |
| A | 3 | 137 | 10265 | 43.73 | 1052 | 1033 | 211.1 |
| A | 0 | 226 | 8907 | 37.3 | 1052 | 1033 | 211.1 |
| B | 6 | 159 | 1940580 | 9976.84 | 1019 | 995 | 194.4 |
| B | 10 | 245 | 797303 | 4096.05 | 1019 | 995 | 194.4 |
| B | 5 | 172 | 84256 | 428.28 | 1019 | 995 | 194.4 |
| C | 0 | 10 | 267091 | 1151.46 | 989 | 999 | 231.1 |
| C | 14 | 238 | 161742 | 695.59 | 989 | 999 | 231.1 |
| C | 14 | 225 | 32439 | 136.05 | 989 | 999 | 231.1 |
| D | 2 | 250 | 837098 | 3572.61 | 983 | 958 | 234.0 |
| D | 12 | 233 | 541947 | 2311.5 | 983 | 958 | 234.0 |
| D | 12 | 79 | 413981 | 1764.74 | 983 | 958 | 234.0 |
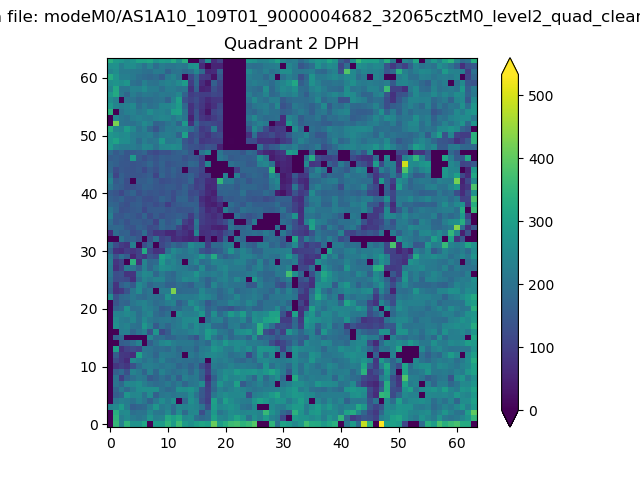
Histogram calculated using DETX and DETY for each event in the final _common_clean file
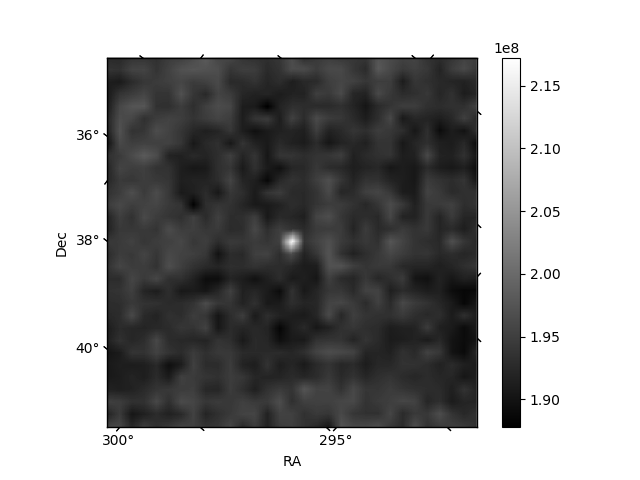
| Quadrant A |  |
 |
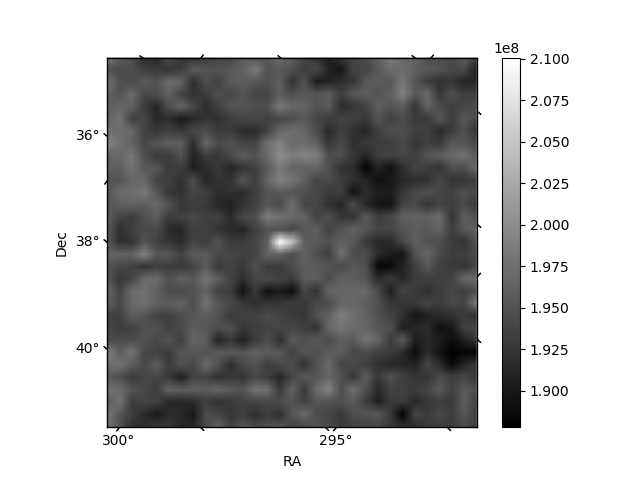
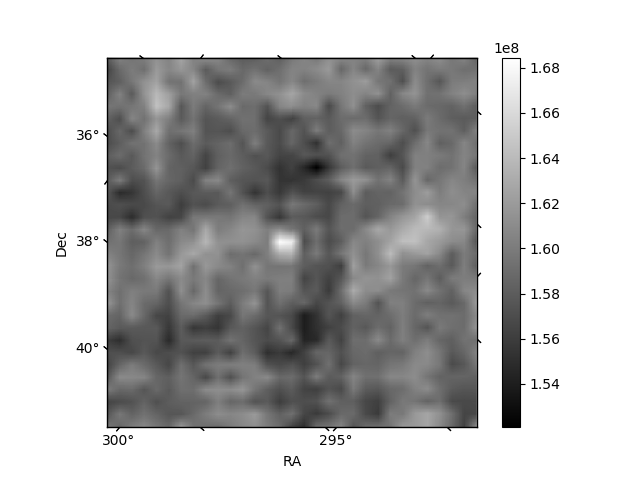
Quadrant B |
|---|---|---|---|
| Quadrant D |  |
 |
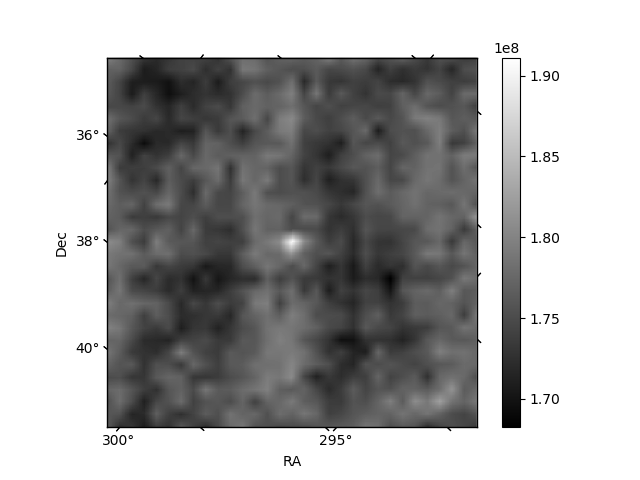
Quadrant C |
| Plot type | Count rate plots | Images |
|---|---|---|
| Comparison with Poisson distribution Blue bars denote a histogram of data divided into 1 sec bins. Red curve is a Poisson curve with rate = median count rate of data. |
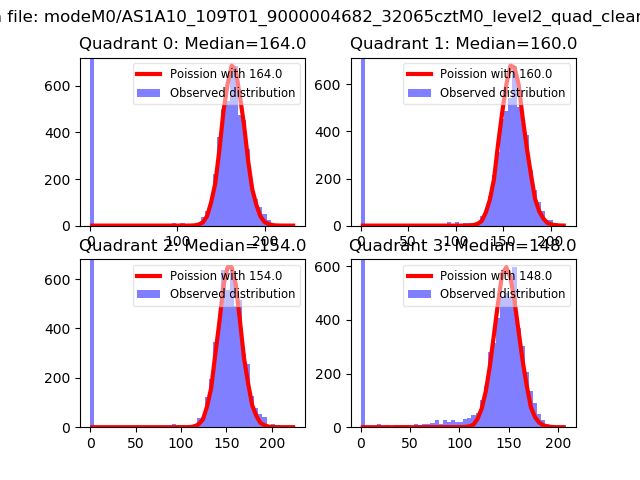 |
 |
| Quadrant-wise count rates Data is divided into 100 sec bins |
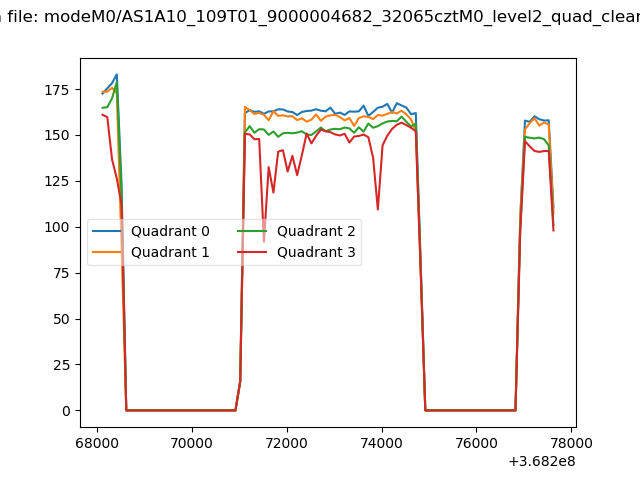 |
|
| Module-wise count rates for Quadrant A Data is divided into 100 sec bins |
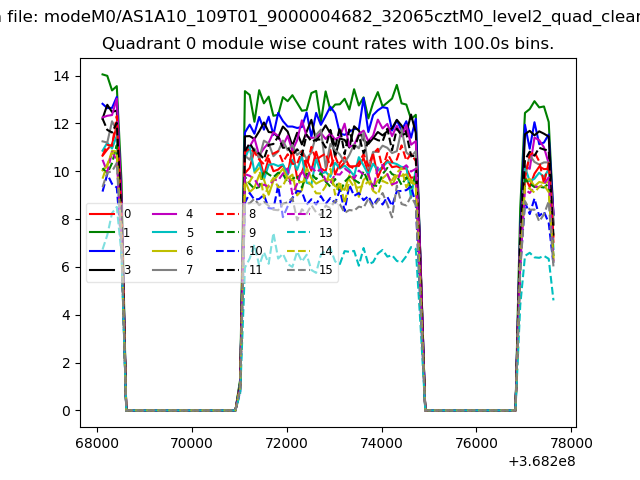 |
 |
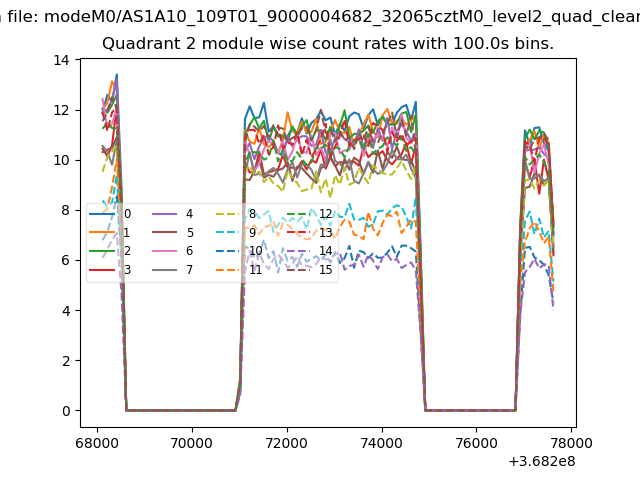
| Module-wise count rates for Quadrant B Data is divided into 100 sec bins |
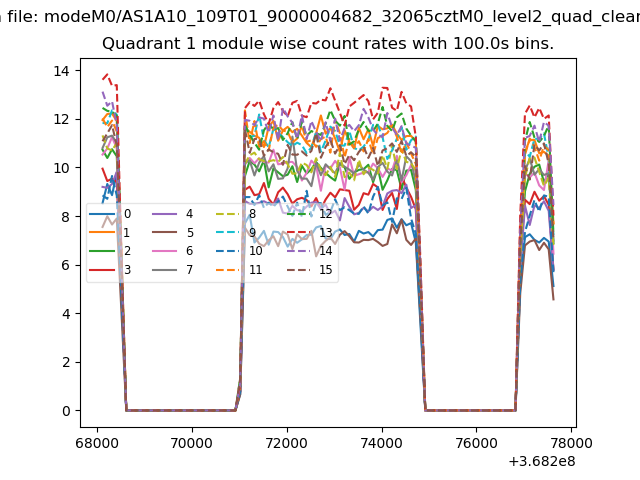 |
 |
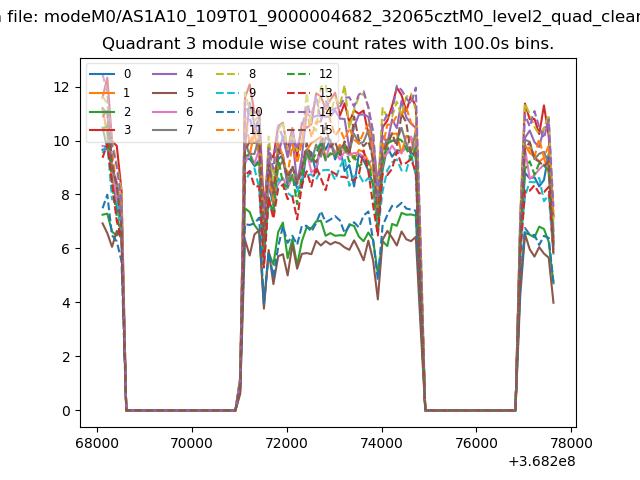
| Module-wise count rates for Quadrant C Data is divided into 100 sec bins |
 |
 |
| Module-wise count rates for Quadrant D Data is divided into 100 sec bins |
 |
 |
| Parameter | Plot |
|---|---|
| CZT HV Monitor | 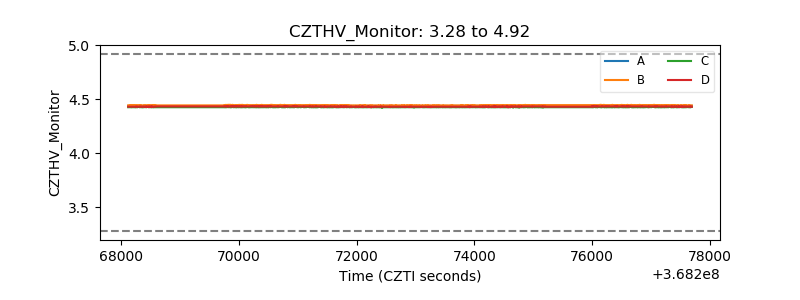 |
| D_VDD | 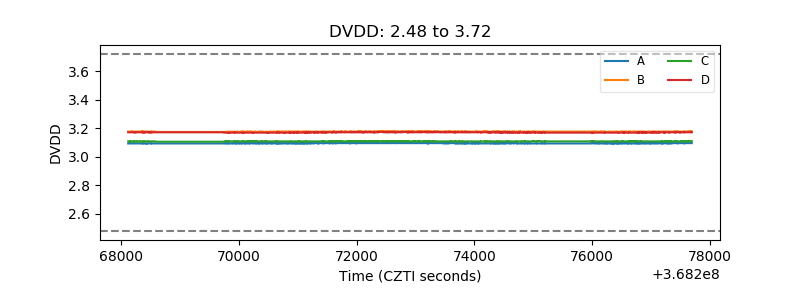 |
| Temperature 1 | 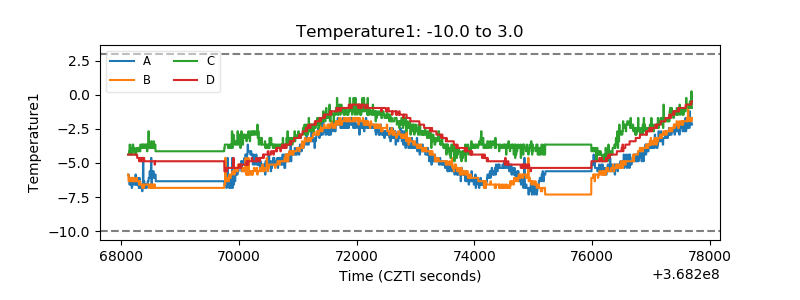 |
| Veto HV Monitor | 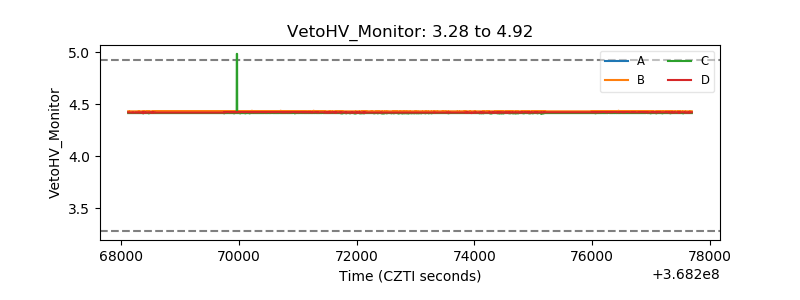 |
| Veto LLD | 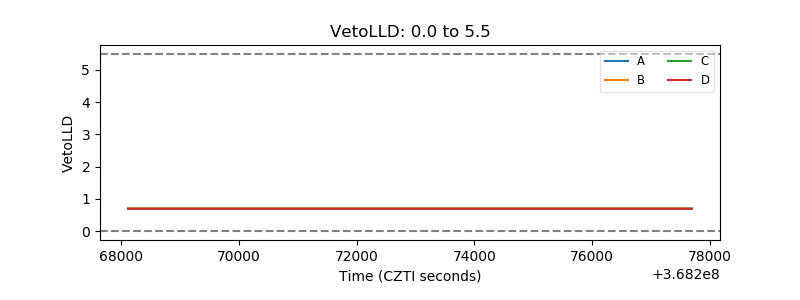 |
| Alpha Counter | 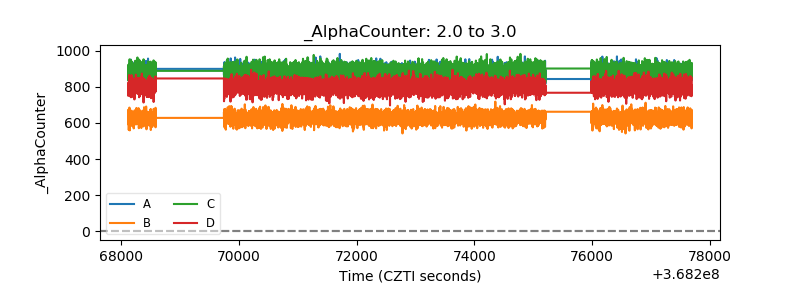 |
| _CPM_Rate | 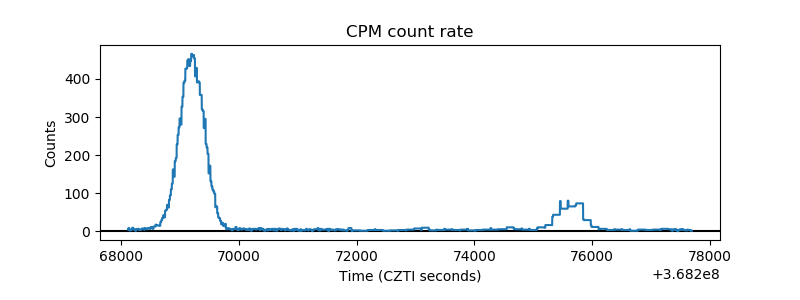 |
| CZT Counter | 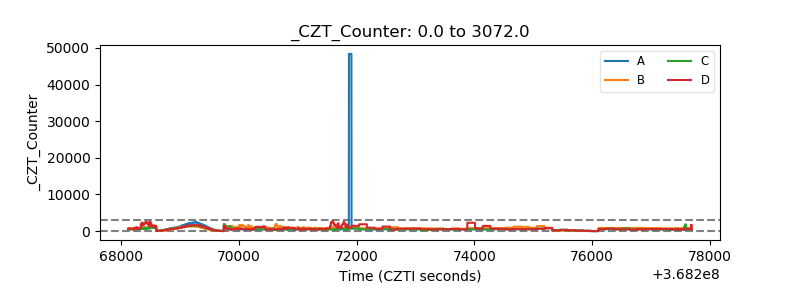 |
| +2.5 Volts monitor |  |
| +5 Volts monitor | 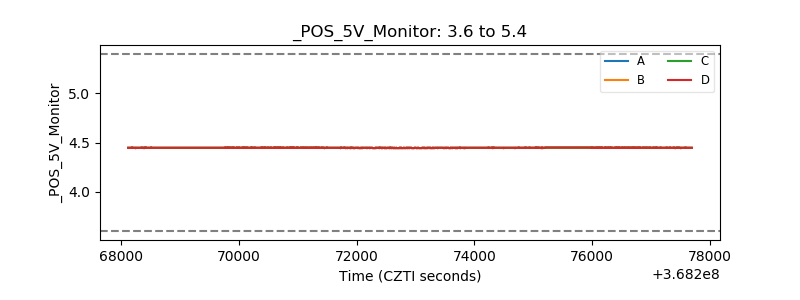 |
| _ROLL_ROT | 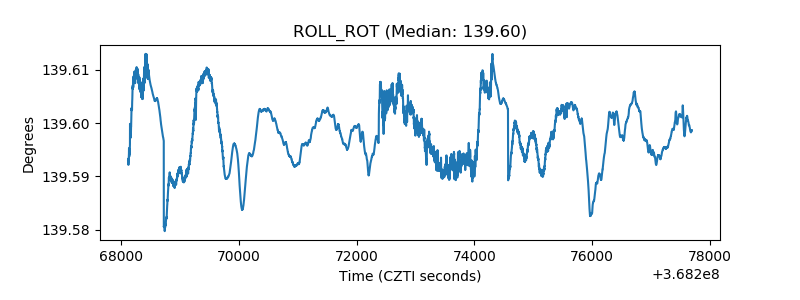 |
| _Roll_DEC | 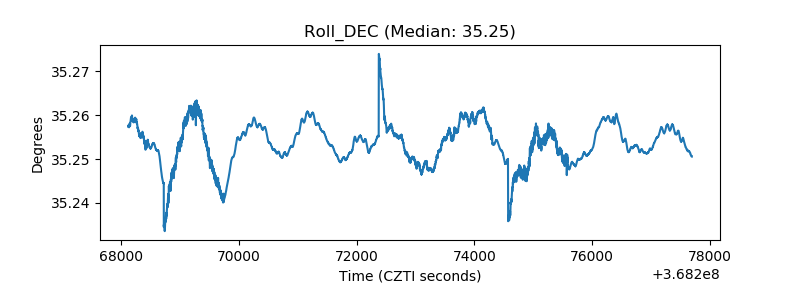 |
| _Roll_RA | 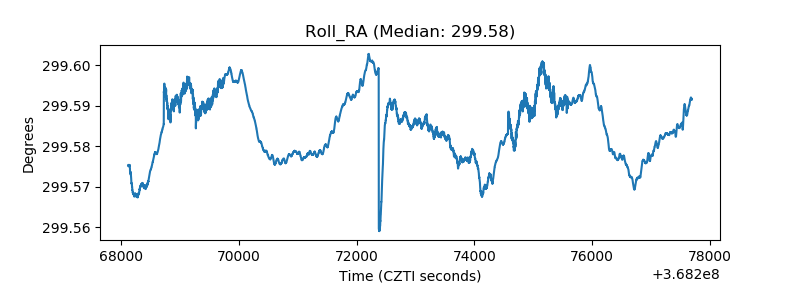 |
| Veto Counter | 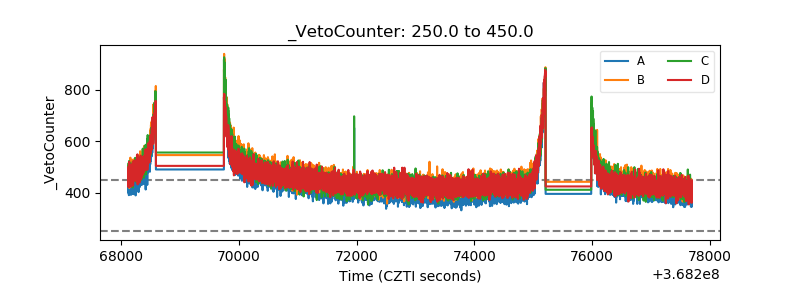 |