| Param | Original file | Final file |
|---|---|---|
| Filename | modeM0/AS1A10_109T01_9000004682_32066cztM0_level2.evt | modeM0/AS1A10_109T01_9000004682_32066cztM0_level2_quad_clean.evt |
| Size (bytes) | 695,473,920 | 113,135,040 |
| Size | 663.3 MB | 107.9 MB |
| Events in quadrant A | 4,033,307 | 752,229 |
| Events in quadrant B | 6,464,072 | 738,776 |
| Events in quadrant C | 4,351,018 | 710,544 |
| Events in quadrant D | 5,683,958 | 679,884 |
| Mode M9 | |||
|---|---|---|---|
| Quadrant | BADHDUFLAG | Total packets | Discarded packets |
| A | 0 | 10 | 0 |
| B | 0 | 10 | 0 |
| C | 0 | 10 | 0 |
| D | 0 | 10 | 0 |
| Mode M0 | |||
|---|---|---|---|
| Quadrant | BADHDUFLAG | Total packets | Discarded packets |
| A | 0 | 16477 | 3 |
| B | 0 | 24636 | 3 |
| C | 0 | 17418 | 3 |
| D | 0 | 21838 | 3 |
| Mode SS | |||
|---|---|---|---|
| Quadrant | BADHDUFLAG | Total packets | Discarded packets |
| A | 0 | 162 | 0 |
| B | 0 | 162 | 0 |
| C | 0 | 162 | 0 |
| D | 0 | 162 | 0 |
| Quadrant | Total seconds | Saturated seconds | Saturation percentage |
|---|---|---|---|
| A | 7832 | 293 | 3.741062% |
| B | 7833 | 498 | 6.357717% |
| C | 7833 | 404 | 5.157666% |
| D | 7833 | 495 | 6.319418% |
Noise dominated data is calculated using 1-second bins in cleaned event files. If a bin has >2000 counts, and if more than 50% of those come from <1% of pixels, then it is considered to be noise-dominated and hence unusable.
| Quadrant | # 1 sec bins | Bins with >0 counts | Bins with >2000 counts | High rate bins dominated by noise | Noise dominated (total time) | Noise dominated (detector-on time) | Marked lightcurve |
|---|---|---|---|---|---|---|---|
| A | 8862 | 7833 | 0 | 0 | 0.00% | 0.00% | 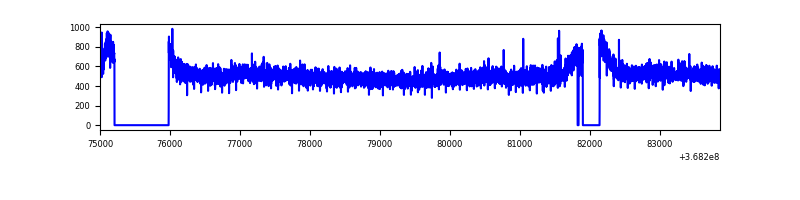 |
| B | 8863 | 7833 | 40 | 40 | 0.45% | 0.51% | 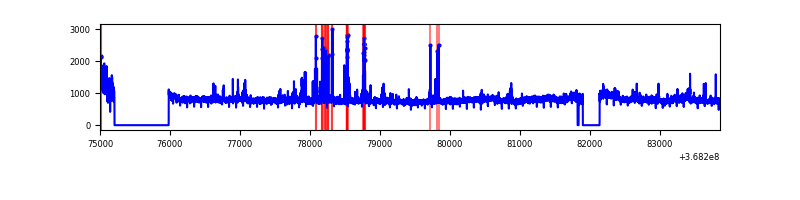 |
| C | 8863 | 7833 | 12 | 12 | 0.14% | 0.15% | 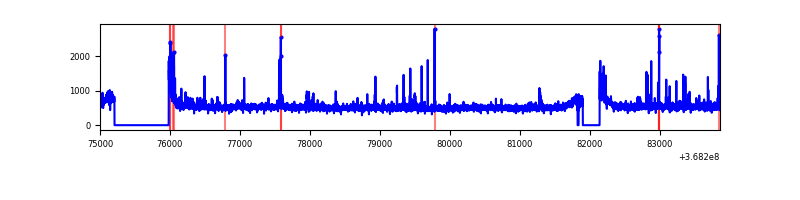 |
| D | 8863 | 7833 | 275 | 275 | 3.10% | 3.51% | 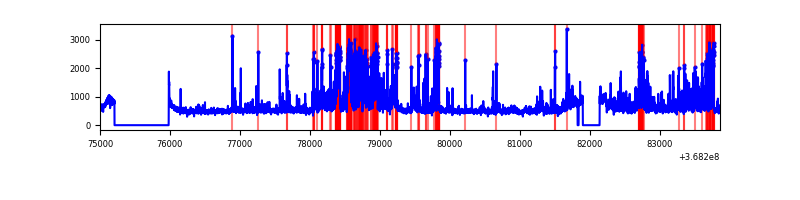 |
Top three noisy pixels from each quadrant. If the there are fewer than three noisy pixels in the level2.evt file, extra rows are filled as -1
| Pixel properties | Quadrant properties | ||||||
|---|---|---|---|---|---|---|---|
| Quadrant | DetID | PixID | Counts | Sigma | Mean | Median | Sigma |
| A | 13 | 254 | 14202 | 63.06 | 1040 | 1019 | 209.1 |
| A | 15 | 174 | 13793 | 61.1 | 1040 | 1019 | 209.1 |
| A | 3 | 137 | 10361 | 44.68 | 1040 | 1019 | 209.1 |
| B | 6 | 159 | 2055849 | 10532.05 | 1010 | 984 | 195.1 |
| B | 10 | 245 | 157584 | 802.64 | 1010 | 984 | 195.1 |
| B | 5 | 172 | 128323 | 652.67 | 1010 | 984 | 195.1 |
| C | 0 | 10 | 221995 | 958.95 | 985 | 993 | 230.5 |
| C | 14 | 238 | 159144 | 686.23 | 985 | 993 | 230.5 |
| C | 14 | 225 | 46847 | 198.96 | 985 | 993 | 230.5 |
| D | 12 | 227 | 1193390 | 5033.56 | 994 | 969 | 236.9 |
| D | 12 | 233 | 276415 | 1162.74 | 994 | 969 | 236.9 |
| D | 8 | 195 | 257609 | 1083.35 | 994 | 969 | 236.9 |
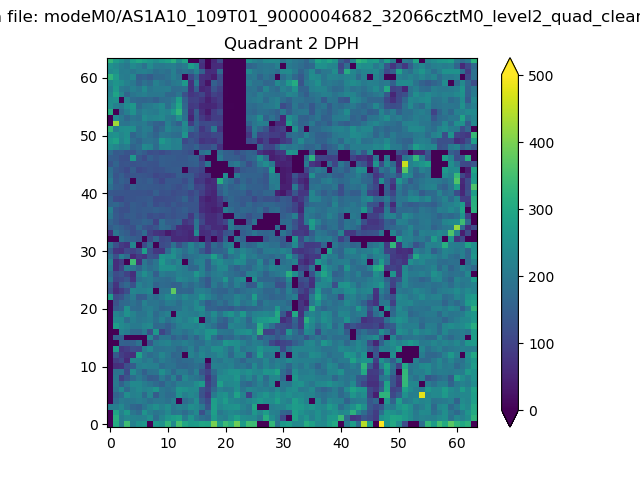
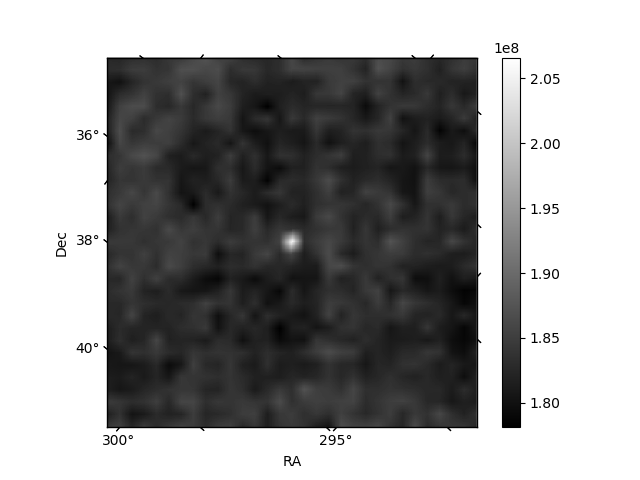
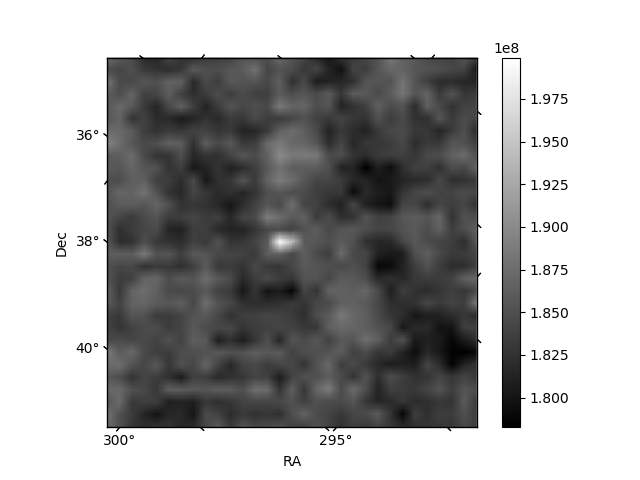
Histogram calculated using DETX and DETY for each event in the final _common_clean file
| Quadrant A |  |
 |
Quadrant B |
|---|---|---|---|
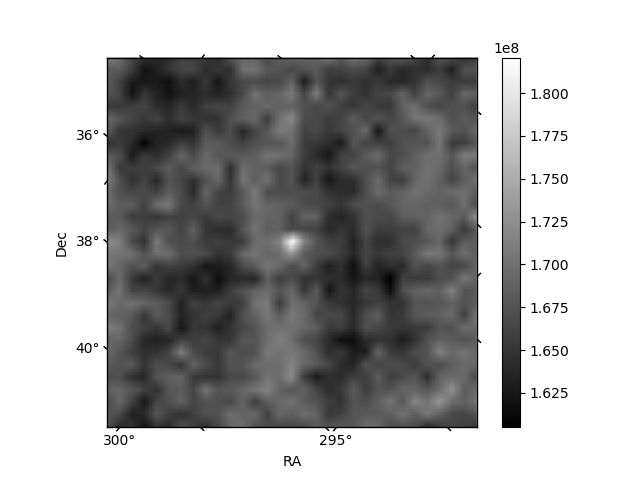
| Quadrant D |  |
 |
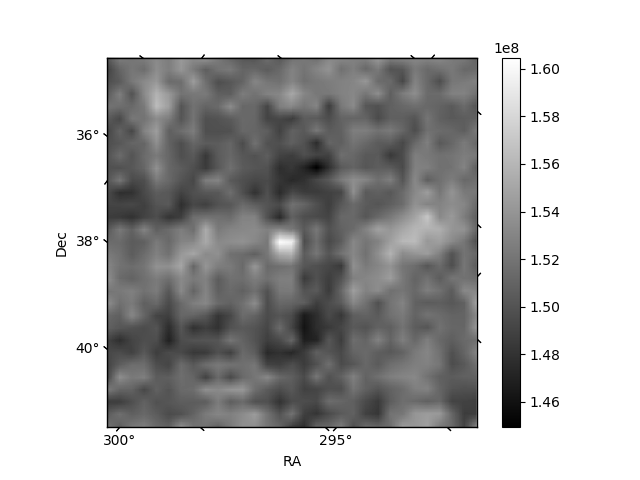
Quadrant C |
| Plot type | Count rate plots | Images |
|---|---|---|
| Comparison with Poisson distribution Blue bars denote a histogram of data divided into 1 sec bins. Red curve is a Poisson curve with rate = median count rate of data. |
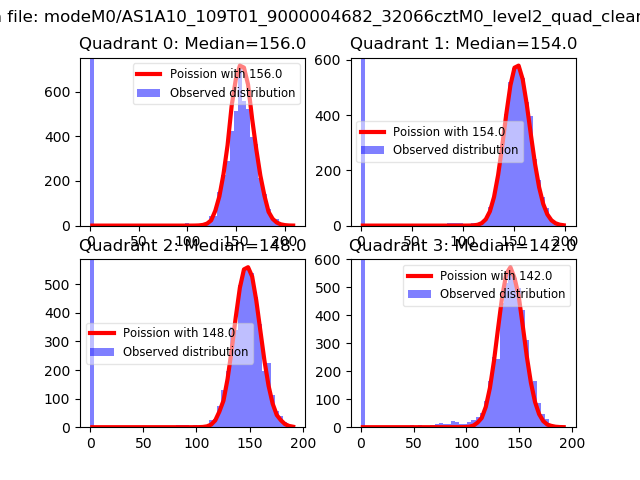 |
 |
| Quadrant-wise count rates Data is divided into 100 sec bins |
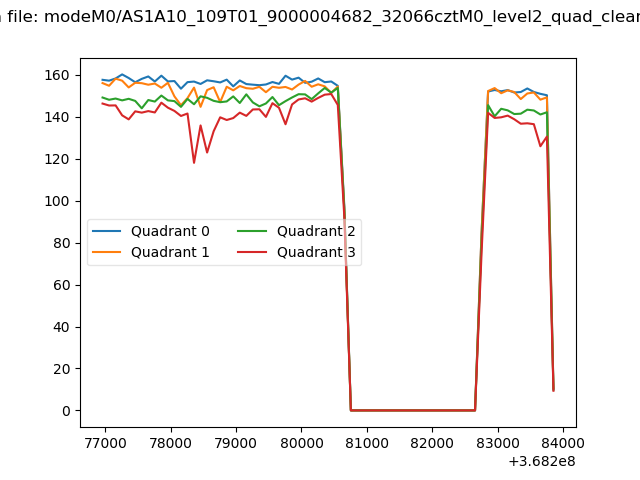 |
|
| Module-wise count rates for Quadrant A Data is divided into 100 sec bins |
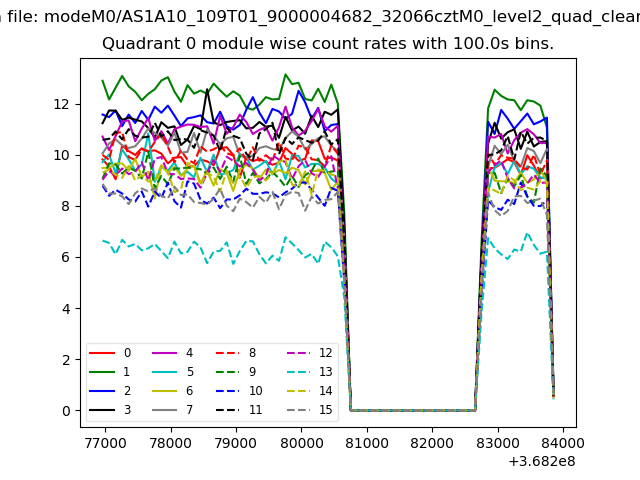 |
 |
| Module-wise count rates for Quadrant B Data is divided into 100 sec bins |
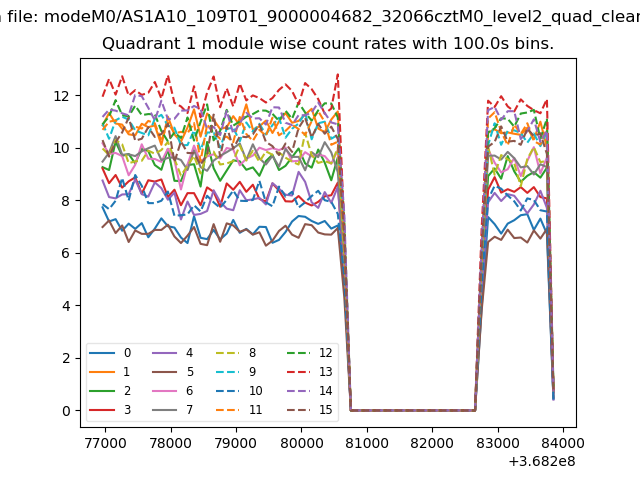 |
 |
| Module-wise count rates for Quadrant C Data is divided into 100 sec bins |
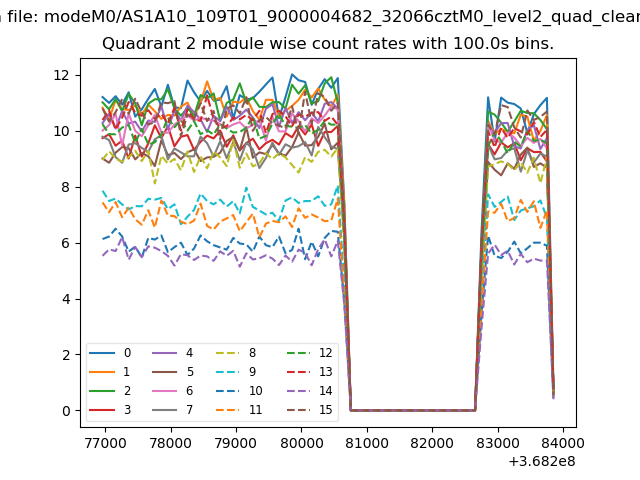 |
 |
| Module-wise count rates for Quadrant D Data is divided into 100 sec bins |
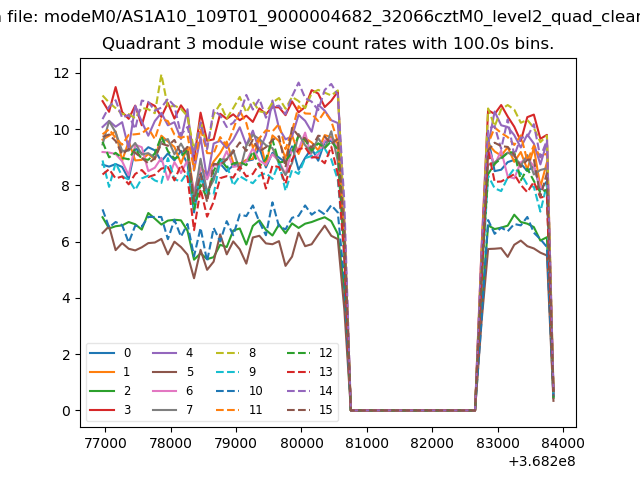 |
 |
| Parameter | Plot |
|---|---|
| CZT HV Monitor | 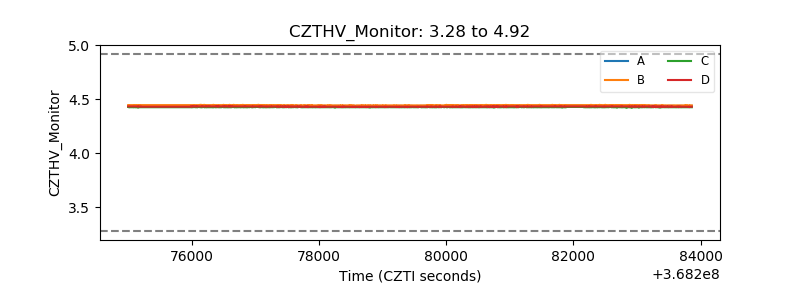 |
| D_VDD |  |
| Temperature 1 | 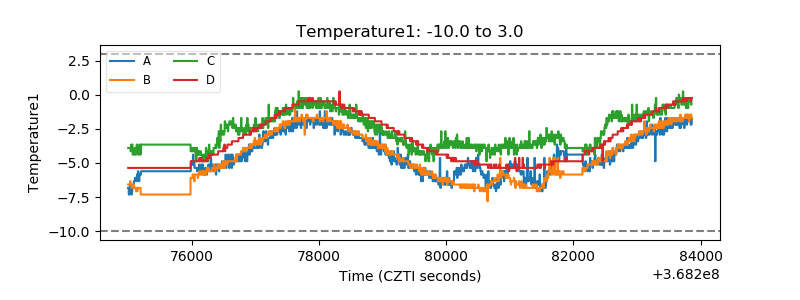 |
| Veto HV Monitor | 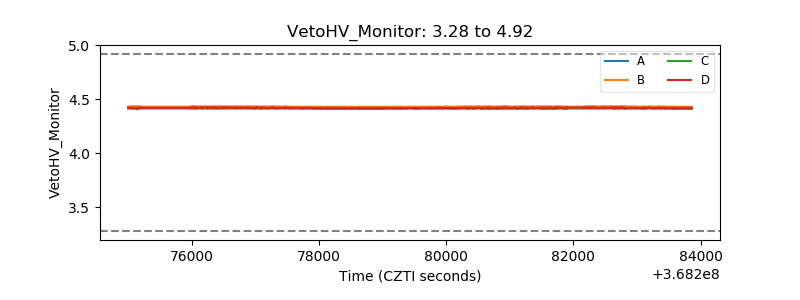 |
| Veto LLD | 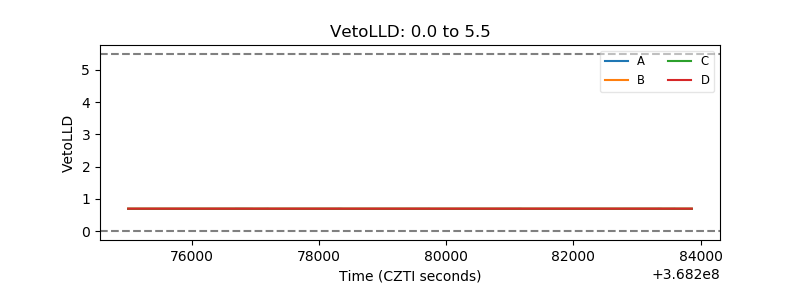 |
| Alpha Counter | 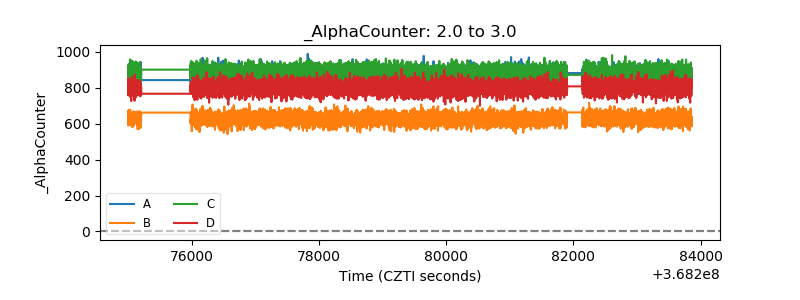 |
| _CPM_Rate | 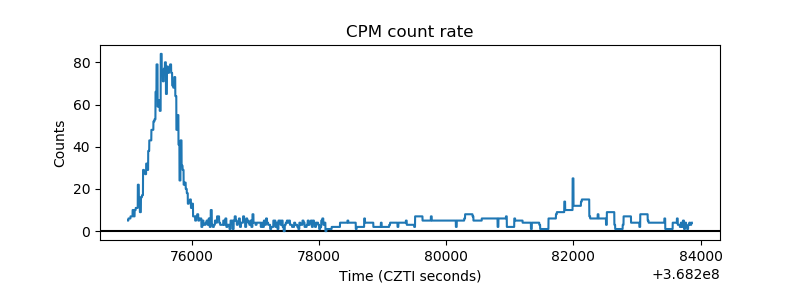 |
| CZT Counter | 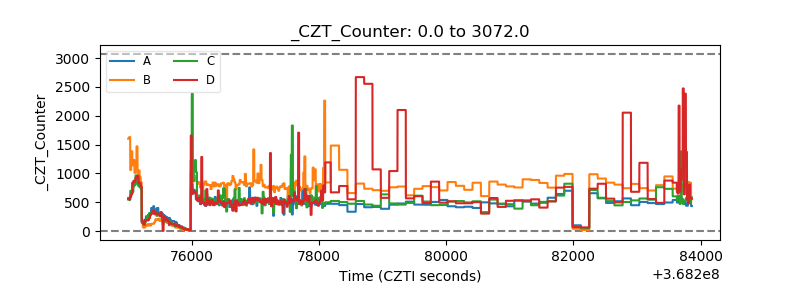 |
| +2.5 Volts monitor |  |
| +5 Volts monitor | 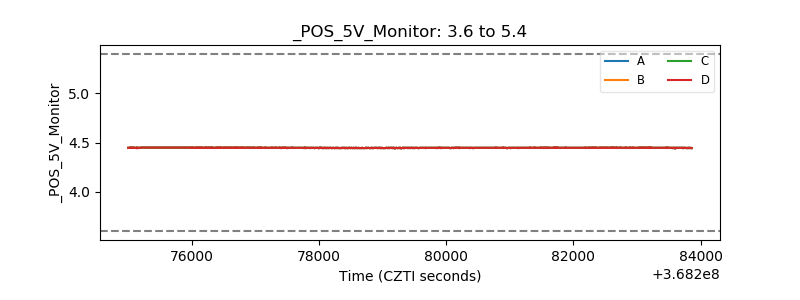 |
| _ROLL_ROT | 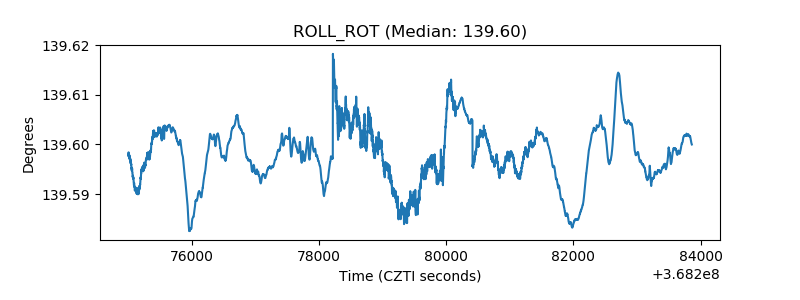 |
| _Roll_DEC | 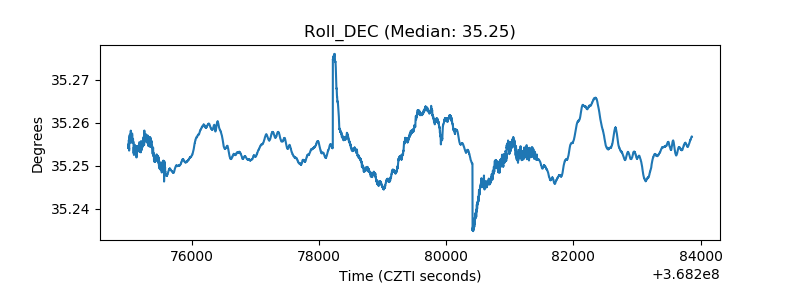 |
| _Roll_RA | 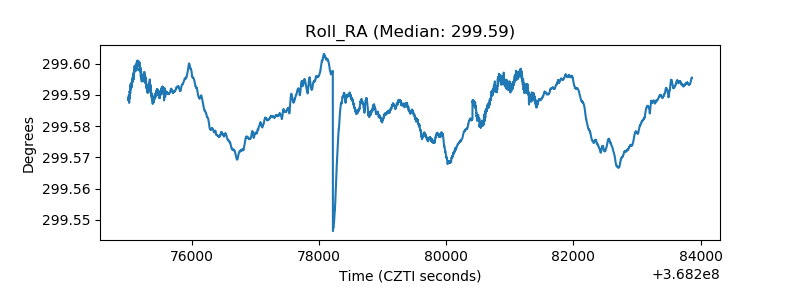 |
| Veto Counter | 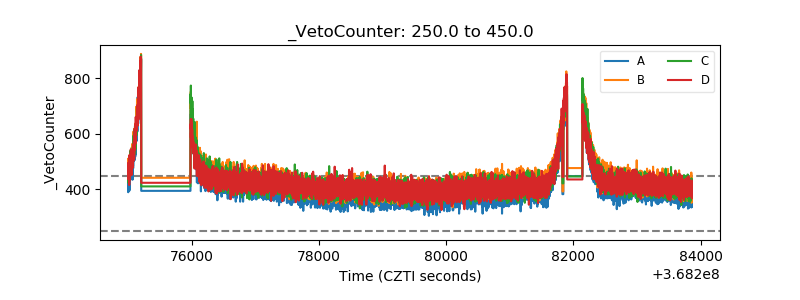 |