| Param | Original file | Final file |
|---|---|---|
| Filename | modeM0/AS1A10_109T01_9000004682_32068cztM0_level2.evt | modeM0/AS1A10_109T01_9000004682_32068cztM0_level2_quad_clean.evt |
| Size (bytes) | 603,483,840 | 112,872,960 |
| Size | 575.5 MB | 107.6 MB |
| Events in quadrant A | 3,565,519 | 758,487 |
| Events in quadrant B | 5,831,225 | 741,509 |
| Events in quadrant C | 3,929,624 | 716,753 |
| Events in quadrant D | 4,462,514 | 700,087 |
| Mode M9 | |||
|---|---|---|---|
| Quadrant | BADHDUFLAG | Total packets | Discarded packets |
| A | 0 | 3 | 0 |
| B | 0 | 3 | 0 |
| C | 0 | 3 | 0 |
| D | 0 | 3 | 0 |
| Mode M0 | |||
|---|---|---|---|
| Quadrant | BADHDUFLAG | Total packets | Discarded packets |
| A | 0 | 14973 | 5 |
| B | 0 | 22517 | 1 |
| C | 0 | 15959 | 2 |
| D | 0 | 17860 | 1 |
| Mode SS | |||
|---|---|---|---|
| Quadrant | BADHDUFLAG | Total packets | Discarded packets |
| A | 0 | 146 | 0 |
| B | 0 | 146 | 0 |
| C | 0 | 146 | 0 |
| D | 0 | 146 | 0 |
| Quadrant | Total seconds | Saturated seconds | Saturation percentage |
|---|---|---|---|
| A | 7203 | 90 | 1.249479% |
| B | 7205 | 249 | 3.455933% |
| C | 7204 | 248 | 3.442532% |
| D | 7205 | 168 | 2.331714% |
Noise dominated data is calculated using 1-second bins in cleaned event files. If a bin has >2000 counts, and if more than 50% of those come from <1% of pixels, then it is considered to be noise-dominated and hence unusable.
| Quadrant | # 1 sec bins | Bins with >0 counts | Bins with >2000 counts | High rate bins dominated by noise | Noise dominated (total time) | Noise dominated (detector-on time) | Marked lightcurve |
|---|---|---|---|---|---|---|---|
| A | 7485 | 7205 | 0 | 0 | 0.00% | 0.00% | 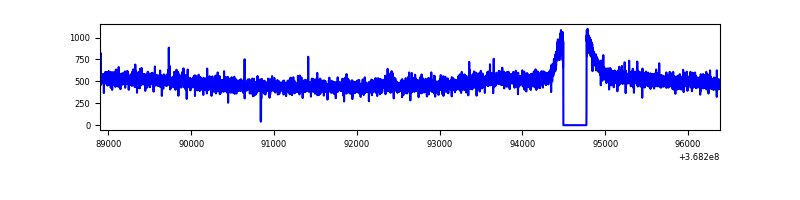 |
| B | 7485 | 7205 | 54 | 54 | 0.72% | 0.75% | 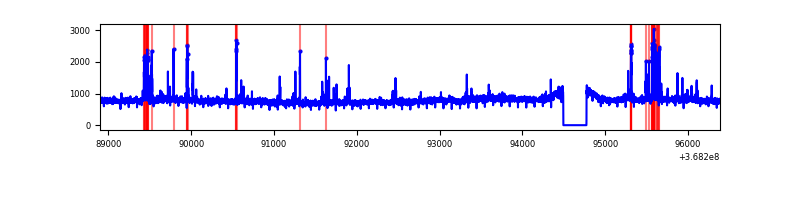 |
| C | 7484 | 7204 | 13 | 13 | 0.17% | 0.18% | 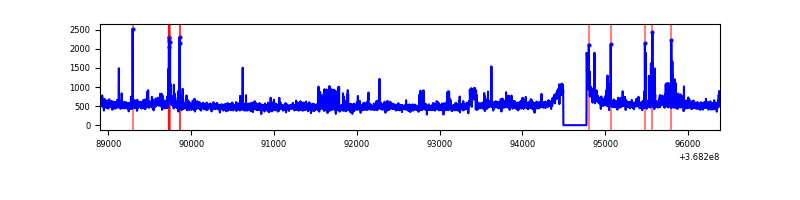 |
| D | 7485 | 7205 | 72 | 72 | 0.96% | 1.00% | 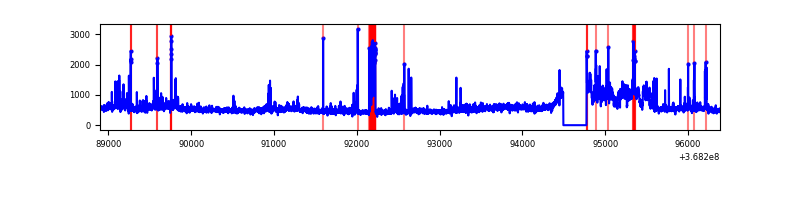 |
Top three noisy pixels from each quadrant. If the there are fewer than three noisy pixels in the level2.evt file, extra rows are filled as -1
| Pixel properties | Quadrant properties | ||||||
|---|---|---|---|---|---|---|---|
| Quadrant | DetID | PixID | Counts | Sigma | Mean | Median | Sigma |
| A | 13 | 254 | 13991 | 70.46 | 921 | 905 | 185.7 |
| A | 13 | 6 | 12418 | 61.99 | 921 | 905 | 185.7 |
| A | 3 | 137 | 9137 | 44.33 | 921 | 905 | 185.7 |
| B | 6 | 159 | 1917576 | 11033.74 | 898 | 876 | 173.7 |
| B | 5 | 172 | 209357 | 1200.15 | 898 | 876 | 173.7 |
| B | 10 | 245 | 109638 | 626.1 | 898 | 876 | 173.7 |
| C | 14 | 238 | 181052 | 880.15 | 873 | 881 | 204.7 |
| C | 0 | 10 | 126498 | 613.65 | 873 | 881 | 204.7 |
| C | 12 | 249 | 80130 | 387.14 | 873 | 881 | 204.7 |
| D | 8 | 195 | 638244 | 2973.92 | 888 | 865 | 214.3 |
| D | 2 | 250 | 188139 | 873.79 | 888 | 865 | 214.3 |
| D | 7 | 238 | 66524 | 306.35 | 888 | 865 | 214.3 |
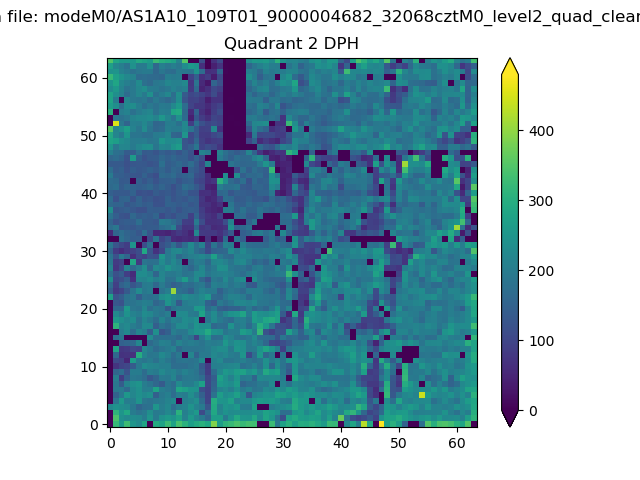
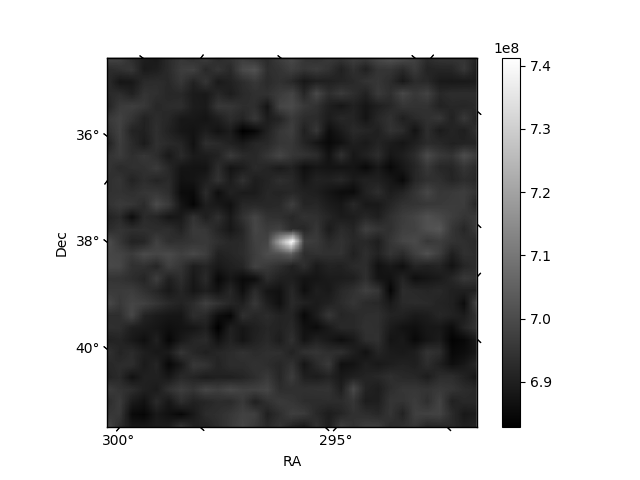
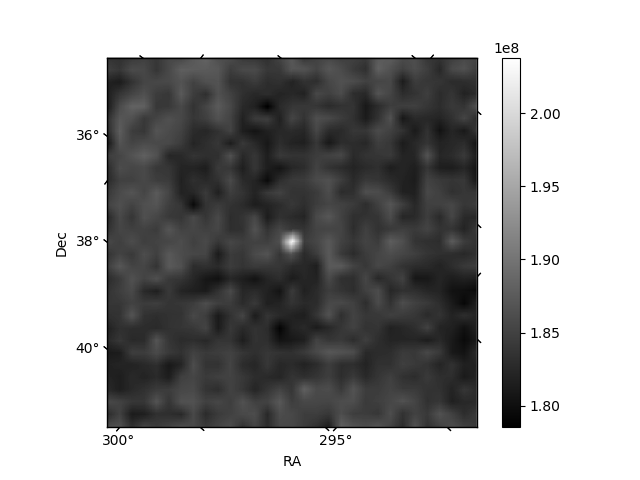
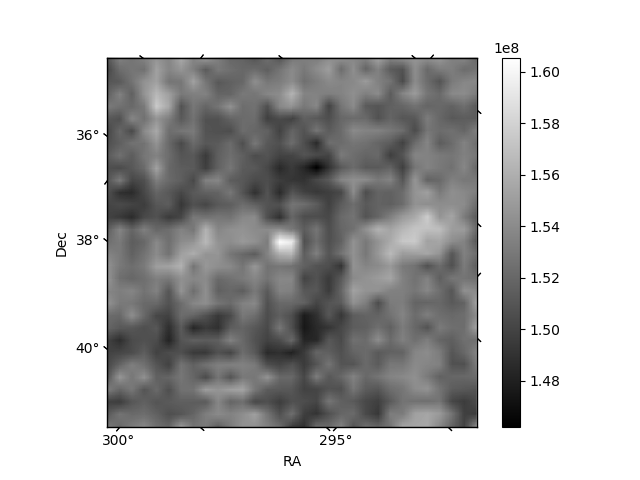
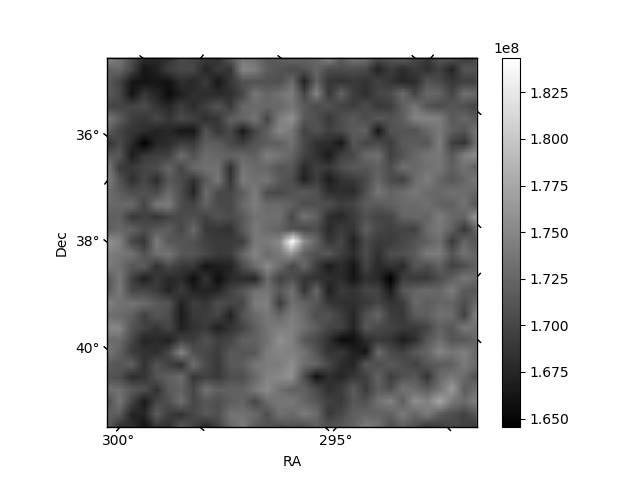
Histogram calculated using DETX and DETY for each event in the final _common_clean file
| Quadrant A | 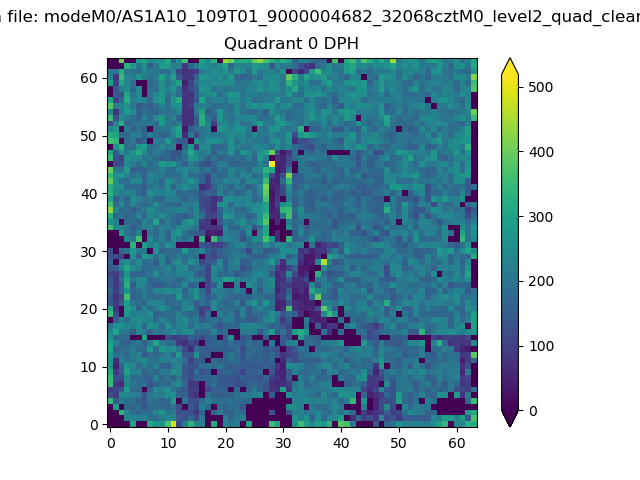 |
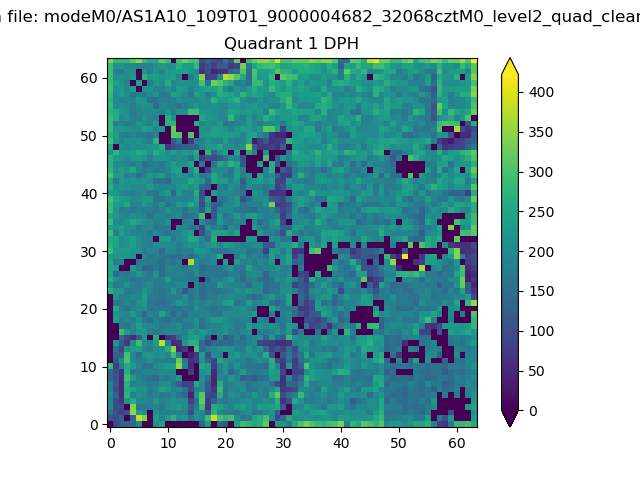 |
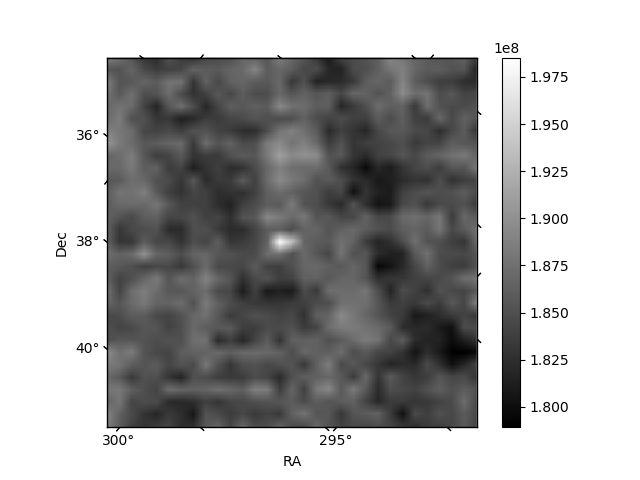
Quadrant B |
|---|---|---|---|
| Quadrant D | 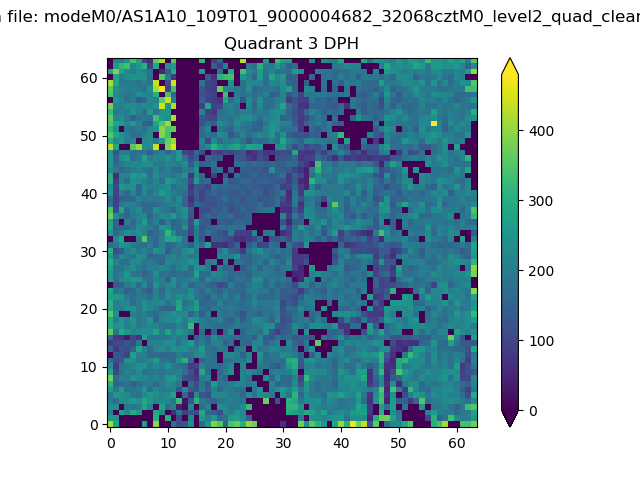 |
 |
Quadrant C |
| Plot type | Count rate plots | Images |
|---|---|---|
| Comparison with Poisson distribution Blue bars denote a histogram of data divided into 1 sec bins. Red curve is a Poisson curve with rate = median count rate of data. |
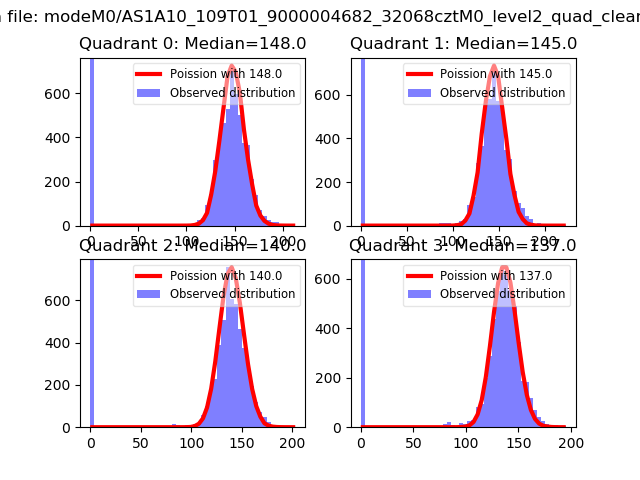 |
 |
| Quadrant-wise count rates Data is divided into 100 sec bins |
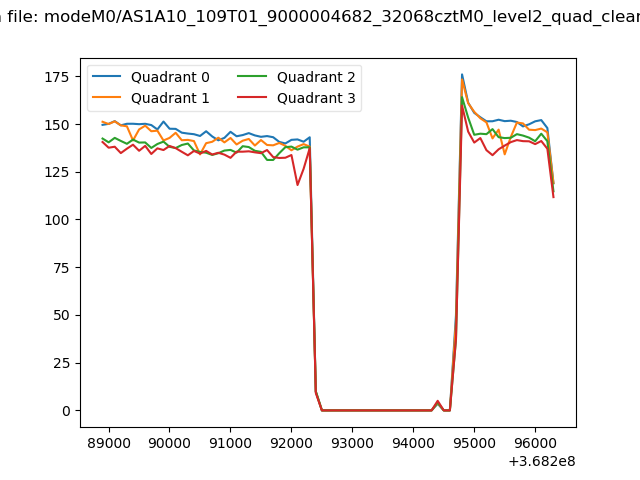 |
|
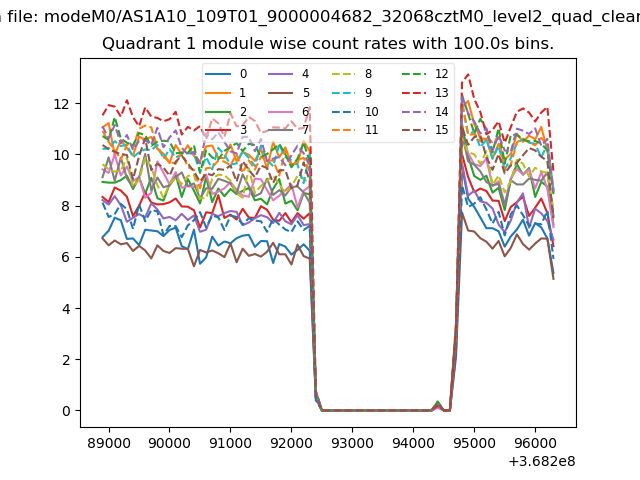
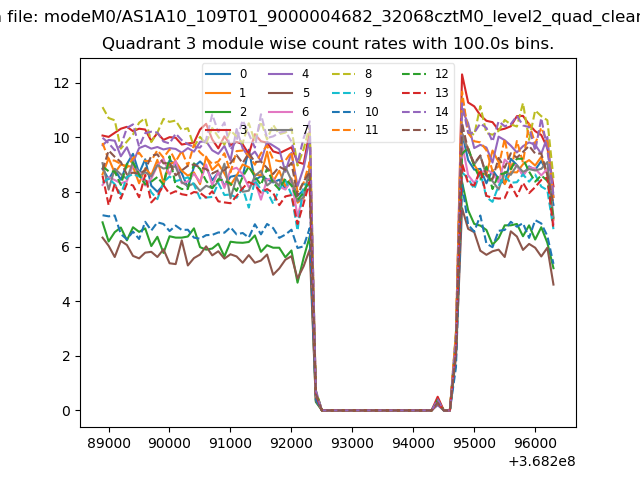
| Module-wise count rates for Quadrant A Data is divided into 100 sec bins |
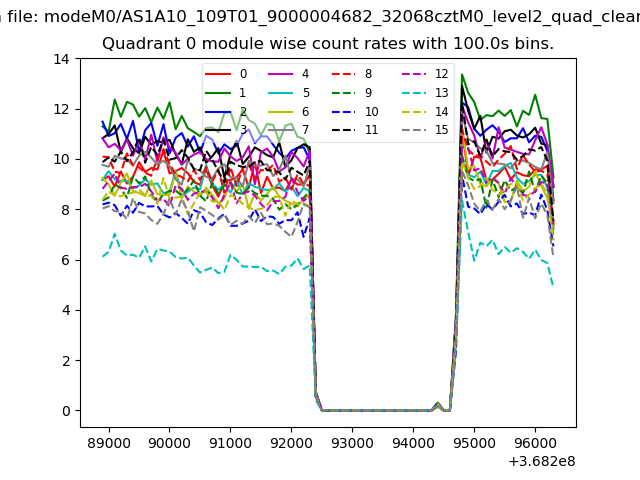 |
 |
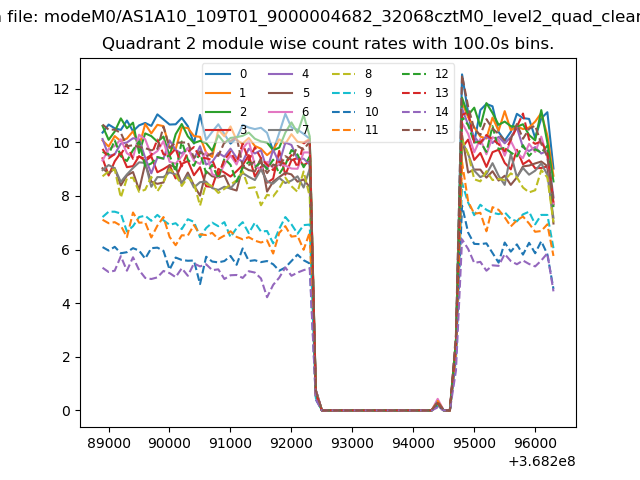
| Module-wise count rates for Quadrant B Data is divided into 100 sec bins |
 |
 |
| Module-wise count rates for Quadrant C Data is divided into 100 sec bins |
 |
 |
| Module-wise count rates for Quadrant D Data is divided into 100 sec bins |
 |
 |
| Parameter | Plot |
|---|---|
| CZT HV Monitor | 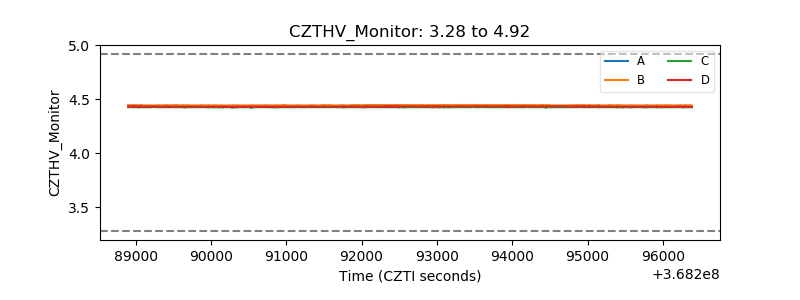 |
| D_VDD |  |
| Temperature 1 | 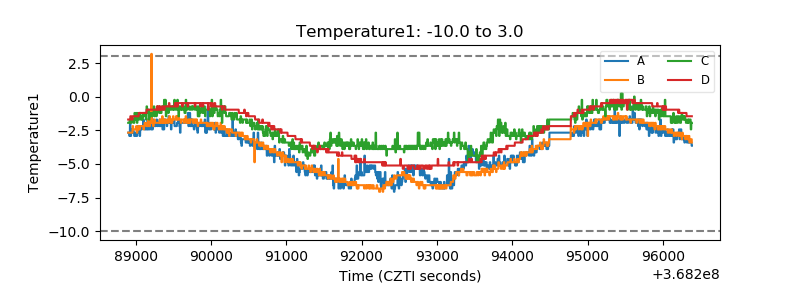 |
| Veto HV Monitor | 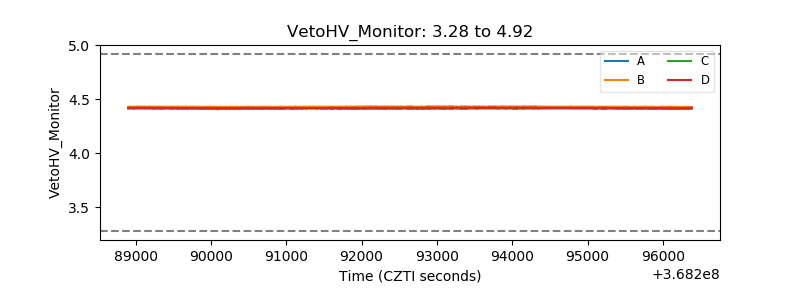 |
| Veto LLD | 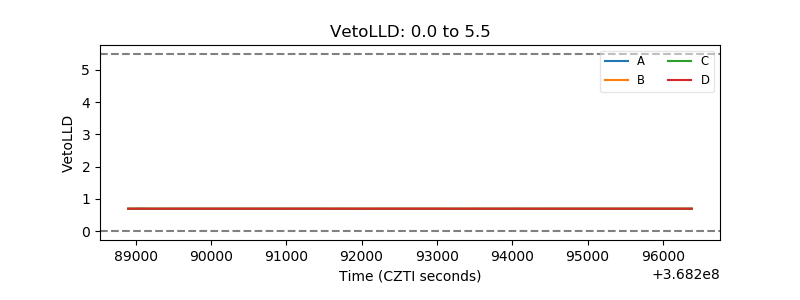 |
| Alpha Counter | 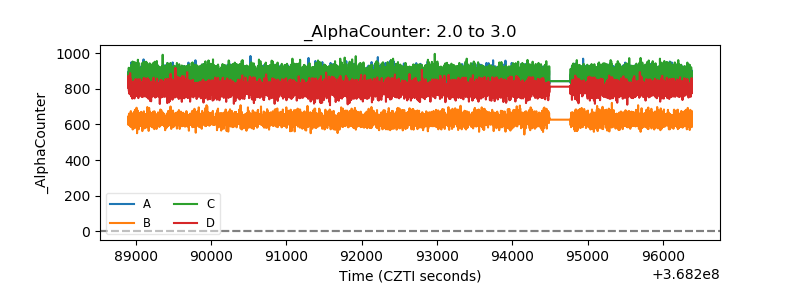 |
| _CPM_Rate | 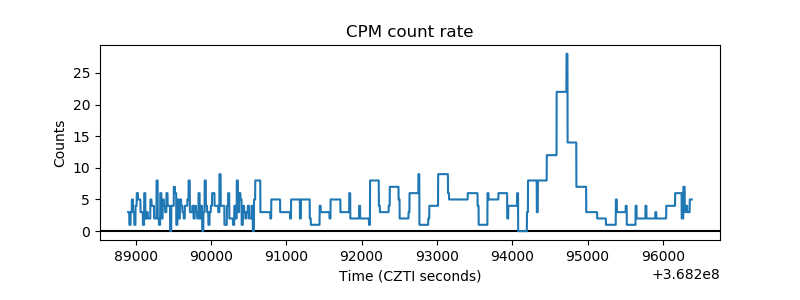 |
| CZT Counter | 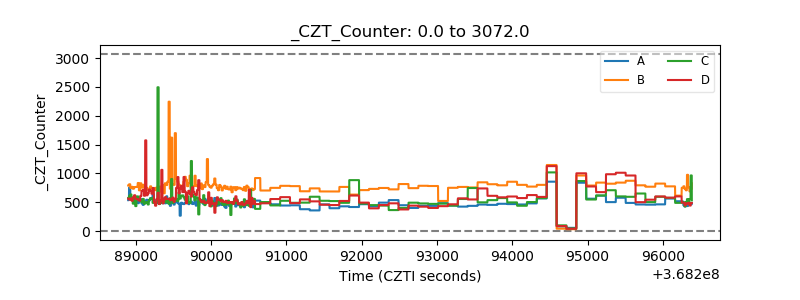 |
| +2.5 Volts monitor |  |
| +5 Volts monitor |  |
| _ROLL_ROT | 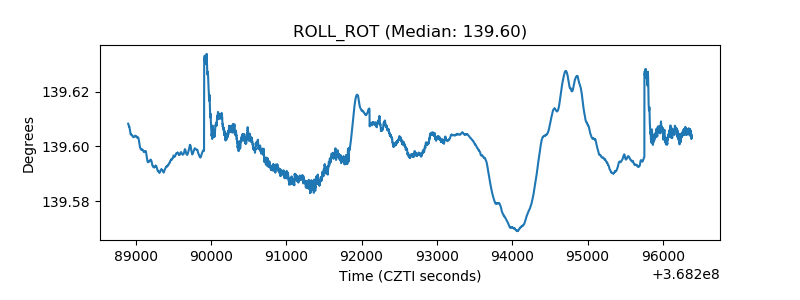 |
| _Roll_DEC |  |
| _Roll_RA | 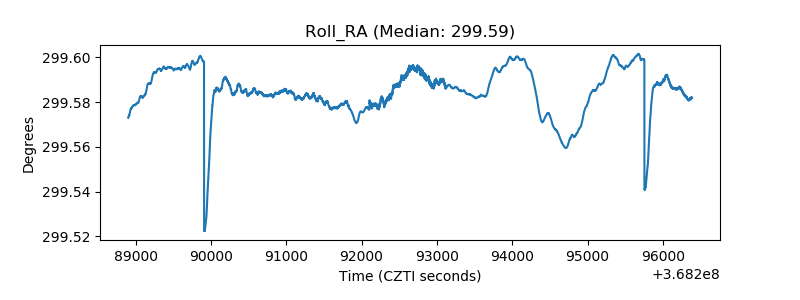 |
| Veto Counter | 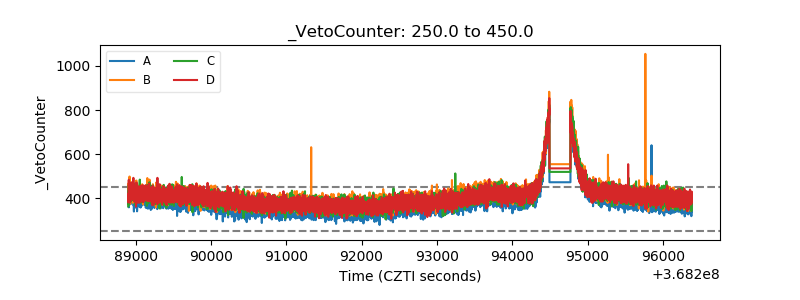 |