| Param | Original file | Final file |
|---|---|---|
| Filename | modeM0/AS1A10_109T01_9000004682_32070cztM0_level2.evt | modeM0/AS1A10_109T01_9000004682_32070cztM0_level2_quad_clean.evt |
| Size (bytes) | 1,165,665,600 | 194,829,120 |
| Size | 1.1 GB | 185.8 MB |
| Events in quadrant A | 6,369,217 | 1,312,567 |
| Events in quadrant B | 10,577,032 | 1,281,703 |
| Events in quadrant C | 7,467,397 | 1,219,019 |
| Events in quadrant D | 10,011,225 | 1,187,800 |
| Mode M9 | |||
|---|---|---|---|
| Quadrant | BADHDUFLAG | Total packets | Discarded packets |
| A | 0 | 12 | 0 |
| B | 0 | 13 | 0 |
| C | 0 | 13 | 0 |
| D | 0 | 13 | 0 |
| Mode M0 | |||
|---|---|---|---|
| Quadrant | BADHDUFLAG | Total packets | Discarded packets |
| A | 0 | 27167 | 3 |
| B | 0 | 40773 | 3 |
| C | 0 | 30420 | 3 |
| D | 0 | 38491 | 3 |
| Mode SS | |||
|---|---|---|---|
| Quadrant | BADHDUFLAG | Total packets | Discarded packets |
| A | 0 | 264 | 0 |
| B | 0 | 264 | 0 |
| C | 0 | 264 | 0 |
| D | 0 | 264 | 0 |
| Quadrant | Total seconds | Saturated seconds | Saturation percentage |
|---|---|---|---|
| A | 13017 | 139 | 1.067834% |
| B | 13017 | 382 | 2.934624% |
| C | 13017 | 871 | 6.691250% |
| D | 13017 | 696 | 5.346854% |
Noise dominated data is calculated using 1-second bins in cleaned event files. If a bin has >2000 counts, and if more than 50% of those come from <1% of pixels, then it is considered to be noise-dominated and hence unusable.
| Quadrant | # 1 sec bins | Bins with >0 counts | Bins with >2000 counts | High rate bins dominated by noise | Noise dominated (total time) | Noise dominated (detector-on time) | Marked lightcurve |
|---|---|---|---|---|---|---|---|
| A | 14217 | 13017 | 0 | 0 | 0.00% | 0.00% | 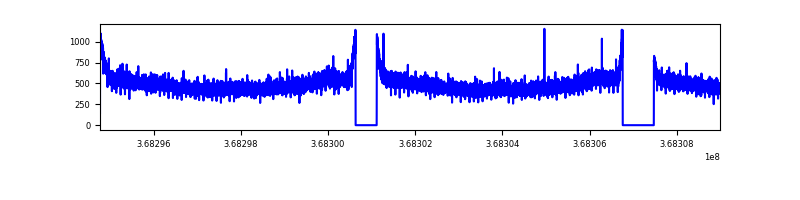 |
| B | 14217 | 13017 | 88 | 88 | 0.62% | 0.68% | 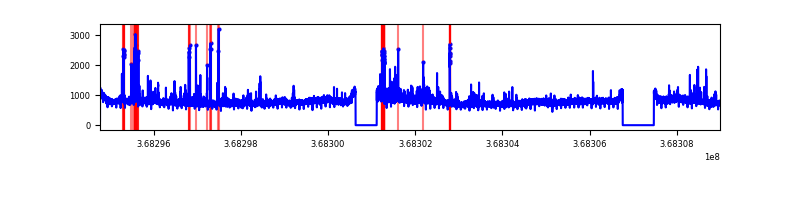 |
| C | 14217 | 13017 | 49 | 49 | 0.34% | 0.38% | 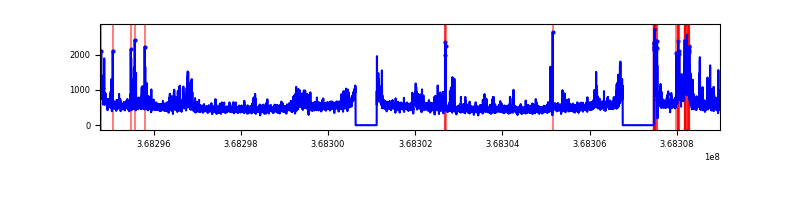 |
| D | 14217 | 13018 | 410 | 410 | 2.88% | 3.15% | 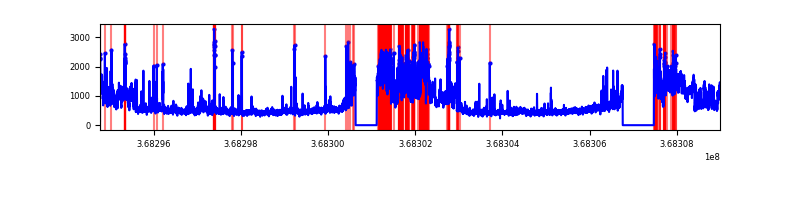 |
Top three noisy pixels from each quadrant. If the there are fewer than three noisy pixels in the level2.evt file, extra rows are filled as -1
| Pixel properties | Quadrant properties | ||||||
|---|---|---|---|---|---|---|---|
| Quadrant | DetID | PixID | Counts | Sigma | Mean | Median | Sigma |
| A | 13 | 6 | 27700 | 79.08 | 1643 | 1614 | 329.9 |
| A | 13 | 254 | 25749 | 73.16 | 1643 | 1614 | 329.9 |
| A | 3 | 137 | 16362 | 44.71 | 1643 | 1614 | 329.9 |
| B | 6 | 159 | 3533477 | 11352.9 | 1612 | 1572 | 311.1 |
| B | 10 | 245 | 316854 | 1013.44 | 1612 | 1572 | 311.1 |
| B | 5 | 172 | 237226 | 757.48 | 1612 | 1572 | 311.1 |
| C | 3 | 233 | 526530 | 1455.56 | 1532 | 1549 | 360.7 |
| C | 14 | 238 | 387870 | 1071.12 | 1532 | 1549 | 360.7 |
| C | 0 | 10 | 218477 | 601.45 | 1532 | 1549 | 360.7 |
| D | 8 | 195 | 2673582 | 7143.24 | 1569 | 1532 | 374.1 |
| D | 12 | 227 | 834466 | 2226.7 | 1569 | 1532 | 374.1 |
| D | 12 | 218 | 336227 | 894.75 | 1569 | 1532 | 374.1 |
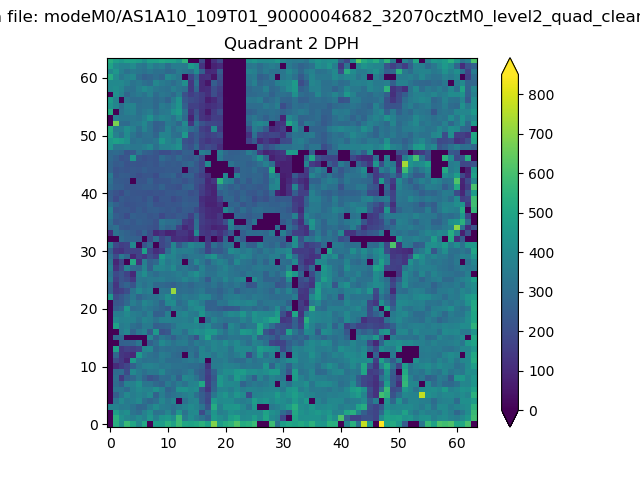
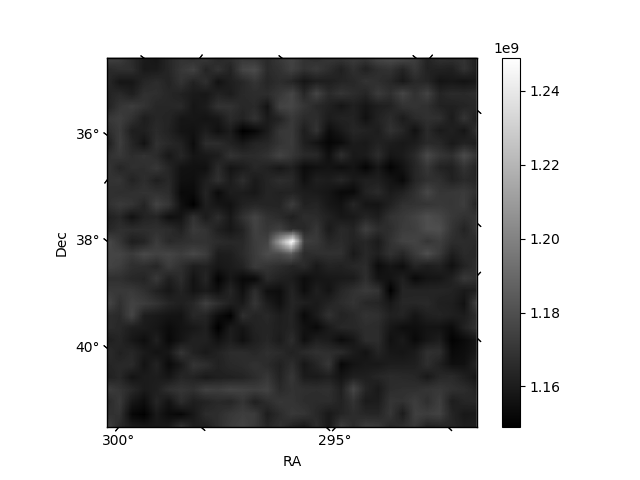
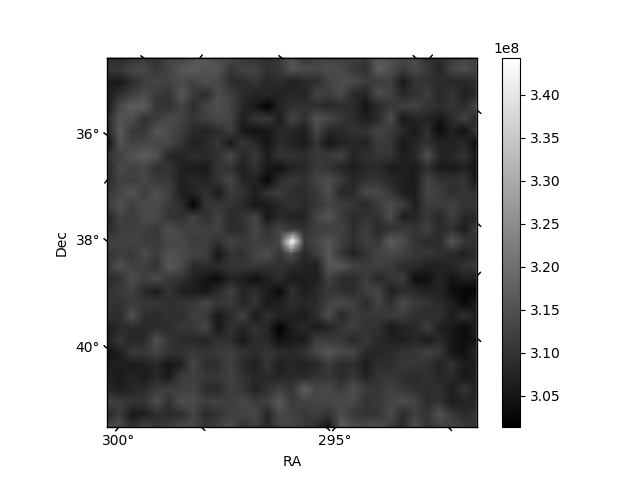
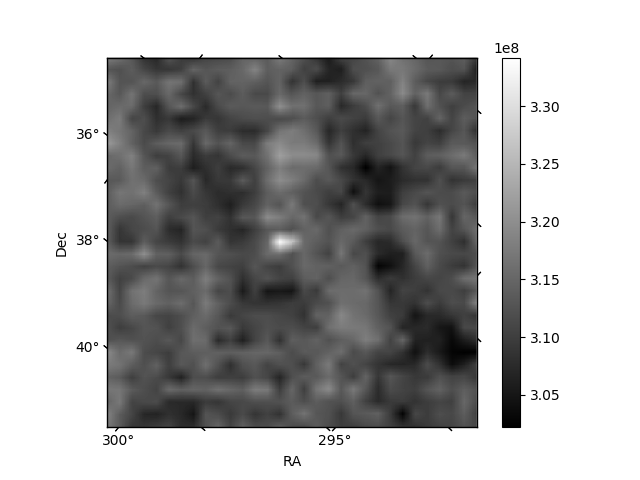
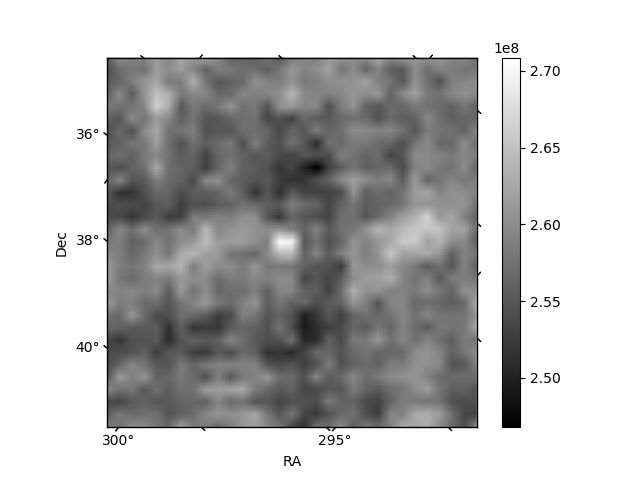
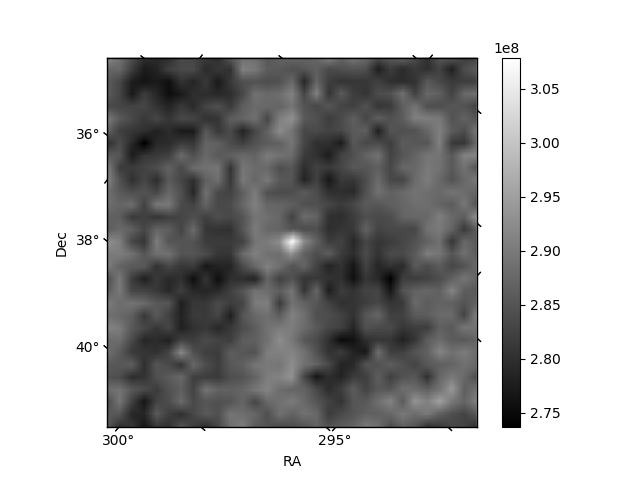
Histogram calculated using DETX and DETY for each event in the final _common_clean file
| Quadrant A | 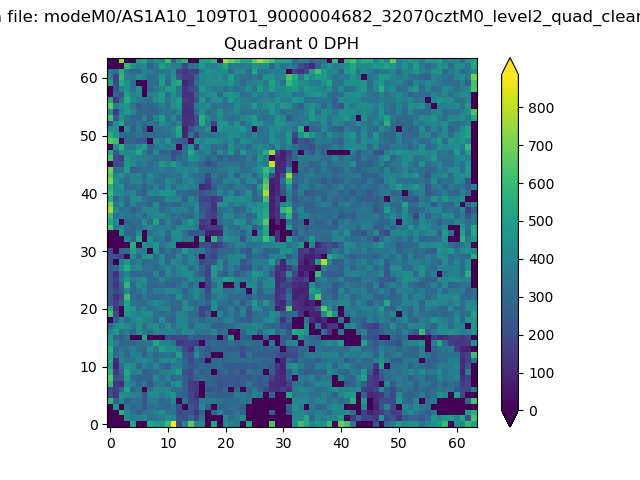 |
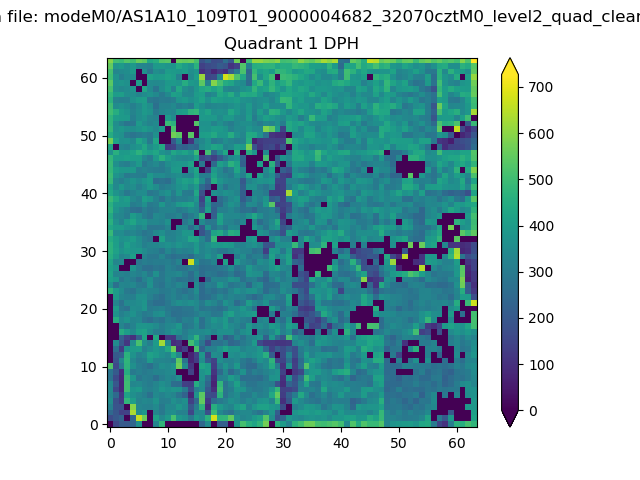 |
Quadrant B |
|---|---|---|---|
| Quadrant D | 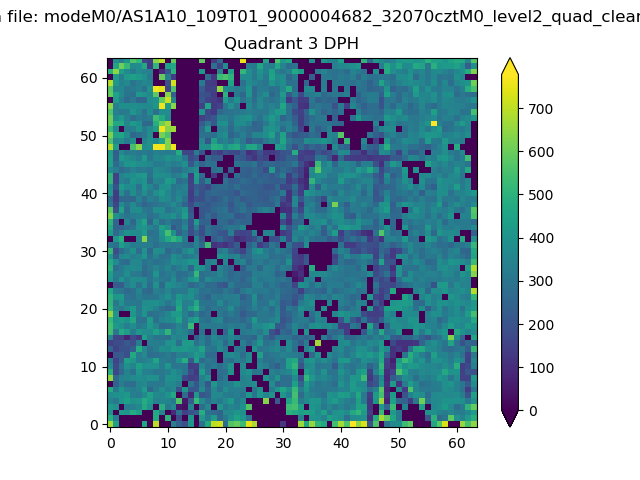 |
 |
Quadrant C |
| Plot type | Count rate plots | Images |
|---|---|---|
| Comparison with Poisson distribution Blue bars denote a histogram of data divided into 1 sec bins. Red curve is a Poisson curve with rate = median count rate of data. |
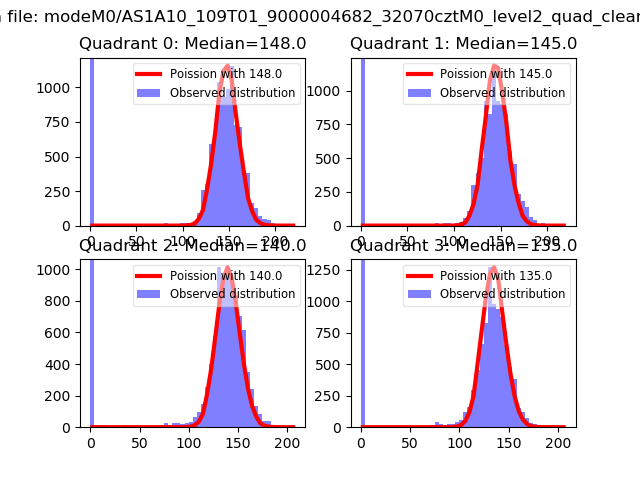 |
 |
| Quadrant-wise count rates Data is divided into 100 sec bins |
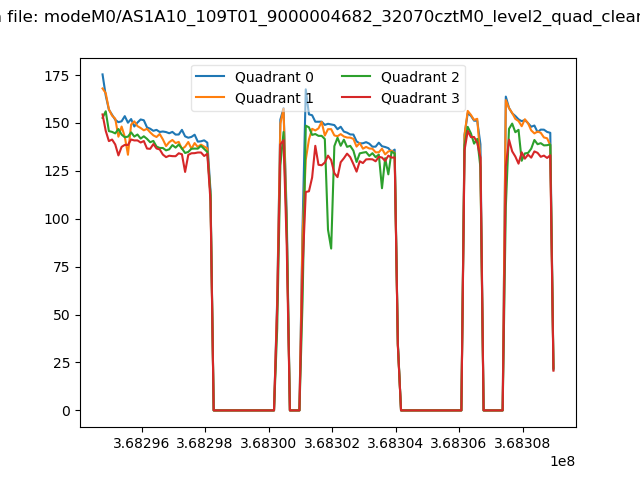 |
|
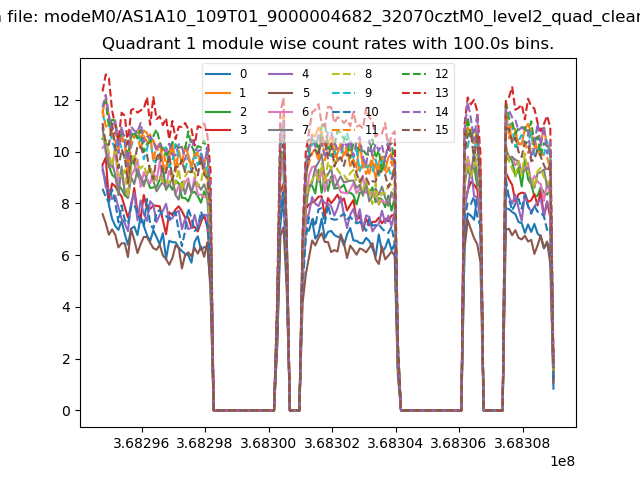
| Module-wise count rates for Quadrant A Data is divided into 100 sec bins |
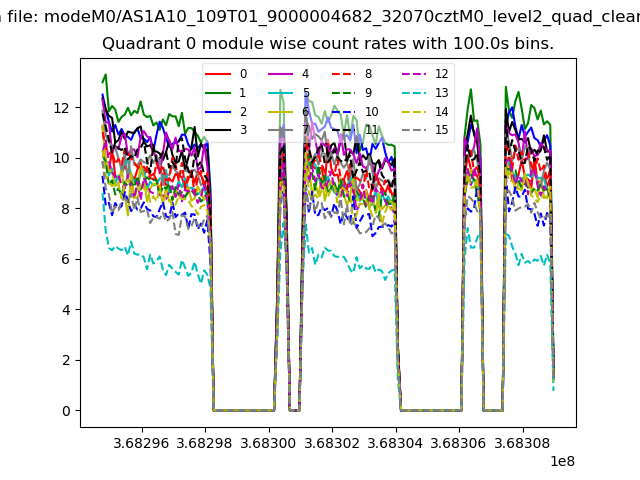 |
 |
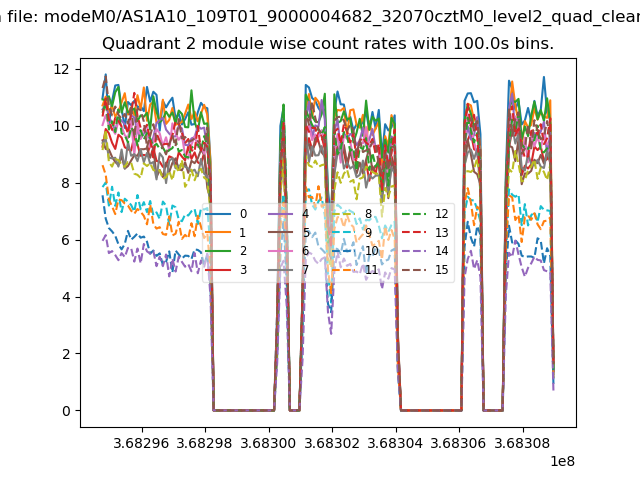
| Module-wise count rates for Quadrant B Data is divided into 100 sec bins |
 |
 |
| Module-wise count rates for Quadrant C Data is divided into 100 sec bins |
 |
 |
| Module-wise count rates for Quadrant D Data is divided into 100 sec bins |
 |
 |
| Parameter | Plot |
|---|---|
| CZT HV Monitor |  |
| D_VDD |  |
| Temperature 1 | 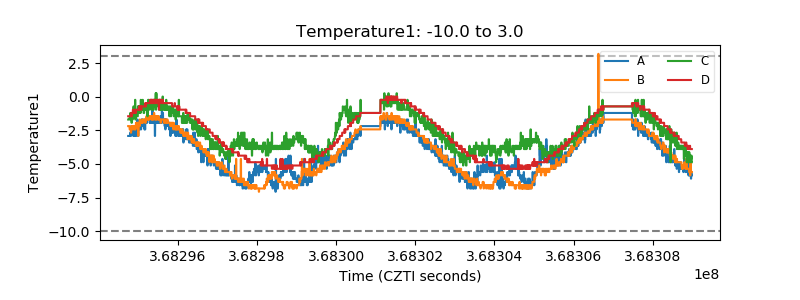 |
| Veto HV Monitor | 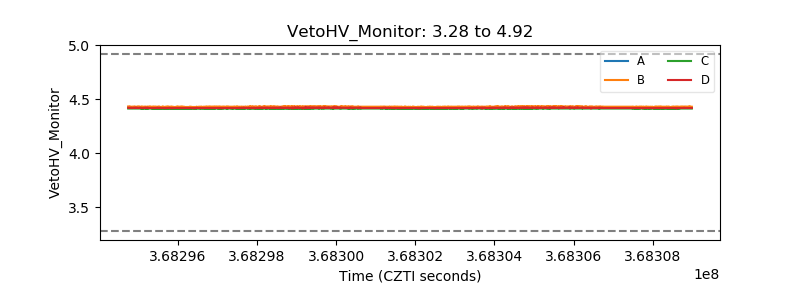 |
| Veto LLD | 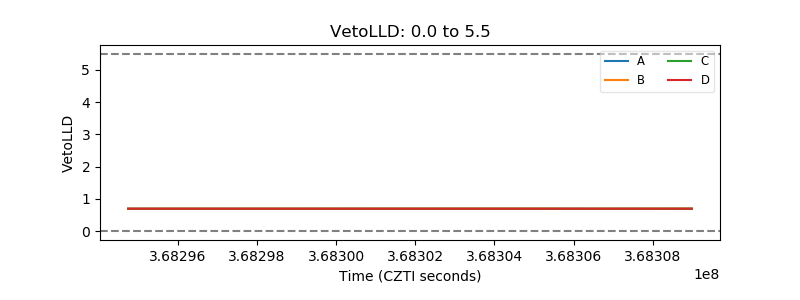 |
| Alpha Counter | 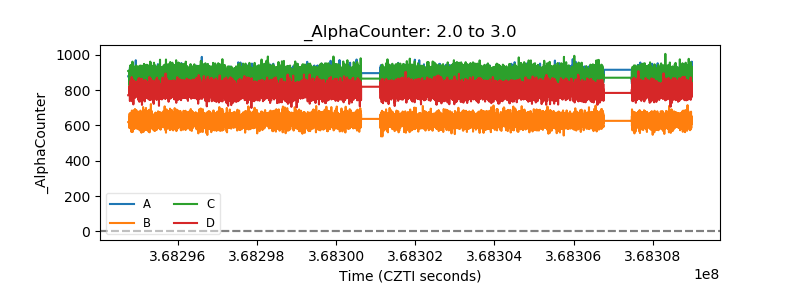 |
| _CPM_Rate | 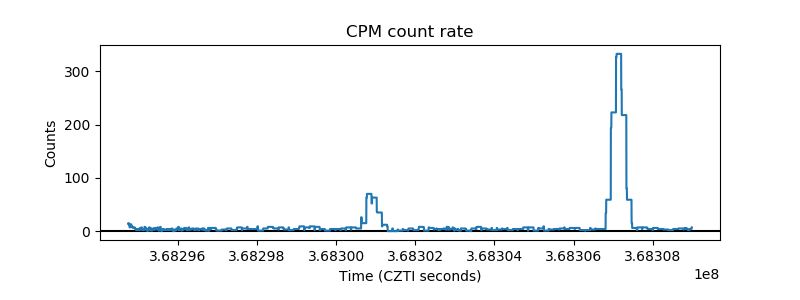 |
| CZT Counter | 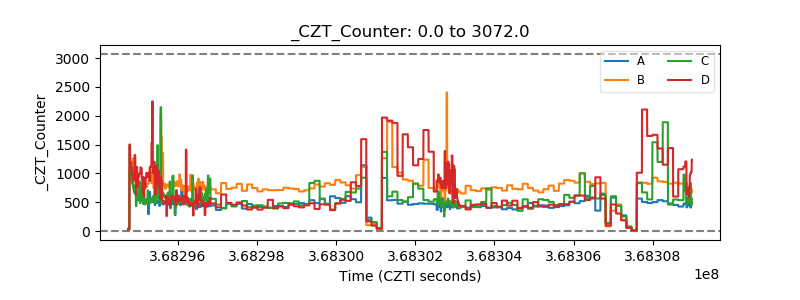 |
| +2.5 Volts monitor |  |
| +5 Volts monitor |  |
| _ROLL_ROT | 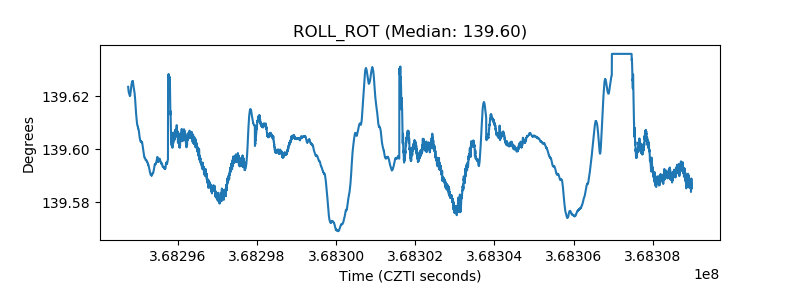 |
| _Roll_DEC |  |
| _Roll_RA | 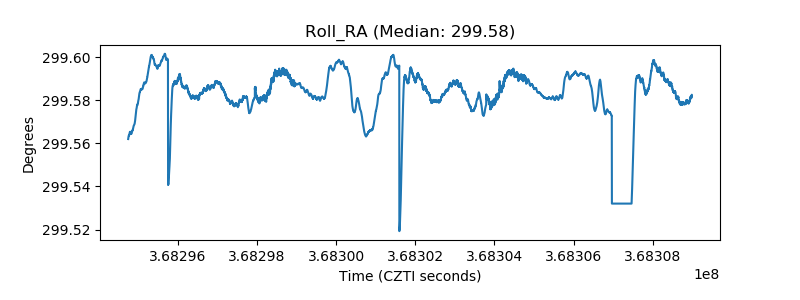 |
| Veto Counter | 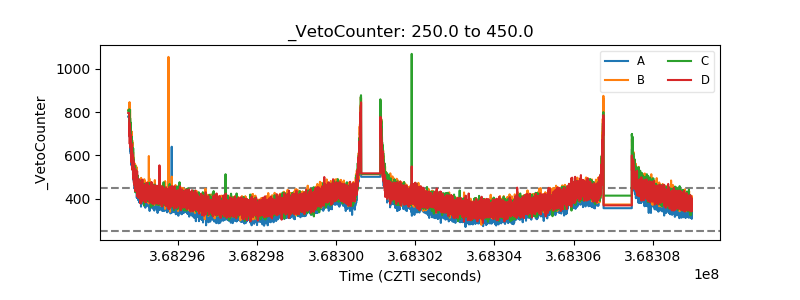 |