| Param | Original file | Final file |
|---|---|---|
| Filename | modeM0/AS1A10_109T01_9000004682_32074cztM0_level2.evt | modeM0/AS1A10_109T01_9000004682_32074cztM0_level2_quad_clean.evt |
| Size (bytes) | 685,825,920 | 71,899,200 |
| Size | 654.1 MB | 68.6 MB |
| Events in quadrant A | 2,571,672 | 506,718 |
| Events in quadrant B | 9,172,439 | 407,987 |
| Events in quadrant C | 3,544,809 | 445,655 |
| Events in quadrant D | 5,128,580 | 449,589 |
| Mode M9 | |||
|---|---|---|---|
| Quadrant | BADHDUFLAG | Total packets | Discarded packets |
| A | 0 | 12 | 0 |
| B | 0 | 13 | 0 |
| C | 0 | 13 | 0 |
| D | 0 | 13 | 0 |
| Mode M0 | |||
|---|---|---|---|
| Quadrant | BADHDUFLAG | Total packets | Discarded packets |
| A | 0 | 10946 | 2 |
| B | 0 | 30929 | 2 |
| C | 0 | 13904 | 2 |
| D | 0 | 18861 | 2 |
| Mode SS | |||
|---|---|---|---|
| Quadrant | BADHDUFLAG | Total packets | Discarded packets |
| A | 0 | 108 | 0 |
| B | 0 | 108 | 0 |
| C | 0 | 108 | 0 |
| D | 0 | 108 | 0 |
| Quadrant | Total seconds | Saturated seconds | Saturation percentage |
|---|---|---|---|
| A | 5221 | 12 | 0.229841% |
| B | 5221 | 2419 | 46.332120% |
| C | 5221 | 627 | 12.009194% |
| D | 5221 | 190 | 3.639150% |
Noise dominated data is calculated using 1-second bins in cleaned event files. If a bin has >2000 counts, and if more than 50% of those come from <1% of pixels, then it is considered to be noise-dominated and hence unusable.
| Quadrant | # 1 sec bins | Bins with >0 counts | Bins with >2000 counts | High rate bins dominated by noise | Noise dominated (total time) | Noise dominated (detector-on time) | Marked lightcurve |
|---|---|---|---|---|---|---|---|
| A | 6411 | 5222 | 0 | 0 | 0.00% | 0.00% | 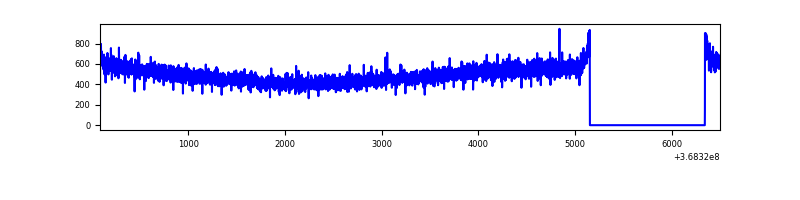 |
| B | 6411 | 5221 | 1898 | 1898 | 29.61% | 36.35% | 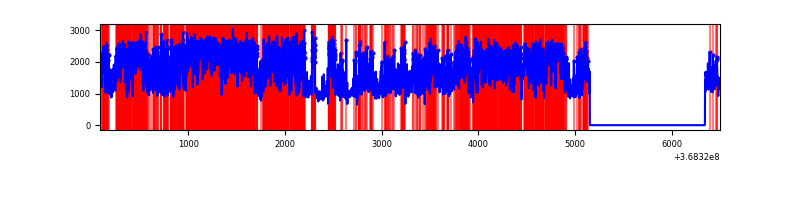 |
| C | 6411 | 5222 | 146 | 146 | 2.28% | 2.80% | 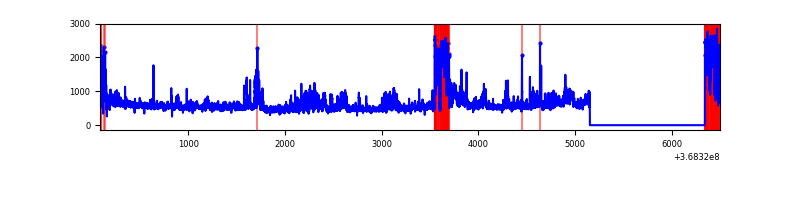 |
| D | 6411 | 5222 | 131 | 131 | 2.04% | 2.51% |  |
Top three noisy pixels from each quadrant. If the there are fewer than three noisy pixels in the level2.evt file, extra rows are filled as -1
| Pixel properties | Quadrant properties | ||||||
|---|---|---|---|---|---|---|---|
| Quadrant | DetID | PixID | Counts | Sigma | Mean | Median | Sigma |
| A | 13 | 254 | 9774 | 68.98 | 664 | 652 | 132.2 |
| A | 13 | 6 | 8684 | 60.74 | 664 | 652 | 132.2 |
| A | 3 | 137 | 6447 | 43.82 | 664 | 652 | 132.2 |
| B | 10 | 245 | 5404012 | 49073.57 | 587 | 575 | 110.1 |
| B | 6 | 159 | 1307396 | 11868.44 | 587 | 575 | 110.1 |
| B | 0 | 190 | 94335 | 851.52 | 587 | 575 | 110.1 |
| C | 0 | 10 | 372186 | 2643.32 | 601 | 608 | 140.6 |
| C | 3 | 233 | 230348 | 1634.32 | 601 | 608 | 140.6 |
| C | 14 | 238 | 205073 | 1454.52 | 601 | 608 | 140.6 |
| D | 8 | 195 | 2046433 | 13595.77 | 629 | 615 | 150.5 |
| D | 12 | 218 | 318512 | 2112.63 | 629 | 615 | 150.5 |
| D | 12 | 227 | 292760 | 1941.49 | 629 | 615 | 150.5 |
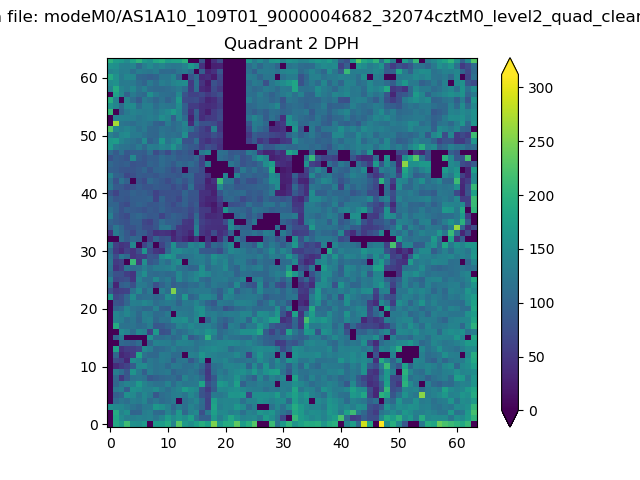
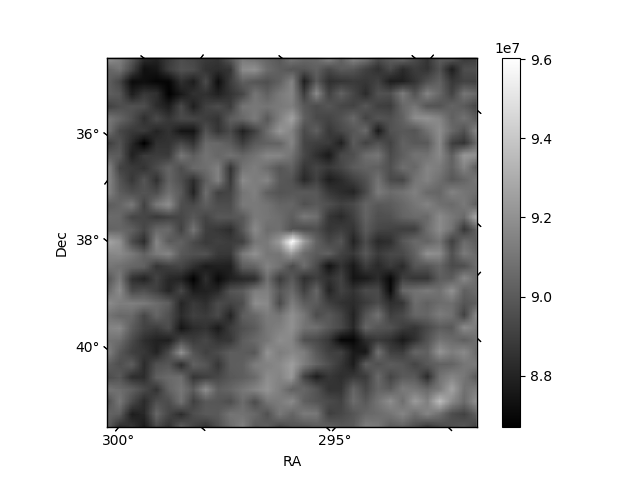
Histogram calculated using DETX and DETY for each event in the final _common_clean file
| Quadrant A | 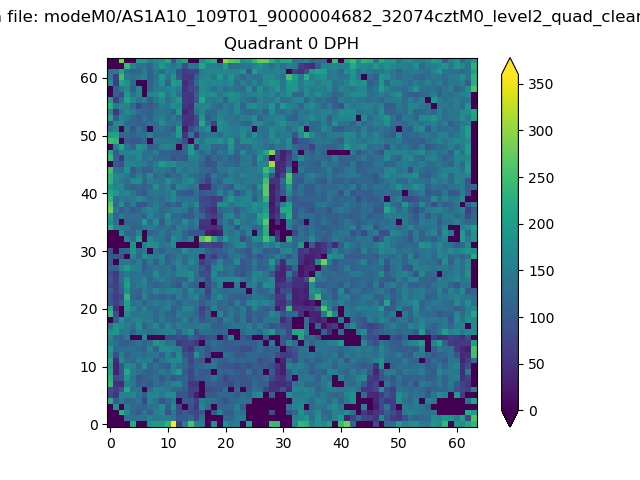 |
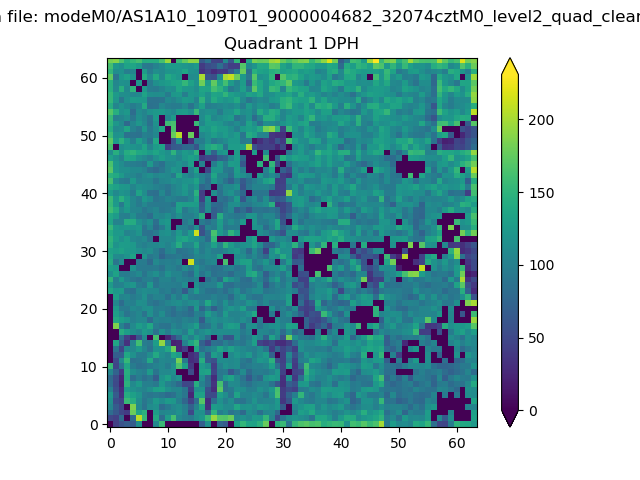 |
Quadrant B |
|---|---|---|---|
| Quadrant D | 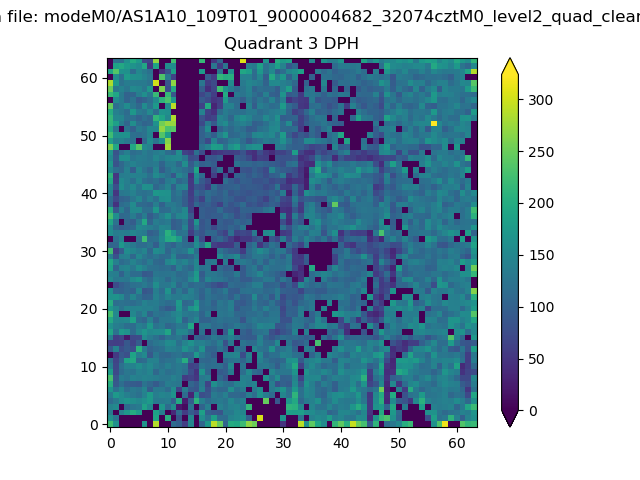 |
 |
Quadrant C |
| Plot type | Count rate plots | Images |
|---|---|---|
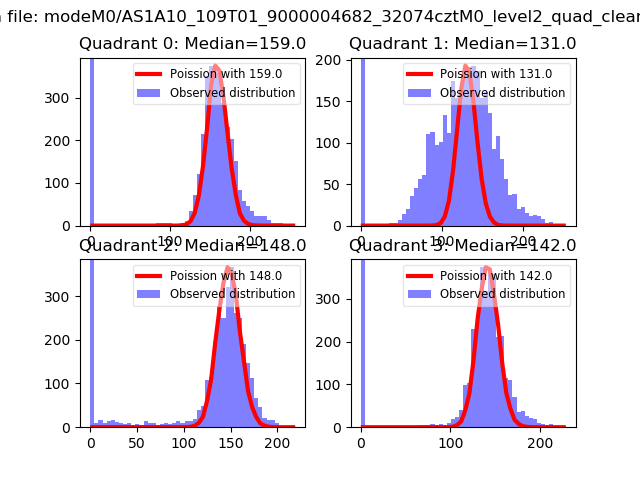
| Comparison with Poisson distribution Blue bars denote a histogram of data divided into 1 sec bins. Red curve is a Poisson curve with rate = median count rate of data. |
 |
 |
| Quadrant-wise count rates Data is divided into 100 sec bins |
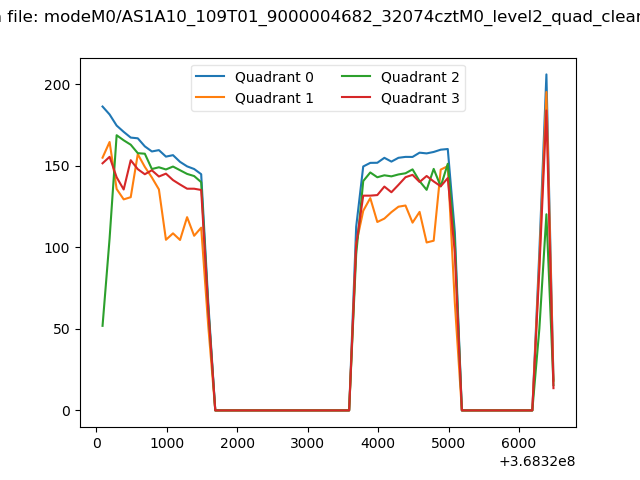 |
|
| Module-wise count rates for Quadrant A Data is divided into 100 sec bins |
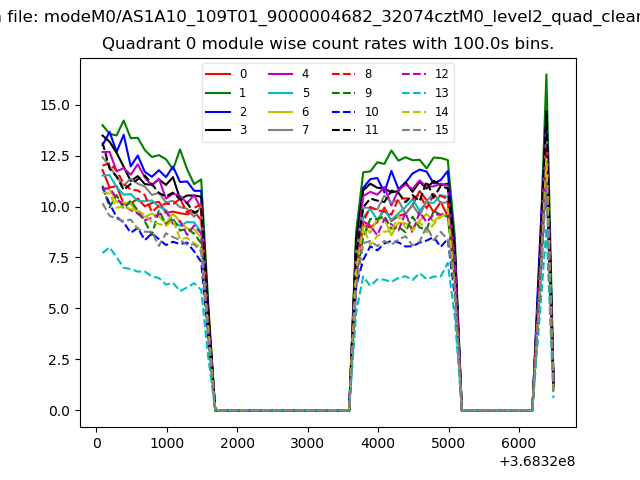 |
 |
| Module-wise count rates for Quadrant B Data is divided into 100 sec bins |
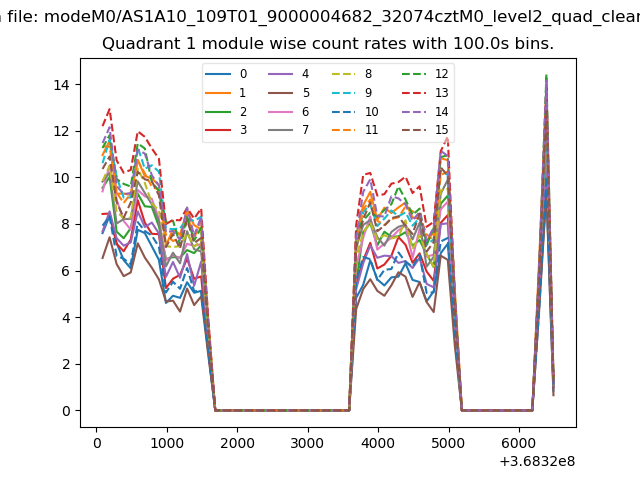 |
 |
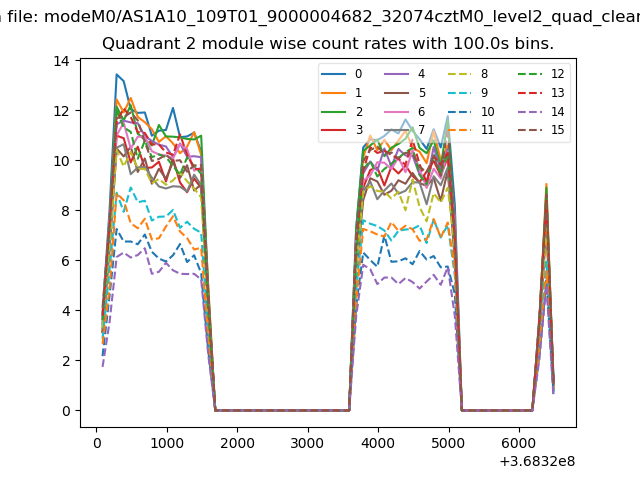
| Module-wise count rates for Quadrant C Data is divided into 100 sec bins |
 |
 |
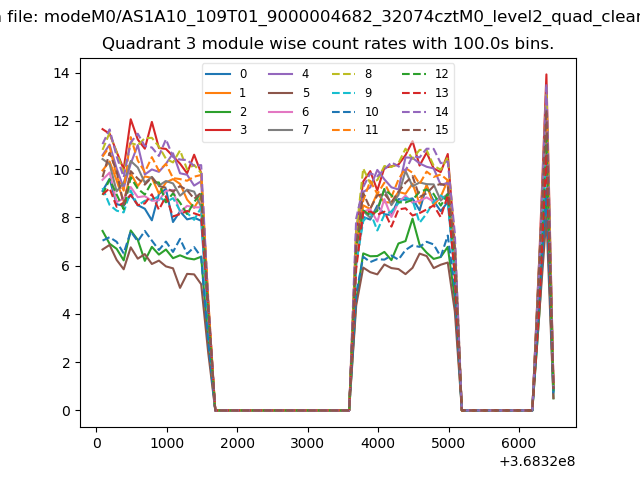
| Module-wise count rates for Quadrant D Data is divided into 100 sec bins |
 |
 |
| Parameter | Plot |
|---|---|
| CZT HV Monitor | 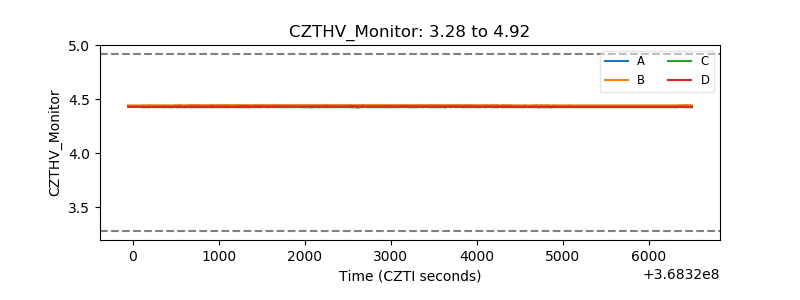 |
| D_VDD | 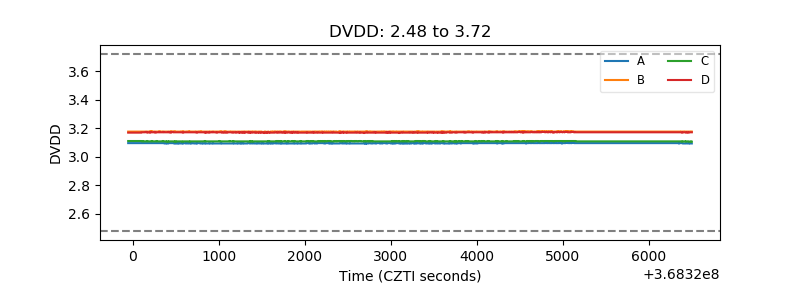 |
| Temperature 1 | 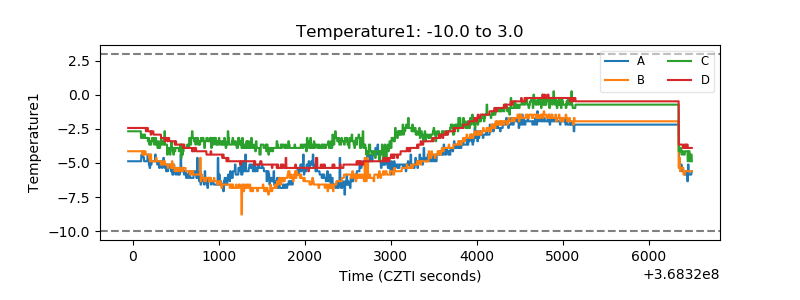 |
| Veto HV Monitor | 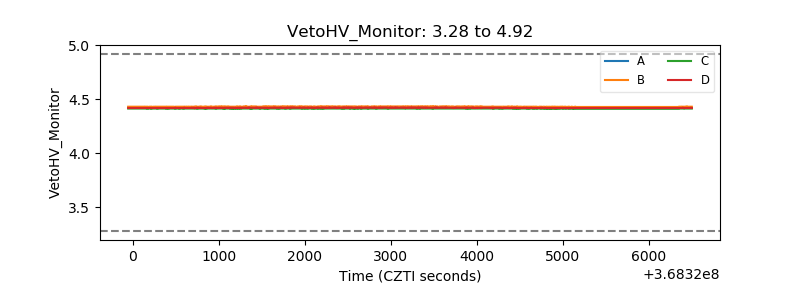 |
| Veto LLD | 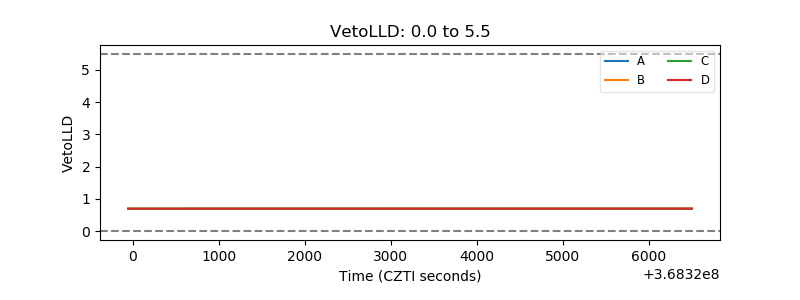 |
| Alpha Counter | 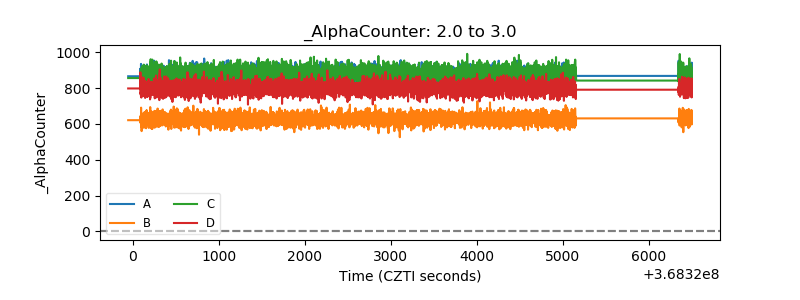 |
| _CPM_Rate | 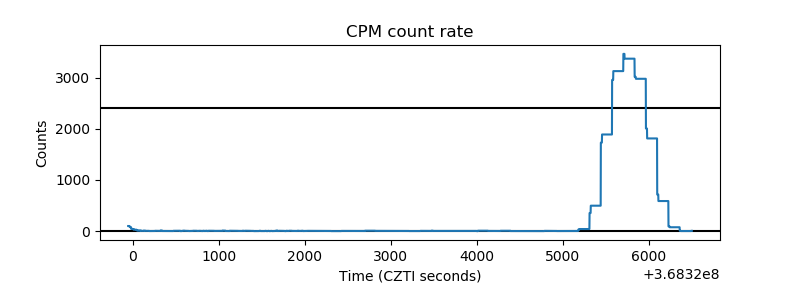 |
| CZT Counter | 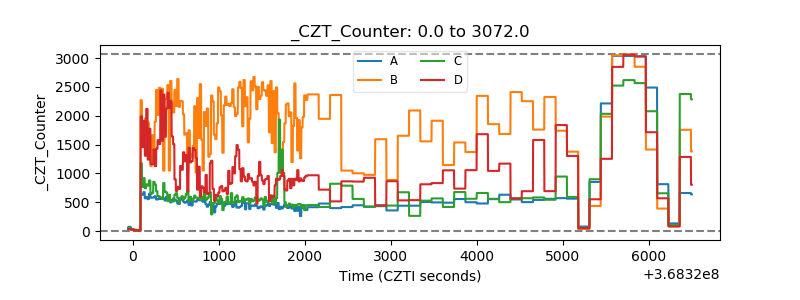 |
| +2.5 Volts monitor |  |
| +5 Volts monitor | 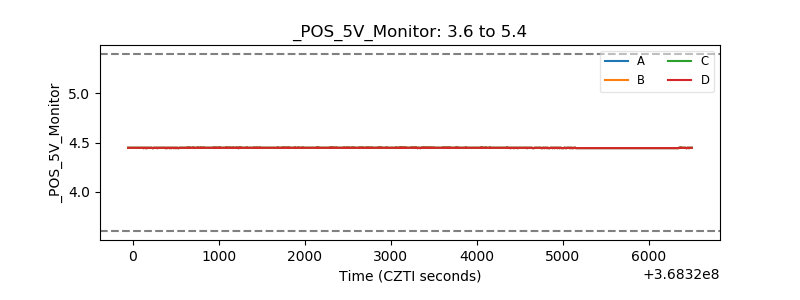 |
| _ROLL_ROT | 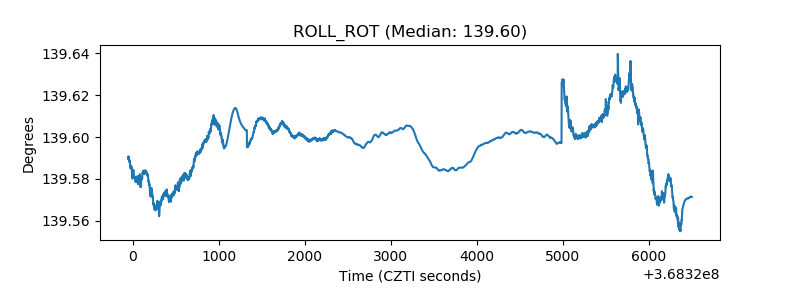 |
| _Roll_DEC |  |
| _Roll_RA | 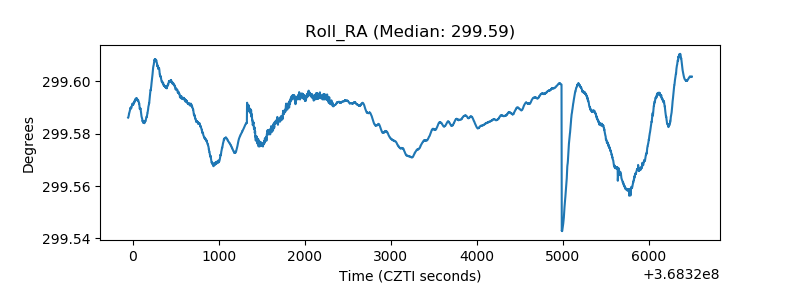 |
| Veto Counter | 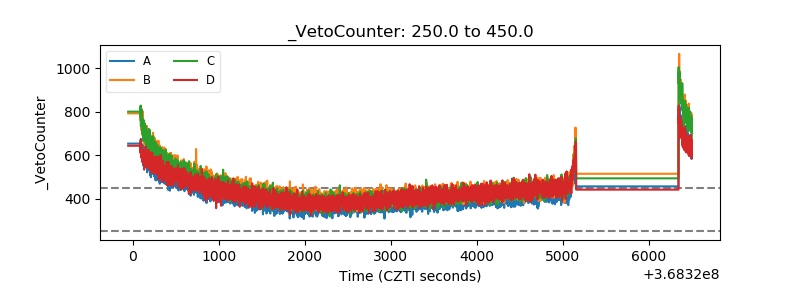 |