| Param | Original file | Final file |
|---|---|---|
| Filename | modeM0/AS1C06_002T04_9000004684cztM0_level2.fits | modeM0/AS1C06_002T04_9000004684cztM0_level2_quad_clean.evt |
| Size (bytes) | 850,253,760 | 768,458,880 |
| Size | 810.9 MB | 732.9 MB |
| Events in quadrant A | 5,616,618 | 5,245,080 |
| Events in quadrant B | 4,459,198 | 3,133,591 |
| Events in quadrant C | 5,247,650 | 4,751,606 |
| Events in quadrant D | 4,487,102 | 4,220,235 |
| Mode M9 | |||
|---|---|---|---|
| Quadrant | BADHDUFLAG | Total packets | Discarded packets |
| A | 0 | 153 | 0 |
| B | 0 | 152 | 0 |
| C | 0 | 153 | 0 |
| D | 0 | 153 | 0 |
| Mode M0 | |||
|---|---|---|---|
| Quadrant | BADHDUFLAG | Total packets | Discarded packets |
| A | 0 | 180553 | 0 |
| B | 0 | 460056 | 0 |
| C | 0 | 202989 | 0 |
| D | 0 | 297642 | 0 |
| Mode SS | |||
|---|---|---|---|
| Quadrant | BADHDUFLAG | Total packets | Discarded packets |
| A | 0 | 1758 | 0 |
| B | 0 | 1760 | 0 |
| C | 0 | 1762 | 0 |
| D | 0 | 1770 | 0 |
| Quadrant | Total seconds | Saturated seconds | Saturation percentage |
|---|---|---|---|
| A | 86464 | 879 | 1.016608% |
| B | 86116 | 33554 | 38.963723% |
| C | 86392 | 3807 | 4.406658% |
| D | 86339 | 9980 | 11.559087% |
Noise dominated data is calculated using 1-second bins in cleaned event files. If a bin has >2000 counts, and if more than 50% of those come from <1% of pixels, then it is considered to be noise-dominated and hence unusable.
| Quadrant | # 1 sec bins | Bins with >0 counts | Bins with >2000 counts | High rate bins dominated by noise | Noise dominated (total time) | Noise dominated (detector-on time) | Marked lightcurve |
|---|---|---|---|---|---|---|---|
| A | 107004 | 86766 | 0 | 0 | 0.00% | 0.00% | 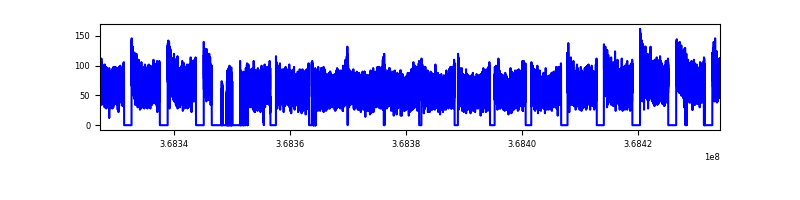 |
| B | 107004 | 86210 | 0 | 0 | 0.00% | 0.00% | 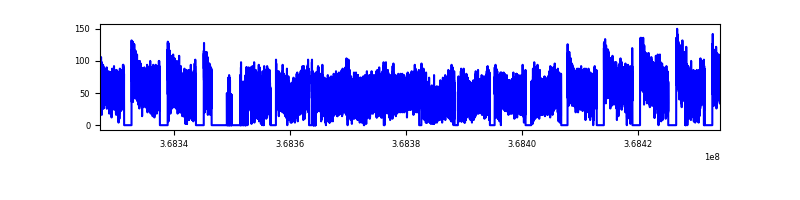 |
| C | 107004 | 86627 | 0 | 0 | 0.00% | 0.00% | 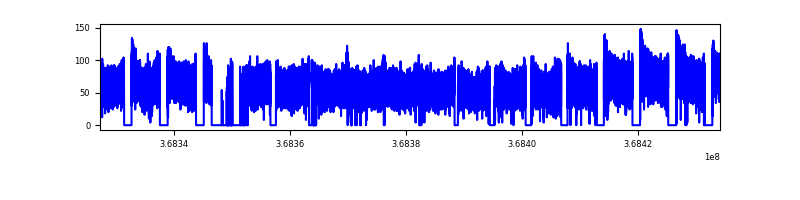 |
| D | 107003 | 86566 | 0 | 0 | 0.00% | 0.00% | 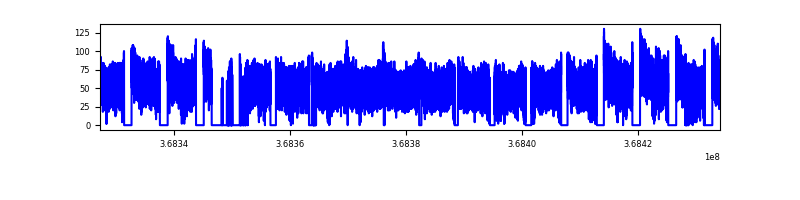 |
Top three noisy pixels from each quadrant. If the there are fewer than three noisy pixels in the level2.evt file, extra rows are filled as -1
| Pixel properties | Quadrant properties | ||||||
|---|---|---|---|---|---|---|---|
| Quadrant | DetID | PixID | Counts | Sigma | Mean | Median | Sigma |
| A | 0 | 29 | 5473 | 11.45 | 1465 | 1382 | 357.4 |
| A | 7 | 110 | 4421 | 8.5 | 1465 | 1382 | 357.4 |
| A | 0 | 30 | 4332 | 8.25 | 1465 | 1382 | 357.4 |
| B | 2 | 9 | 3635 | 10.81 | 1182 | 1137 | 231.1 |
| B | 2 | 8 | 3113 | 8.55 | 1182 | 1137 | 231.1 |
| B | 3 | 80 | 2955 | 7.87 | 1182 | 1137 | 231.1 |
| C | 1 | 81 | 4102 | 8.12 | 1389 | 1310 | 343.8 |
| C | 1 | 80 | 4051 | 7.97 | 1389 | 1310 | 343.8 |
| C | 3 | 187 | 3607 | 6.68 | 1389 | 1310 | 343.8 |
| D | 10 | 189 | 3254 | 6.12 | 1283 | 1171 | 340.6 |
| D | 6 | 67 | 3179 | 5.9 | 1283 | 1171 | 340.6 |
| D | 7 | 3 | 3162 | 5.85 | 1283 | 1171 | 340.6 |
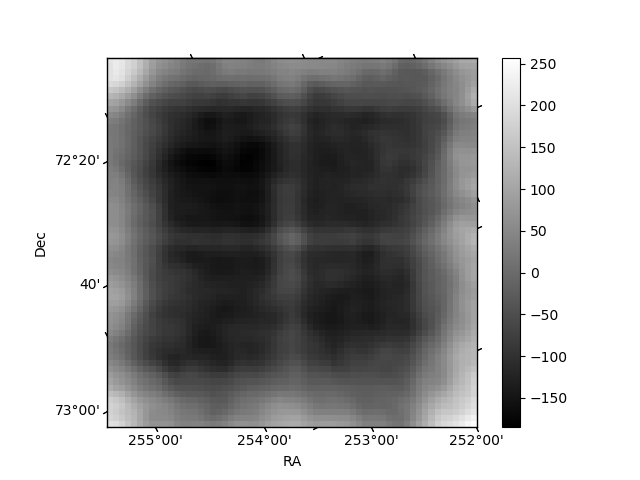
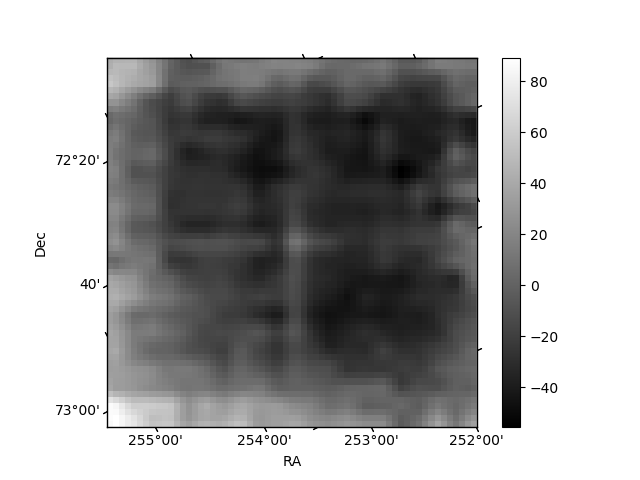
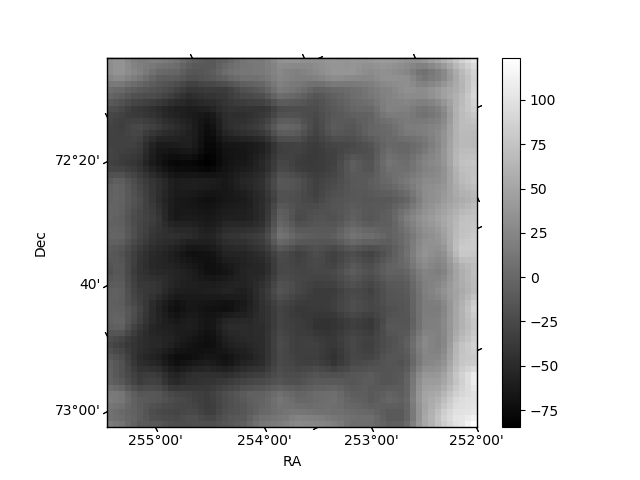
Histogram calculated using DETX and DETY for each event in the final _common_clean file
| Quadrant A | 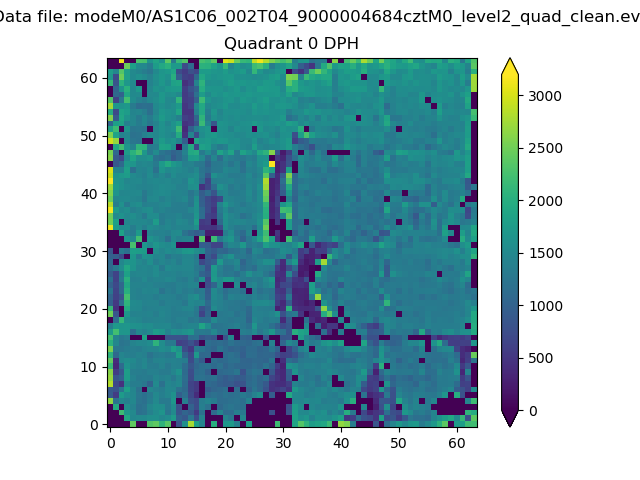 |
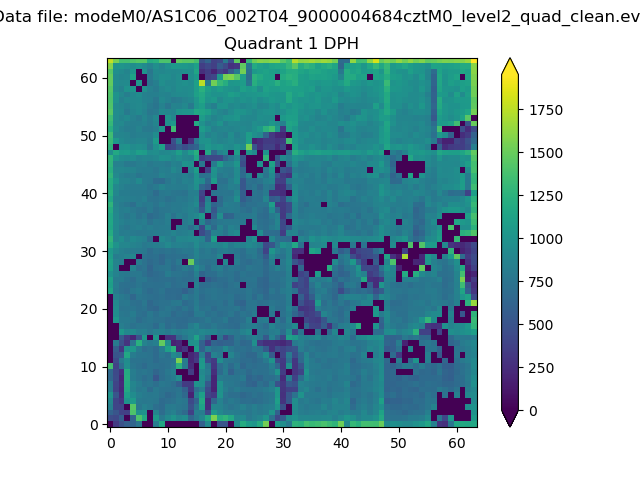 |
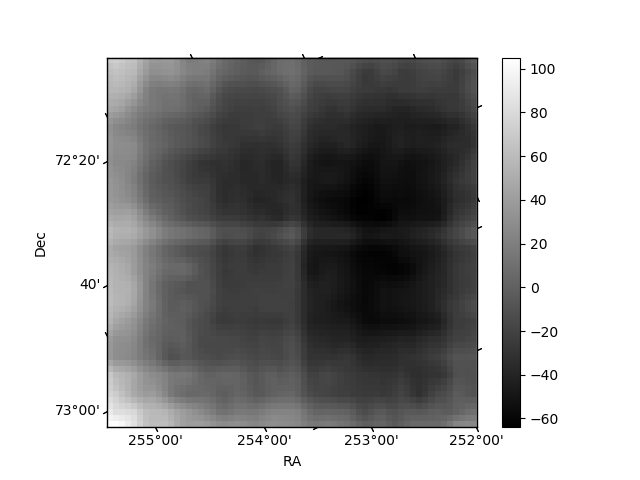
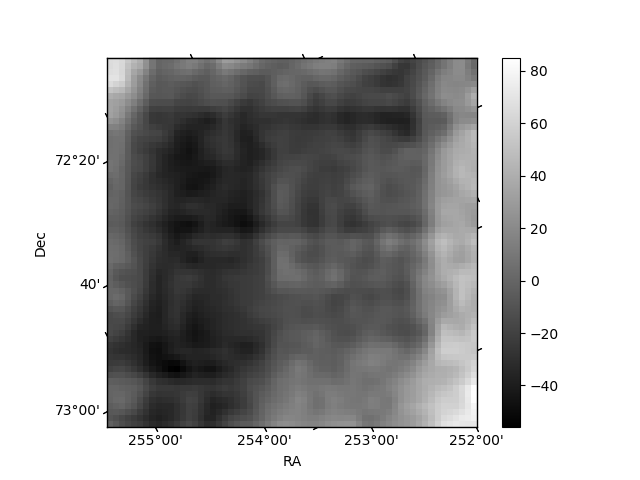
Quadrant B |
|---|---|---|---|
| Quadrant D | 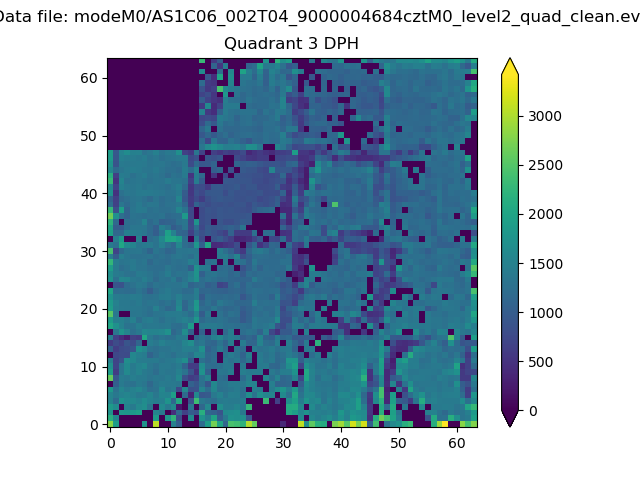 |
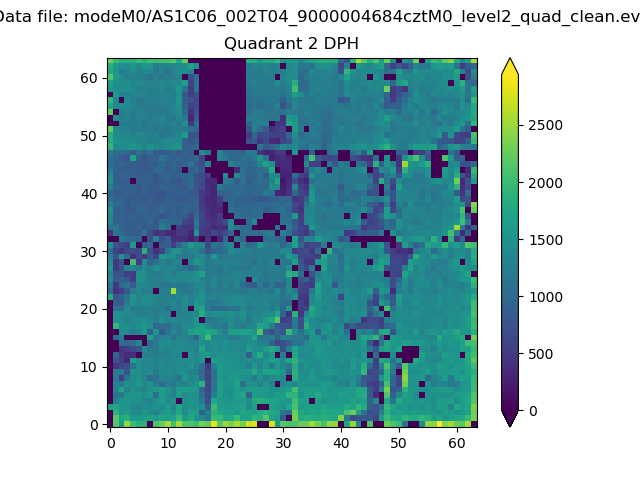 |
Quadrant C |
| Plot type | Count rate plots | Images |
|---|---|---|
| Comparison with Poisson distribution Blue bars denote a histogram of data divided into 1 sec bins. Red curve is a Poisson curve with rate = median count rate of data. |
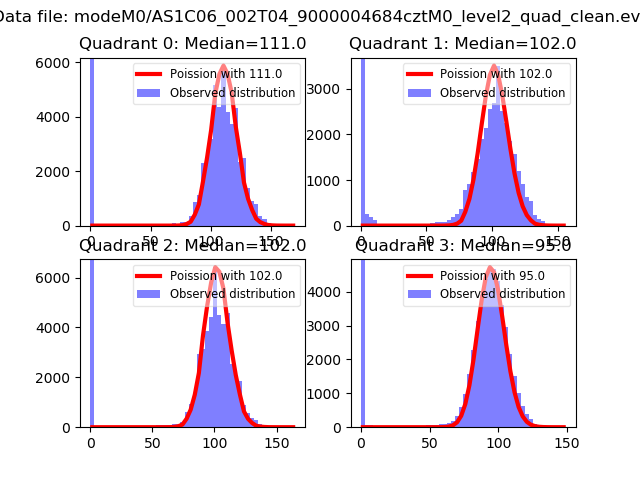 |
 |
| Quadrant-wise count rates Data is divided into 100 sec bins |
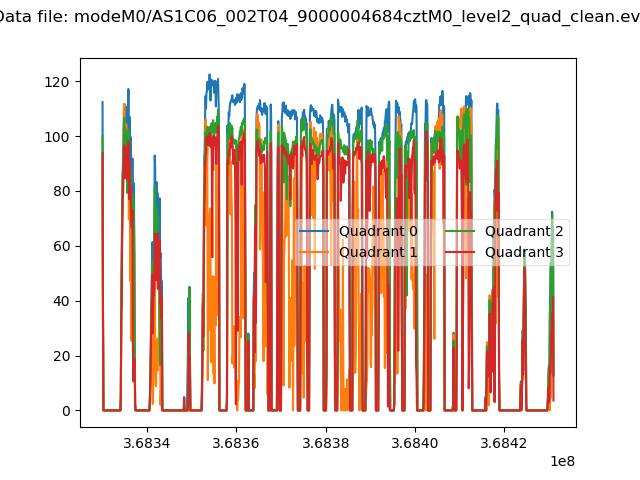 |
|
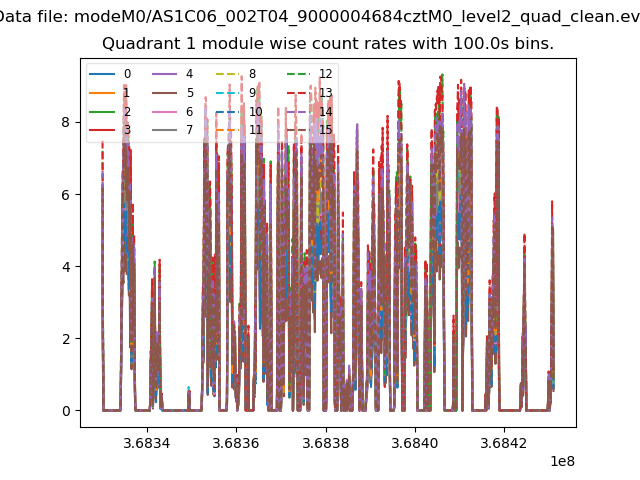
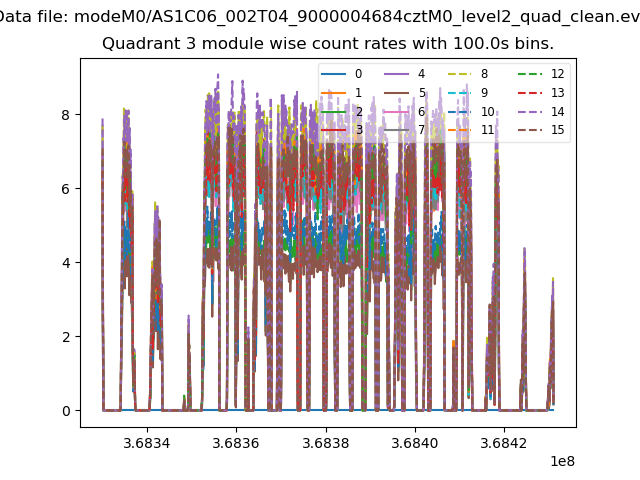
| Module-wise count rates for Quadrant A Data is divided into 100 sec bins |
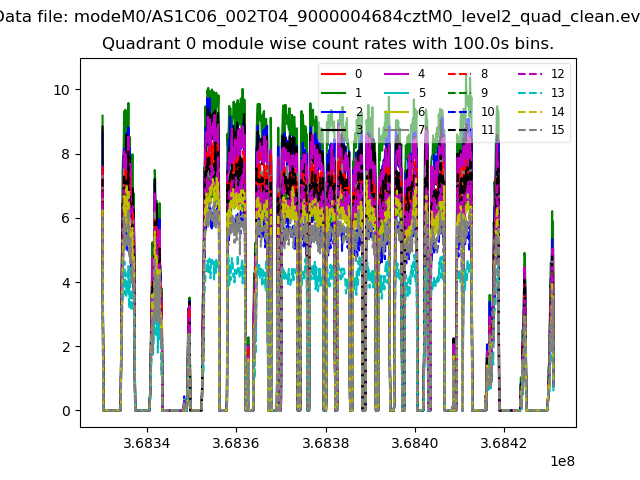 |
 |
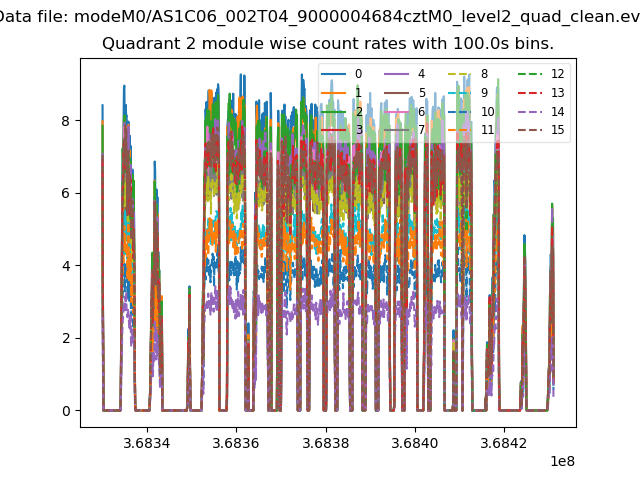
| Module-wise count rates for Quadrant B Data is divided into 100 sec bins |
 |
 |
| Module-wise count rates for Quadrant C Data is divided into 100 sec bins |
 |
 |
| Module-wise count rates for Quadrant D Data is divided into 100 sec bins |
 |
 |
| Parameter | Plot |
|---|---|
| CZT HV Monitor | 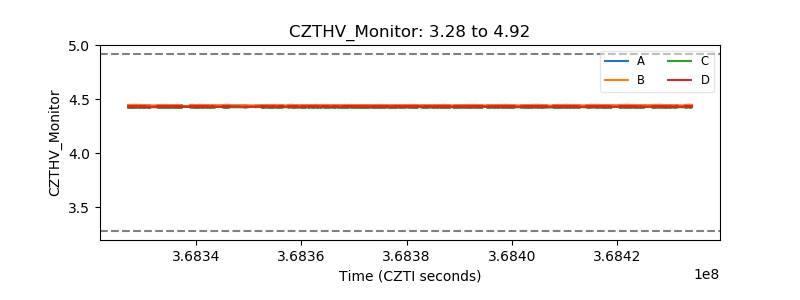 |
| D_VDD | 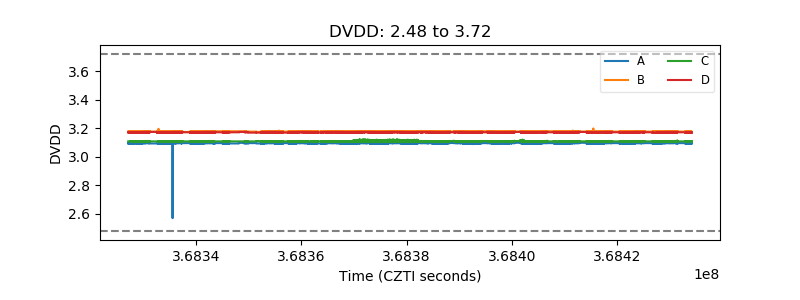 |
| Temperature 1 | 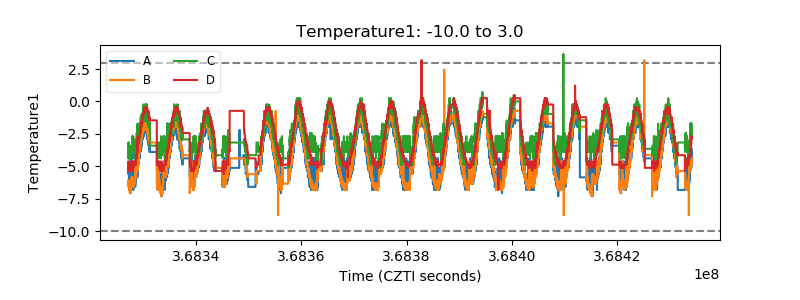 |
| Veto HV Monitor |  |
| Veto LLD | 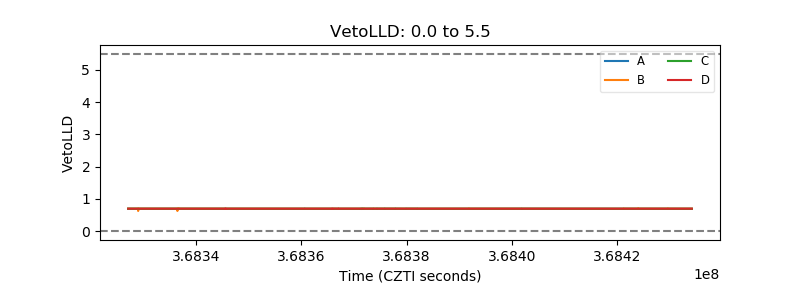 |
| Alpha Counter | 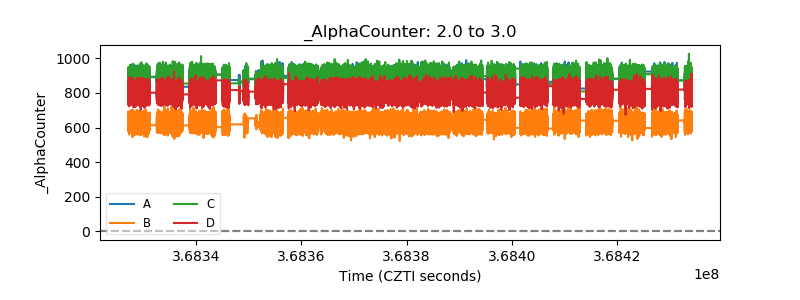 |
| _CPM_Rate | 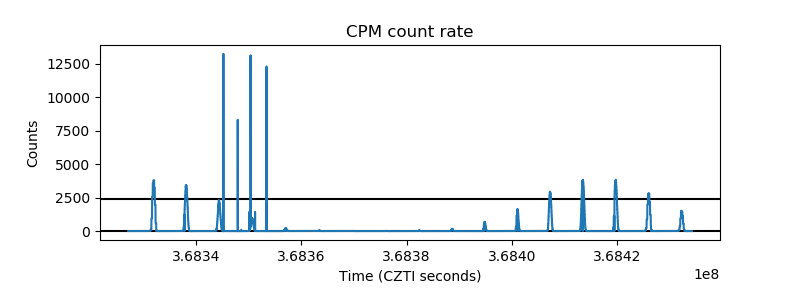 |
| CZT Counter | 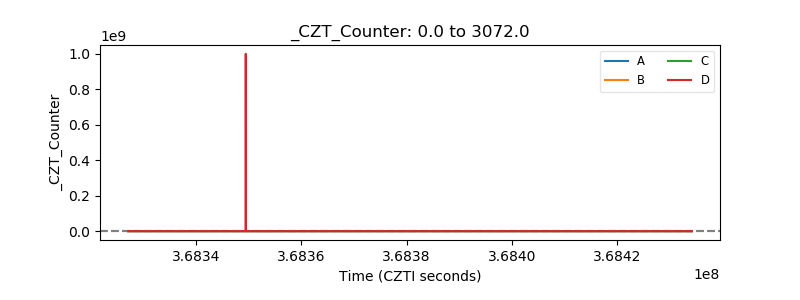 |
| +2.5 Volts monitor | 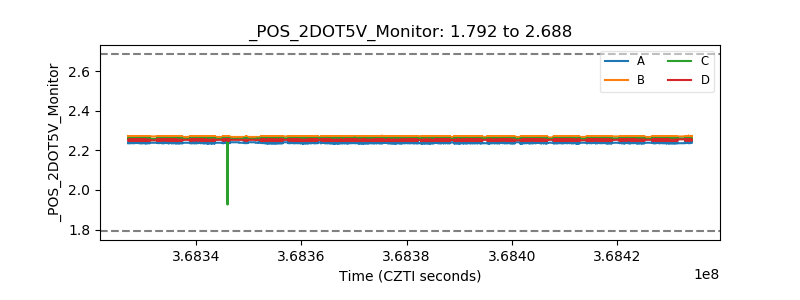 |
| +5 Volts monitor | 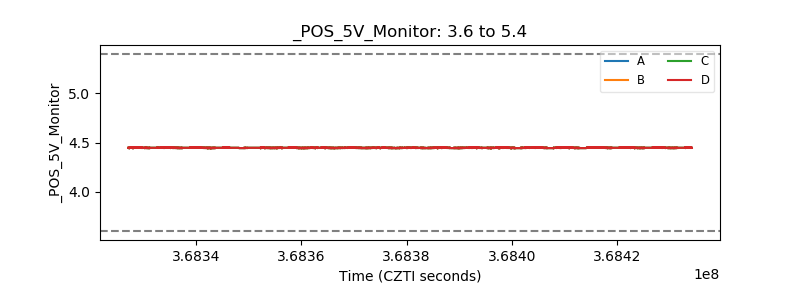 |
| _ROLL_ROT | 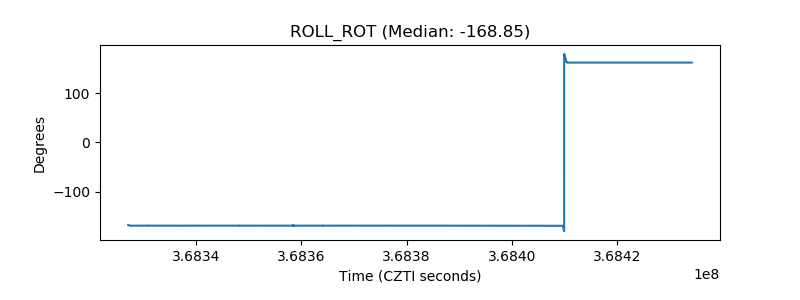 |
| _Roll_DEC | 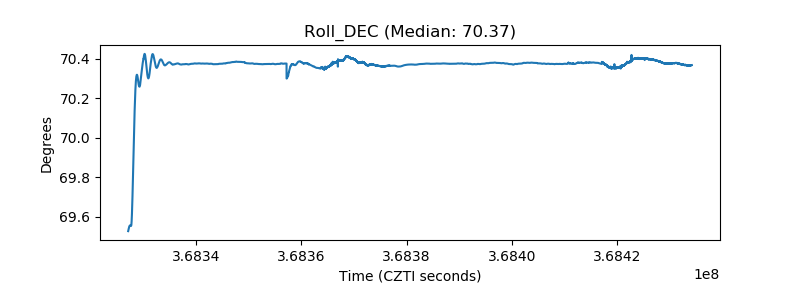 |
| _Roll_RA | 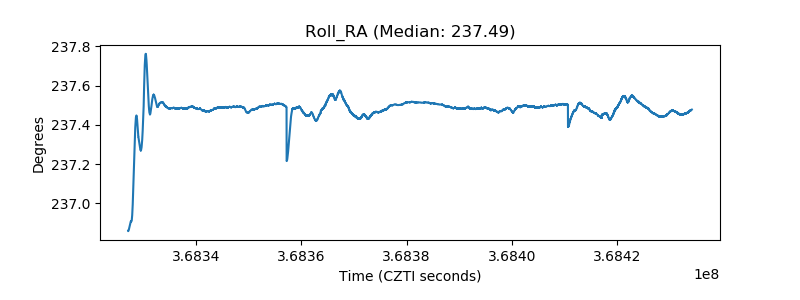 |
| Veto Counter | 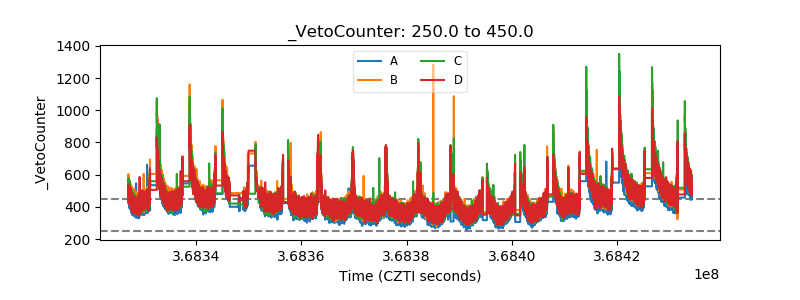 |