| Param | Original file | Final file |
|---|---|---|
| Filename | modeM0/AS1C06_002T04_9000004684_32075cztM0_level2.evt | modeM0/AS1C06_002T04_9000004684_32075cztM0_level2_quad_clean.evt |
| Size (bytes) | 579,121,920 | 91,480,320 |
| Size | 552.3 MB | 87.2 MB |
| Events in quadrant A | 2,792,347 | 623,702 |
| Events in quadrant B | 7,409,453 | 588,674 |
| Events in quadrant C | 3,400,462 | 587,223 |
| Events in quadrant D | 3,555,548 | 576,185 |
| Mode M9 | |||
|---|---|---|---|
| Quadrant | BADHDUFLAG | Total packets | Discarded packets |
| A | 0 | 13 | 0 |
| B | 0 | 13 | 0 |
| C | 0 | 13 | 0 |
| D | 0 | 13 | 0 |
| Mode M0 | |||
|---|---|---|---|
| Quadrant | BADHDUFLAG | Total packets | Discarded packets |
| A | 0 | 11781 | 1 |
| B | 0 | 25990 | 1 |
| C | 0 | 13675 | 1 |
| D | 0 | 14253 | 1 |
| Mode SS | |||
|---|---|---|---|
| Quadrant | BADHDUFLAG | Total packets | Discarded packets |
| A | 0 | 114 | 0 |
| B | 0 | 114 | 0 |
| C | 0 | 114 | 0 |
| D | 0 | 114 | 0 |
| Quadrant | Total seconds | Saturated seconds | Saturation percentage |
|---|---|---|---|
| A | 5640 | 17 | 0.301418% |
| B | 5640 | 816 | 14.468085% |
| C | 5640 | 172 | 3.049645% |
| D | 5640 | 101 | 1.790780% |
Noise dominated data is calculated using 1-second bins in cleaned event files. If a bin has >2000 counts, and if more than 50% of those come from <1% of pixels, then it is considered to be noise-dominated and hence unusable.
| Quadrant | # 1 sec bins | Bins with >0 counts | Bins with >2000 counts | High rate bins dominated by noise | Noise dominated (total time) | Noise dominated (detector-on time) | Marked lightcurve |
|---|---|---|---|---|---|---|---|
| A | 6935 | 5640 | 0 | 0 | 0.00% | 0.00% |  |
| B | 6935 | 5640 | 491 | 491 | 7.08% | 8.71% | 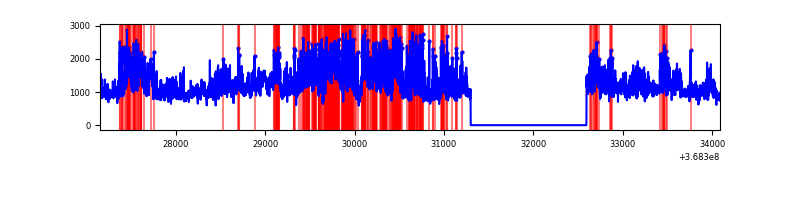 |
| C | 6935 | 5640 | 92 | 92 | 1.33% | 1.63% | 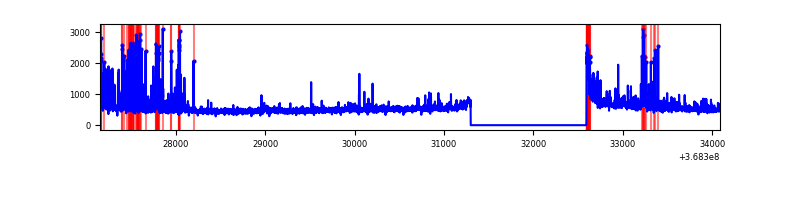 |
| D | 6935 | 5641 | 97 | 97 | 1.40% | 1.72% | 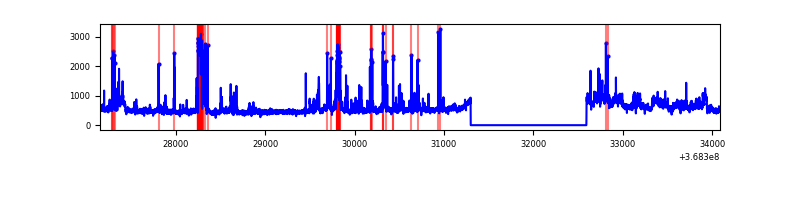 |
Top three noisy pixels from each quadrant. If the there are fewer than three noisy pixels in the level2.evt file, extra rows are filled as -1
| Pixel properties | Quadrant properties | ||||||
|---|---|---|---|---|---|---|---|
| Quadrant | DetID | PixID | Counts | Sigma | Mean | Median | Sigma |
| A | 13 | 254 | 10533 | 68.9 | 721 | 709 | 142.6 |
| A | 13 | 6 | 7001 | 44.13 | 721 | 709 | 142.6 |
| A | 3 | 137 | 6712 | 42.1 | 721 | 709 | 142.6 |
| B | 10 | 245 | 3013818 | 23229.26 | 695 | 678 | 129.7 |
| B | 6 | 159 | 1549678 | 11941.73 | 695 | 678 | 129.7 |
| B | 0 | 190 | 51429 | 391.26 | 695 | 678 | 129.7 |
| C | 0 | 10 | 548915 | 3515.19 | 677 | 684 | 156.0 |
| C | 14 | 238 | 113523 | 723.51 | 677 | 684 | 156.0 |
| C | 3 | 233 | 33734 | 211.91 | 677 | 684 | 156.0 |
| D | 8 | 195 | 404815 | 2523.52 | 680 | 662 | 160.2 |
| D | 12 | 218 | 400839 | 2498.69 | 680 | 662 | 160.2 |
| D | 12 | 227 | 63469 | 392.16 | 680 | 662 | 160.2 |
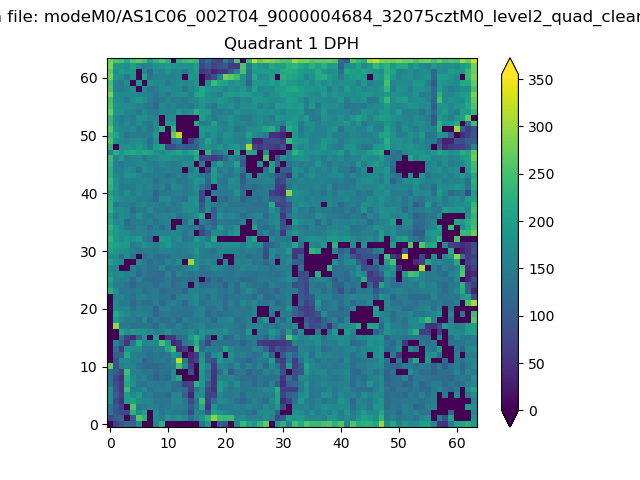
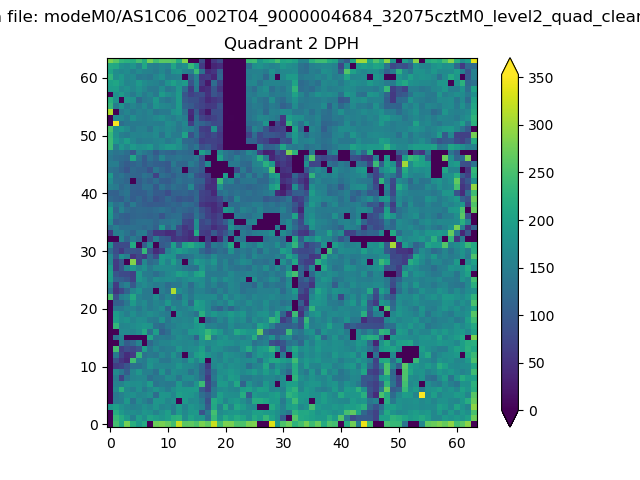
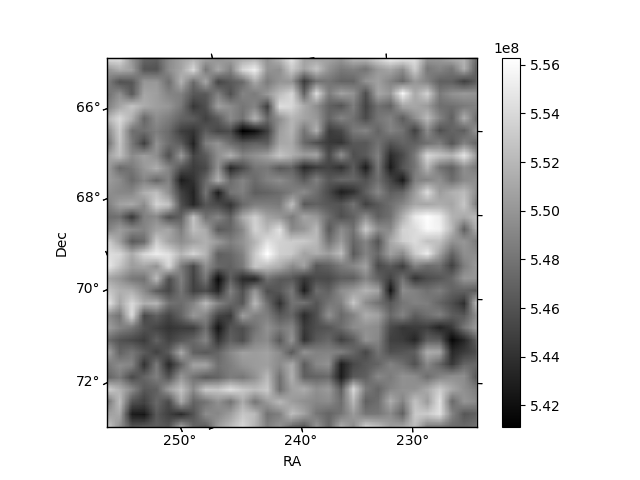
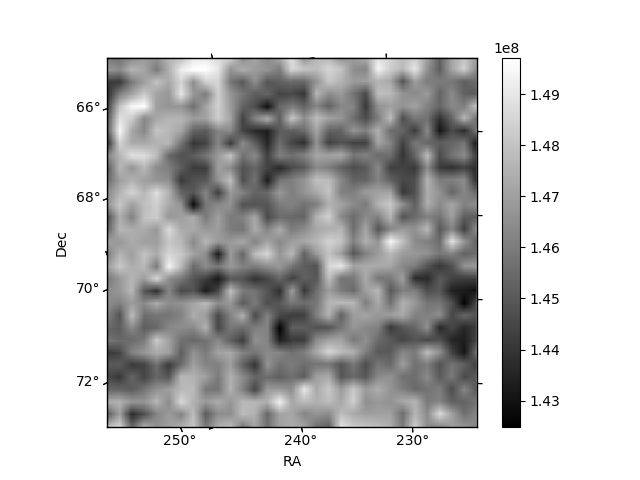
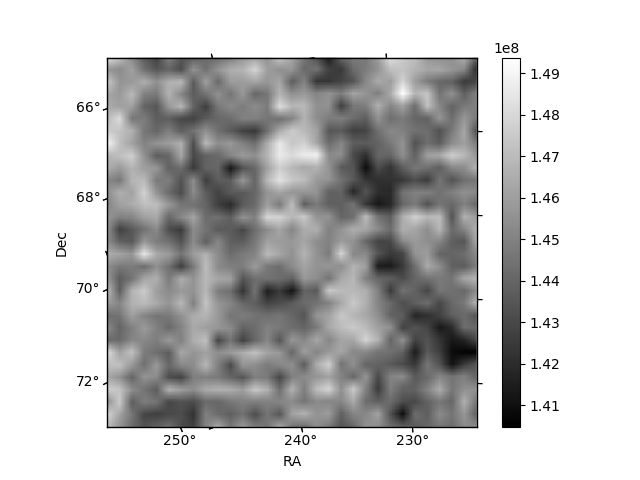
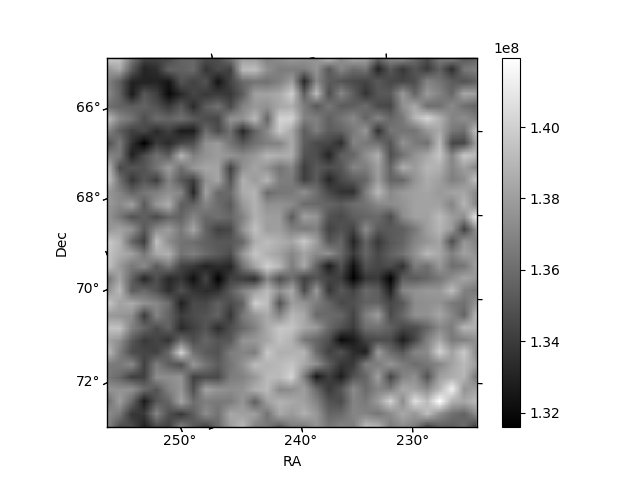
Histogram calculated using DETX and DETY for each event in the final _common_clean file
| Quadrant A | 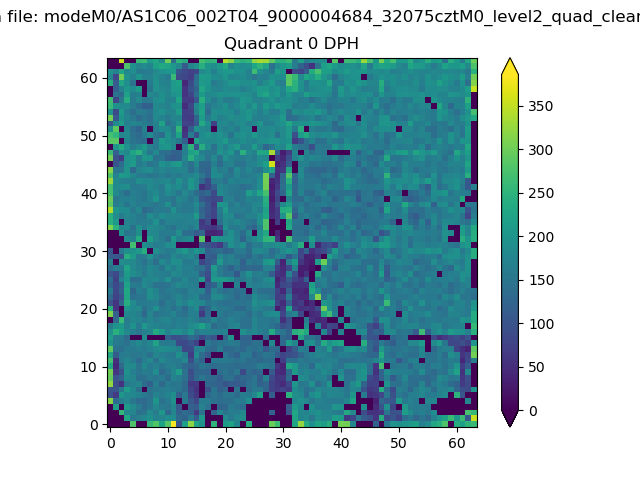 |
 |
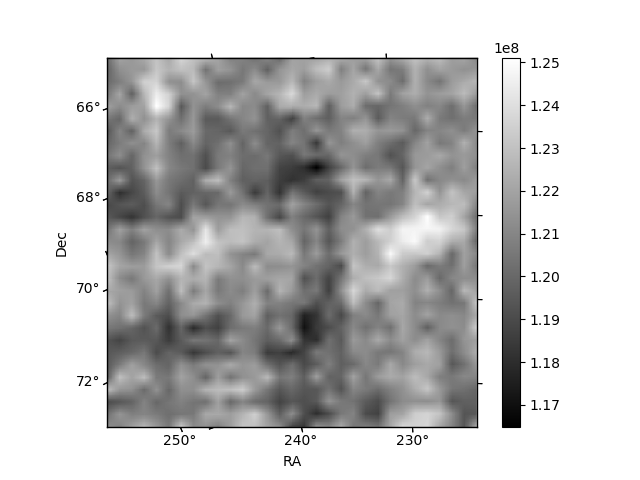
Quadrant B |
|---|---|---|---|
| Quadrant D | 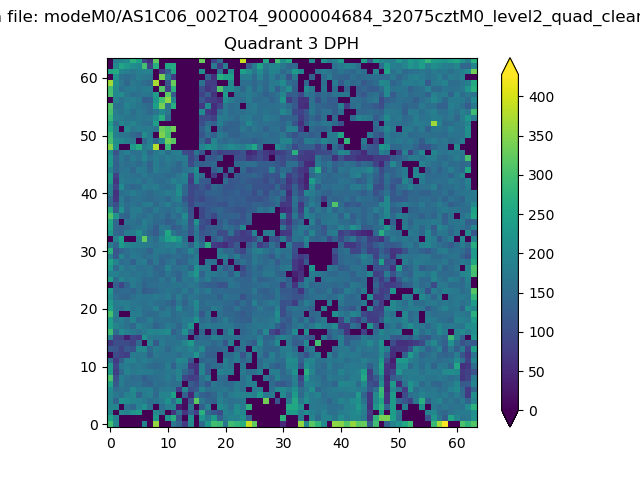 |
 |
Quadrant C |
| Plot type | Count rate plots | Images |
|---|---|---|
| Comparison with Poisson distribution Blue bars denote a histogram of data divided into 1 sec bins. Red curve is a Poisson curve with rate = median count rate of data. |
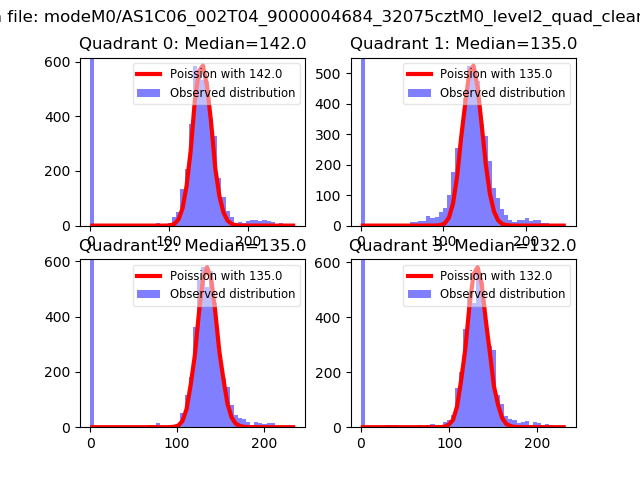 |
 |
| Quadrant-wise count rates Data is divided into 100 sec bins |
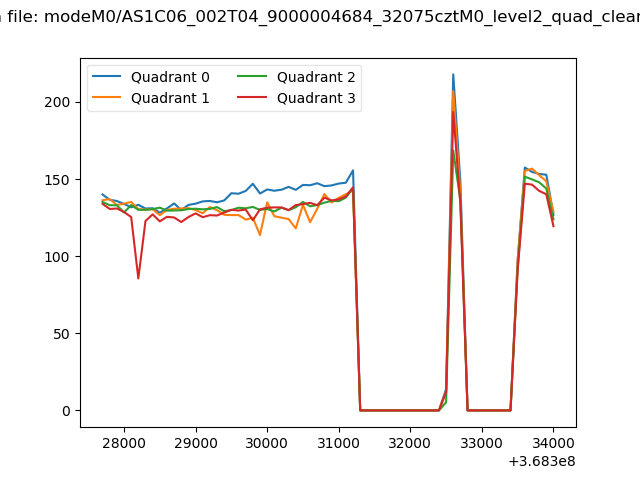 |
|
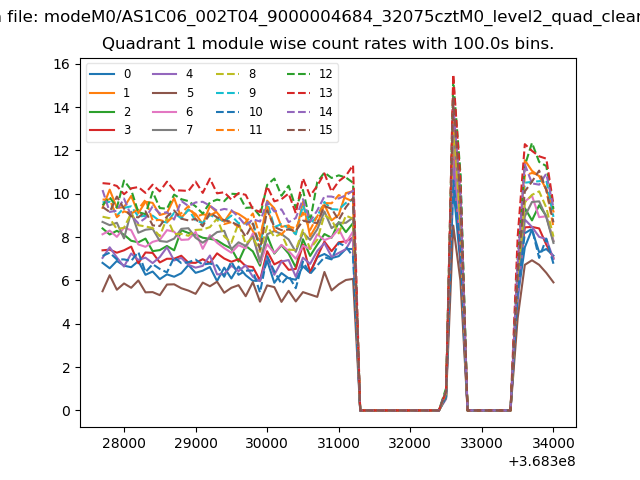
| Module-wise count rates for Quadrant A Data is divided into 100 sec bins |
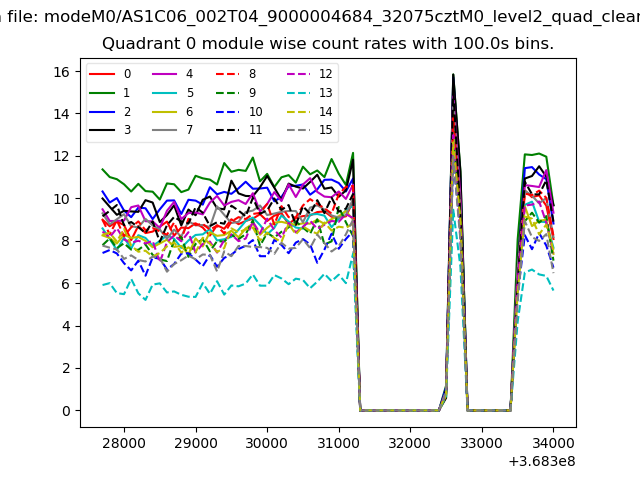 |
 |
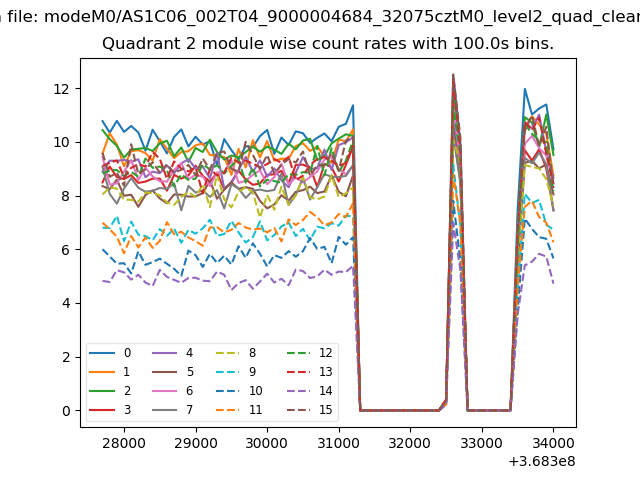
| Module-wise count rates for Quadrant B Data is divided into 100 sec bins |
 |
 |
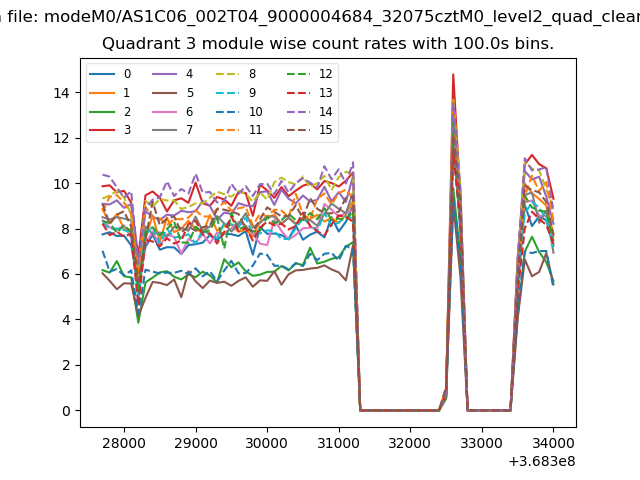
| Module-wise count rates for Quadrant C Data is divided into 100 sec bins |
 |
 |
| Module-wise count rates for Quadrant D Data is divided into 100 sec bins |
 |
 |
| Parameter | Plot |
|---|---|
| CZT HV Monitor |  |
| D_VDD | 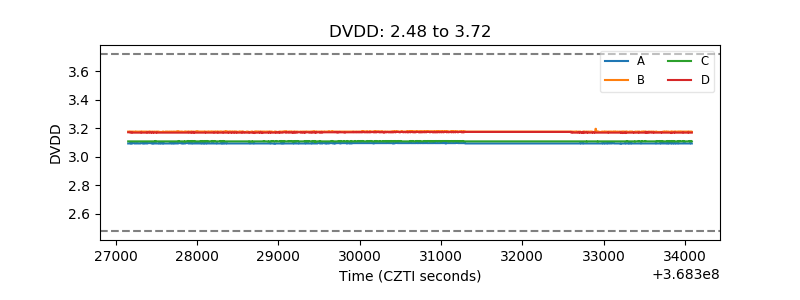 |
| Temperature 1 | 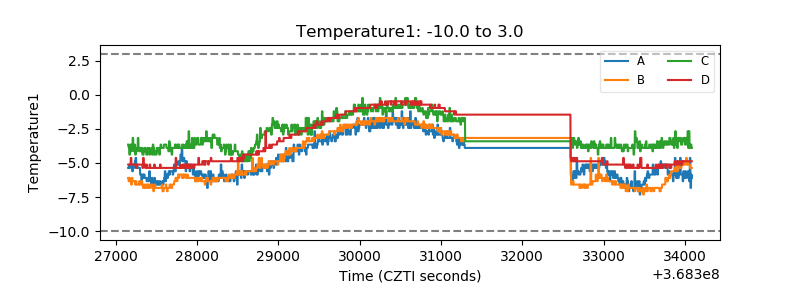 |
| Veto HV Monitor | 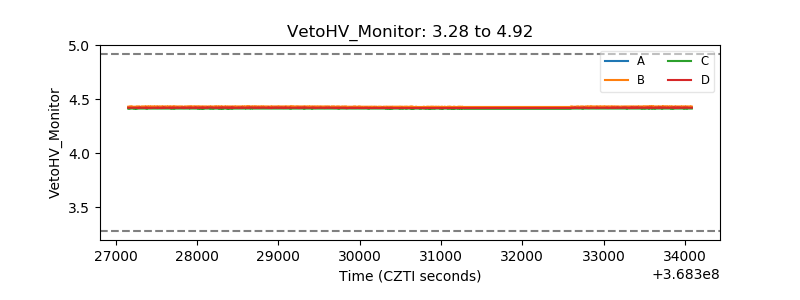 |
| Veto LLD | 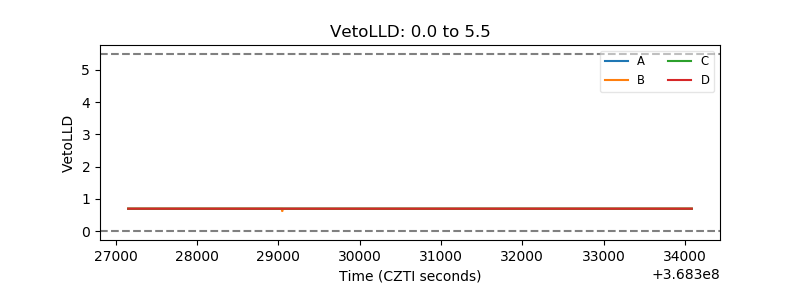 |
| Alpha Counter | 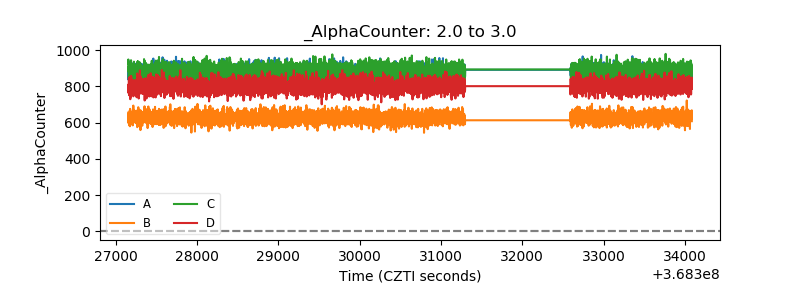 |
| _CPM_Rate | 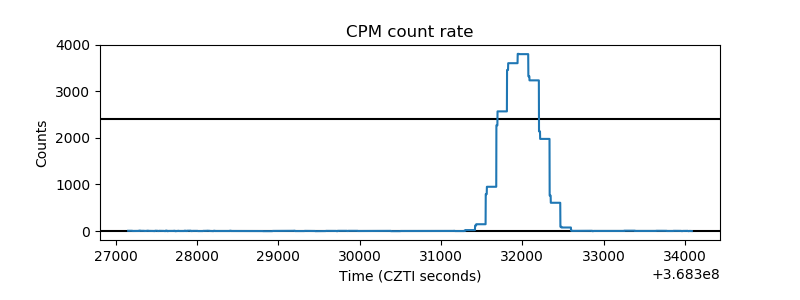 |
| CZT Counter | 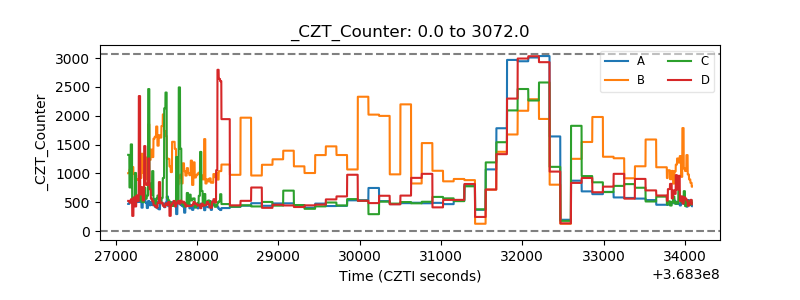 |
| +2.5 Volts monitor |  |
| +5 Volts monitor |  |
| _ROLL_ROT | 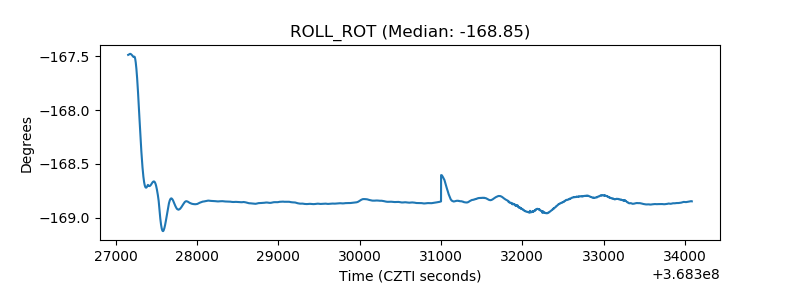 |
| _Roll_DEC | 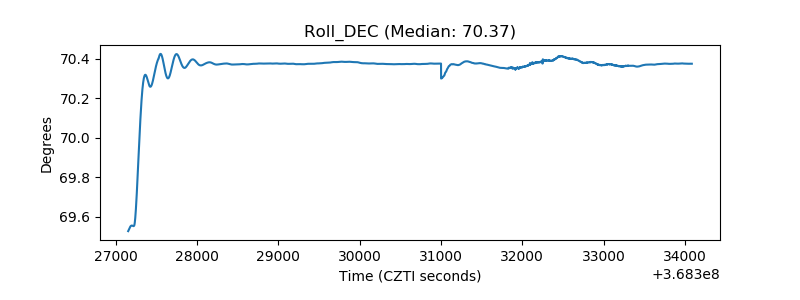 |
| _Roll_RA | 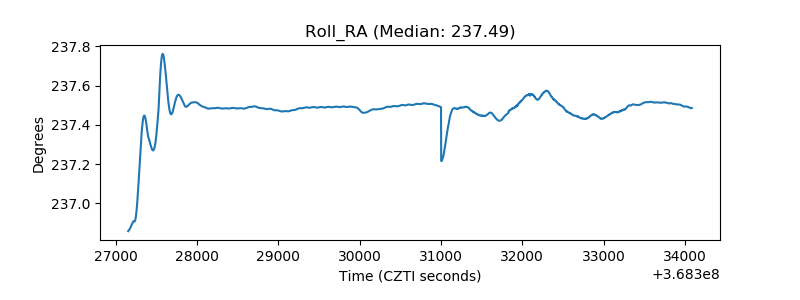 |
| Veto Counter | 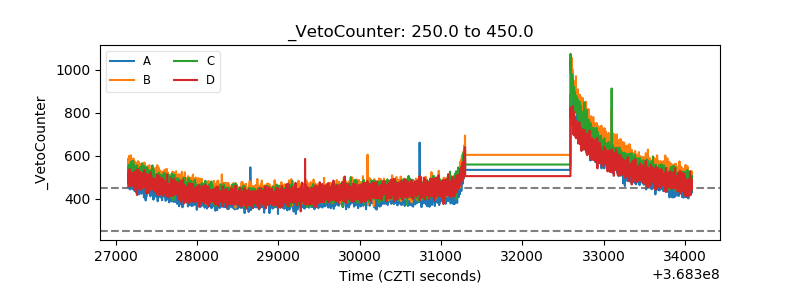 |