| Param | Original file | Final file |
|---|---|---|
| Filename | modeM0/AS1C06_002T04_9000004684_32076cztM0_level2.evt | modeM0/AS1C06_002T04_9000004684_32076cztM0_level2_quad_clean.evt |
| Size (bytes) | 659,468,160 | 101,643,840 |
| Size | 628.9 MB | 96.9 MB |
| Events in quadrant A | 2,939,505 | 715,165 |
| Events in quadrant B | 8,289,921 | 659,768 |
| Events in quadrant C | 3,433,259 | 665,126 |
| Events in quadrant D | 4,922,543 | 637,258 |
| Mode M9 | |||
|---|---|---|---|
| Quadrant | BADHDUFLAG | Total packets | Discarded packets |
| A | 0 | 13 | 0 |
| B | 0 | 13 | 0 |
| C | 0 | 13 | 0 |
| D | 0 | 13 | 0 |
| Mode M0 | |||
|---|---|---|---|
| Quadrant | BADHDUFLAG | Total packets | Discarded packets |
| A | 0 | 12090 | 1 |
| B | 0 | 28654 | 1 |
| C | 0 | 13775 | 1 |
| D | 0 | 18599 | 1 |
| Mode SS | |||
|---|---|---|---|
| Quadrant | BADHDUFLAG | Total packets | Discarded packets |
| A | 0 | 118 | 0 |
| B | 0 | 118 | 0 |
| C | 0 | 118 | 0 |
| D | 0 | 118 | 0 |
| Quadrant | Total seconds | Saturated seconds | Saturation percentage |
|---|---|---|---|
| A | 5722 | 37 | 0.646627% |
| B | 5723 | 1422 | 24.847108% |
| C | 5723 | 170 | 2.970470% |
| D | 5723 | 516 | 9.016250% |
Noise dominated data is calculated using 1-second bins in cleaned event files. If a bin has >2000 counts, and if more than 50% of those come from <1% of pixels, then it is considered to be noise-dominated and hence unusable.
| Quadrant | # 1 sec bins | Bins with >0 counts | Bins with >2000 counts | High rate bins dominated by noise | Noise dominated (total time) | Noise dominated (detector-on time) | Marked lightcurve |
|---|---|---|---|---|---|---|---|
| A | 7077 | 5722 | 0 | 0 | 0.00% | 0.00% | 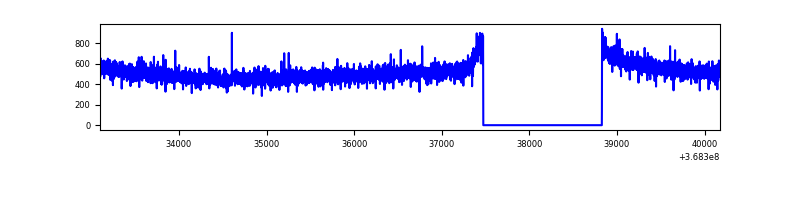 |
| B | 7078 | 5723 | 930 | 930 | 13.14% | 16.25% |  |
| C | 7078 | 5723 | 64 | 64 | 0.90% | 1.12% |  |
| D | 7078 | 5723 | 402 | 402 | 5.68% | 7.02% | 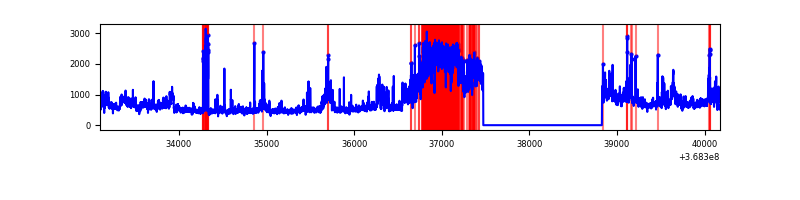 |
Top three noisy pixels from each quadrant. If the there are fewer than three noisy pixels in the level2.evt file, extra rows are filled as -1
| Pixel properties | Quadrant properties | ||||||
|---|---|---|---|---|---|---|---|
| Quadrant | DetID | PixID | Counts | Sigma | Mean | Median | Sigma |
| A | 13 | 254 | 10870 | 67.7 | 761 | 748 | 149.5 |
| A | 3 | 137 | 6888 | 41.07 | 761 | 748 | 149.5 |
| A | 0 | 226 | 6595 | 39.11 | 761 | 748 | 149.5 |
| B | 10 | 245 | 3940849 | 29998.14 | 711 | 697 | 131.3 |
| B | 6 | 159 | 1476151 | 11233.29 | 711 | 697 | 131.3 |
| B | 0 | 190 | 46131 | 345.91 | 711 | 697 | 131.3 |
| C | 0 | 10 | 382901 | 2365.26 | 703 | 708 | 161.6 |
| C | 14 | 238 | 126736 | 779.94 | 703 | 708 | 161.6 |
| C | 3 | 233 | 106236 | 653.08 | 703 | 708 | 161.6 |
| D | 12 | 227 | 1344879 | 8181.61 | 704 | 686 | 164.3 |
| D | 8 | 195 | 728613 | 4430.63 | 704 | 686 | 164.3 |
| D | 2 | 250 | 132283 | 800.98 | 704 | 686 | 164.3 |
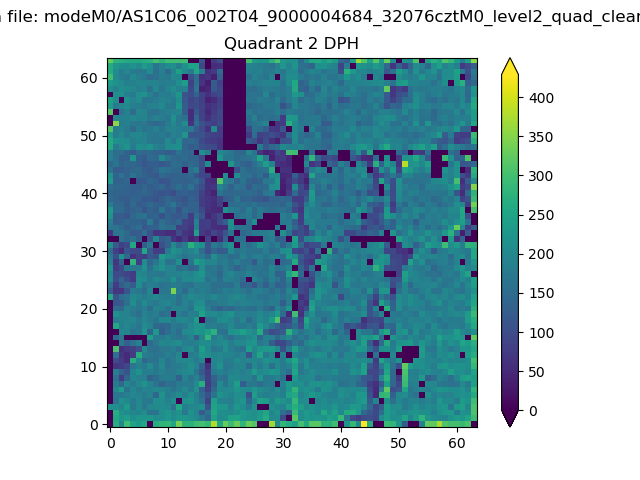
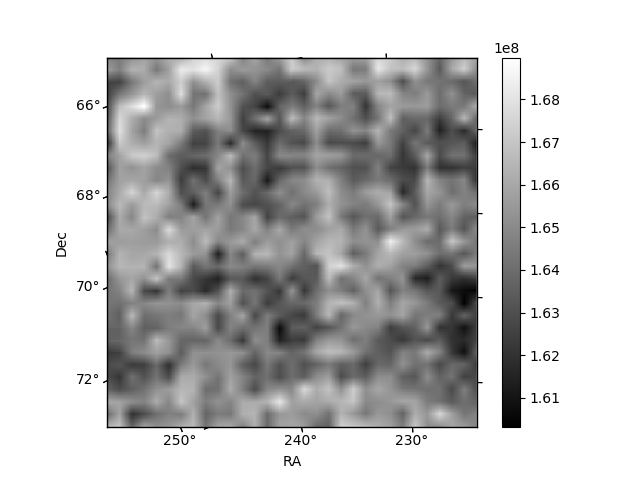
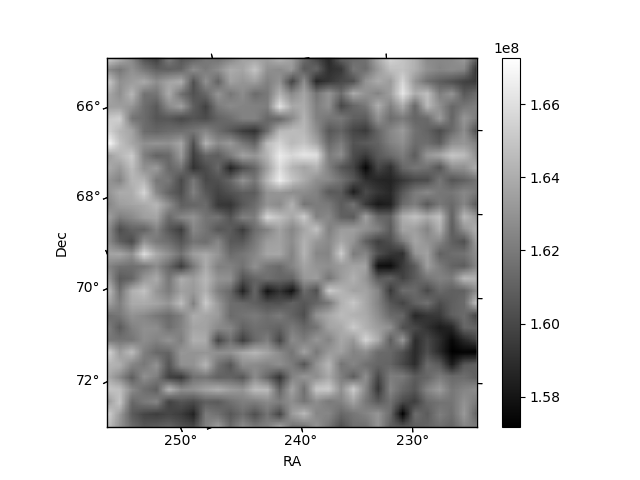
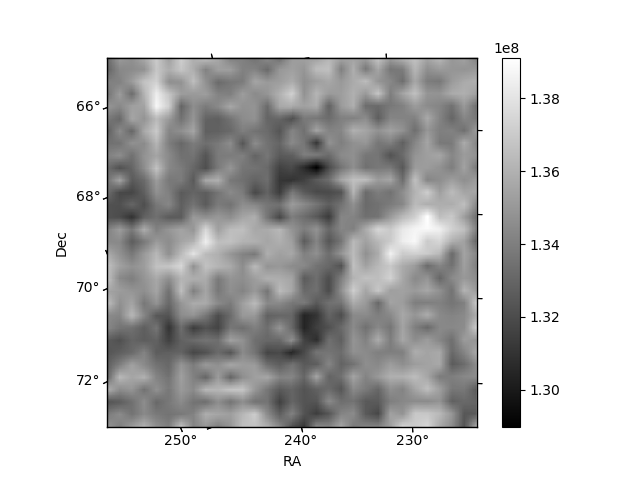
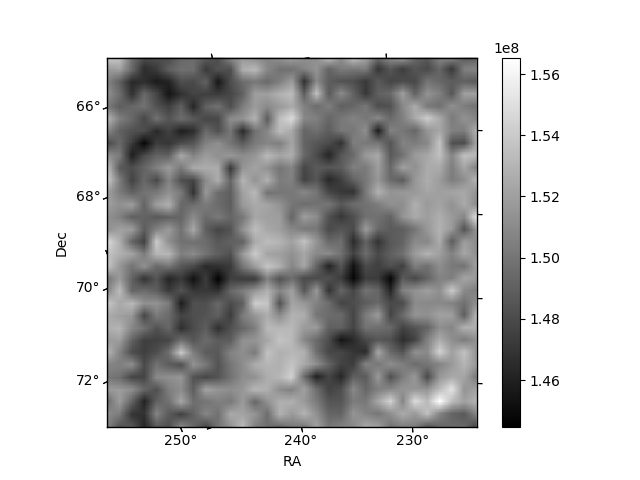
Histogram calculated using DETX and DETY for each event in the final _common_clean file
| Quadrant A | 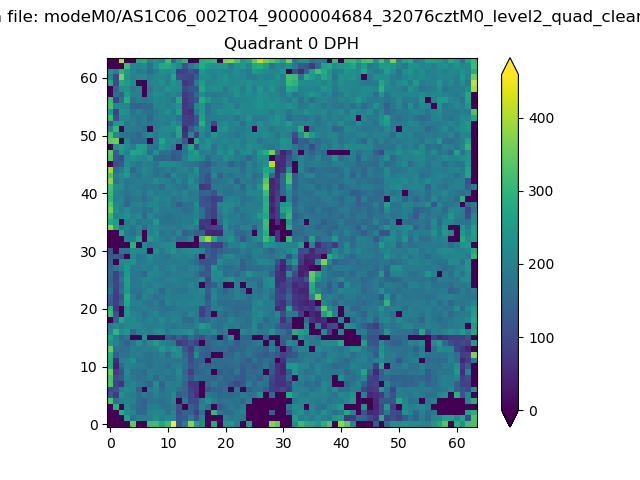 |
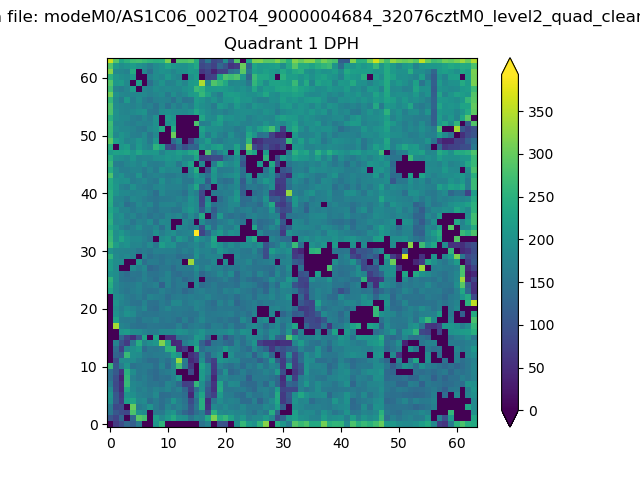 |
Quadrant B |
|---|---|---|---|
| Quadrant D |  |
 |
Quadrant C |
| Plot type | Count rate plots | Images |
|---|---|---|
| Comparison with Poisson distribution Blue bars denote a histogram of data divided into 1 sec bins. Red curve is a Poisson curve with rate = median count rate of data. |
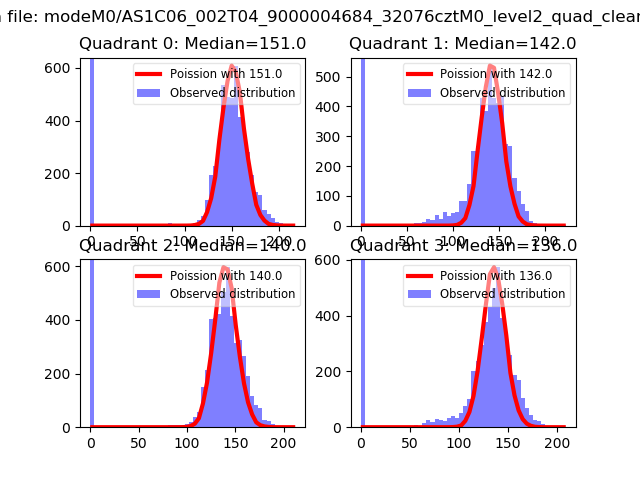 |
 |
| Quadrant-wise count rates Data is divided into 100 sec bins |
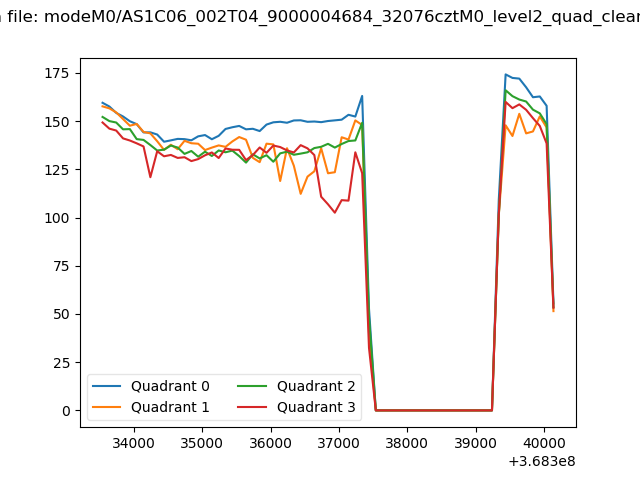 |
|
| Module-wise count rates for Quadrant A Data is divided into 100 sec bins |
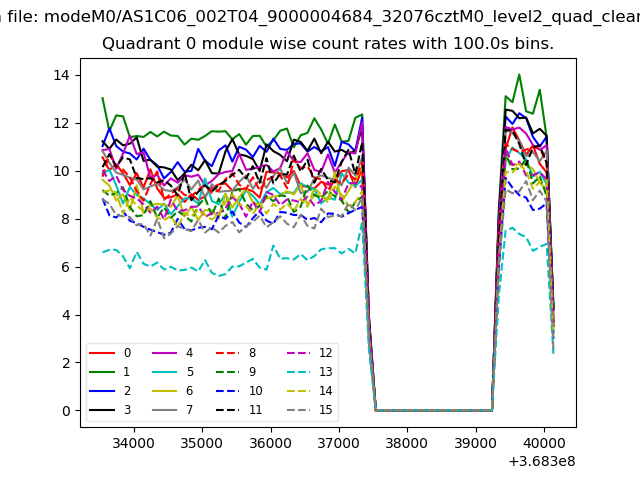 |
 |
| Module-wise count rates for Quadrant B Data is divided into 100 sec bins |
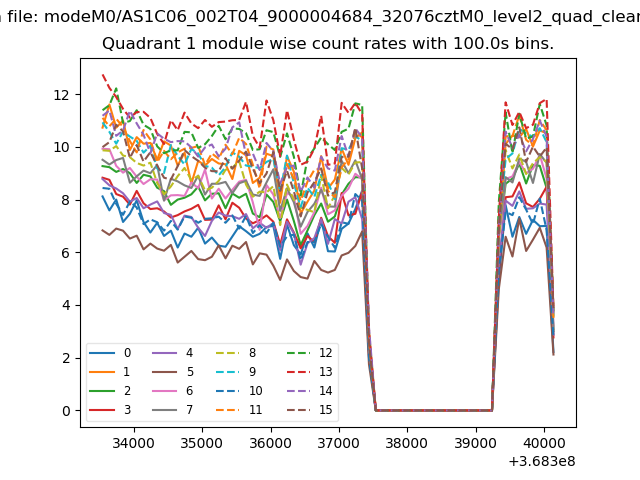 |
 |
| Module-wise count rates for Quadrant C Data is divided into 100 sec bins |
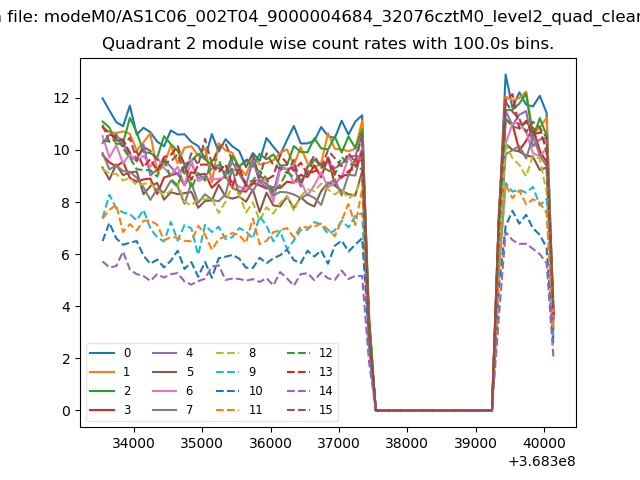 |
 |
| Module-wise count rates for Quadrant D Data is divided into 100 sec bins |
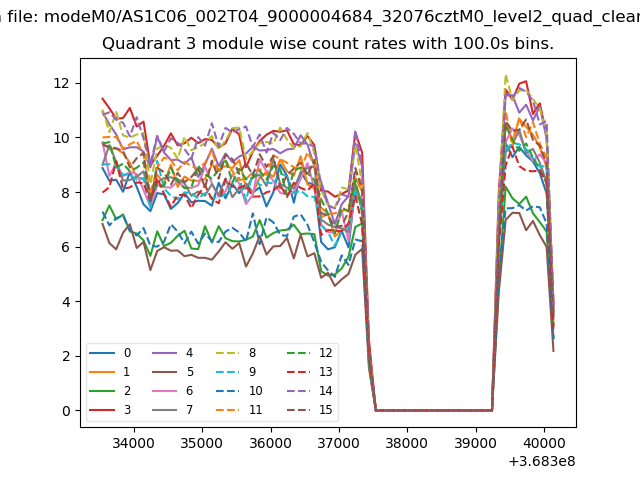 |
 |
| Parameter | Plot |
|---|---|
| CZT HV Monitor | 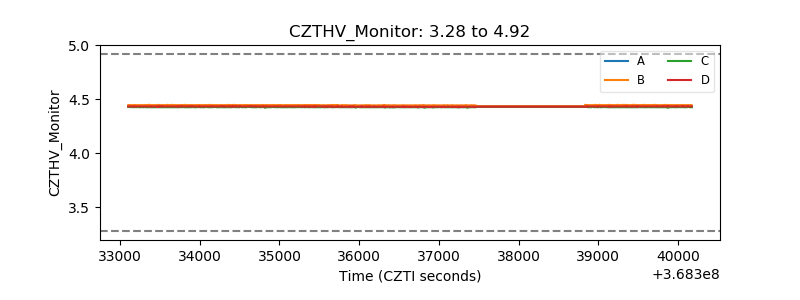 |
| D_VDD | 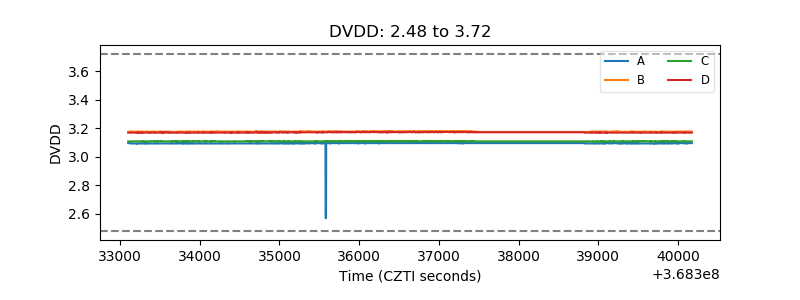 |
| Temperature 1 | 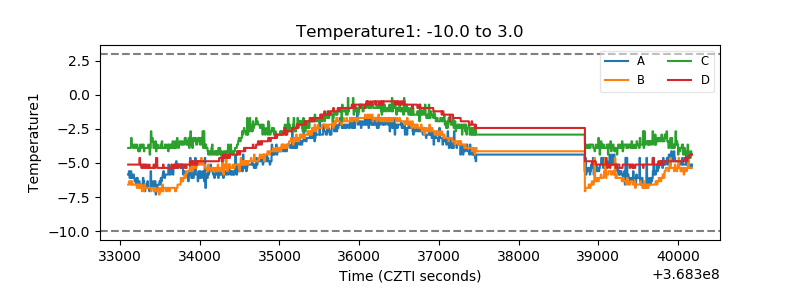 |
| Veto HV Monitor | 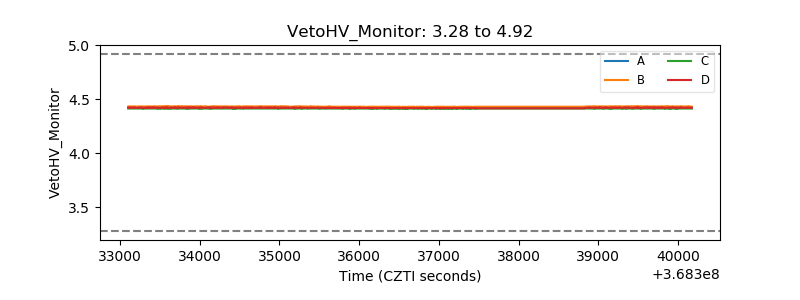 |
| Veto LLD |  |
| Alpha Counter | 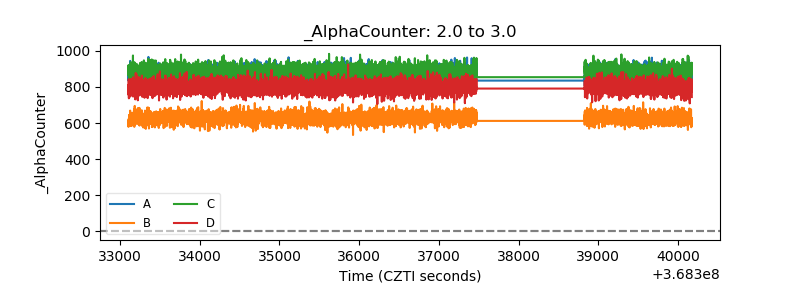 |
| _CPM_Rate | 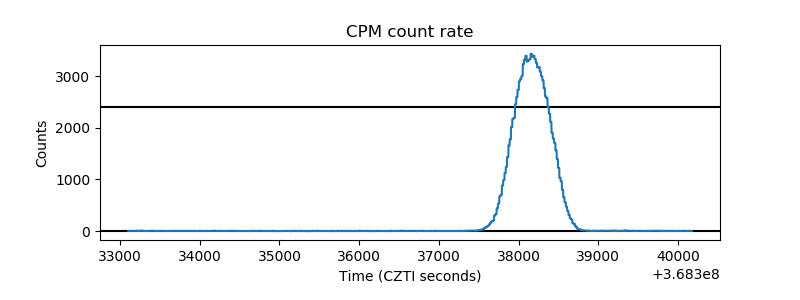 |
| CZT Counter | 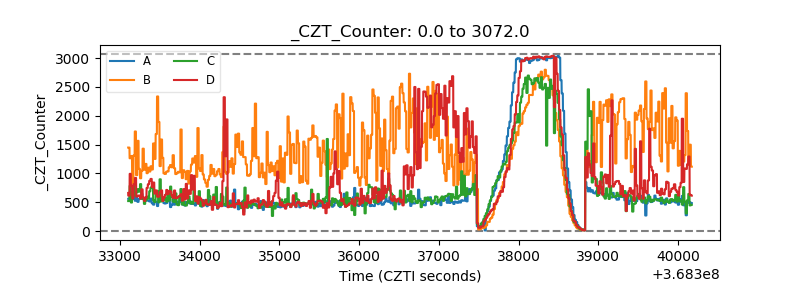 |
| +2.5 Volts monitor |  |
| +5 Volts monitor |  |
| _ROLL_ROT | 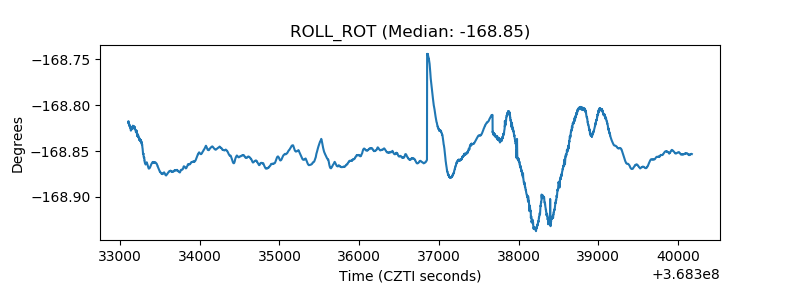 |
| _Roll_DEC | 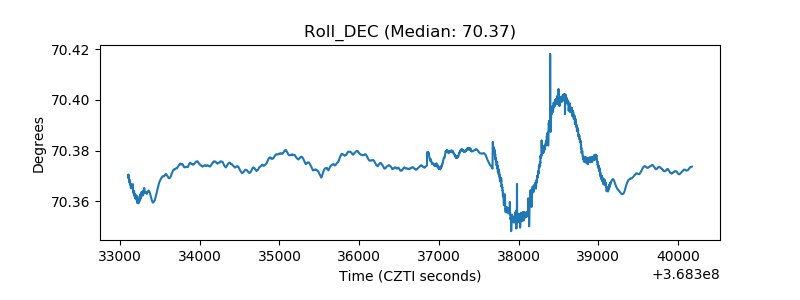 |
| _Roll_RA | 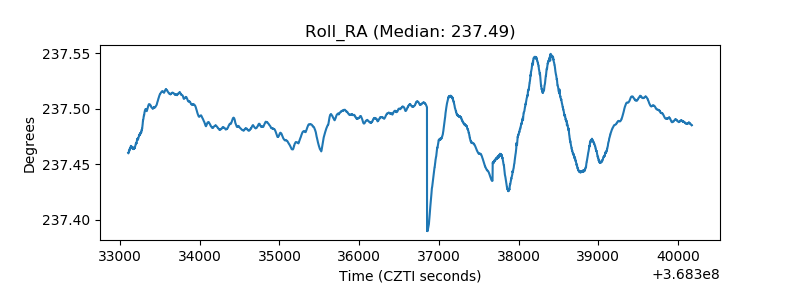 |
| Veto Counter | 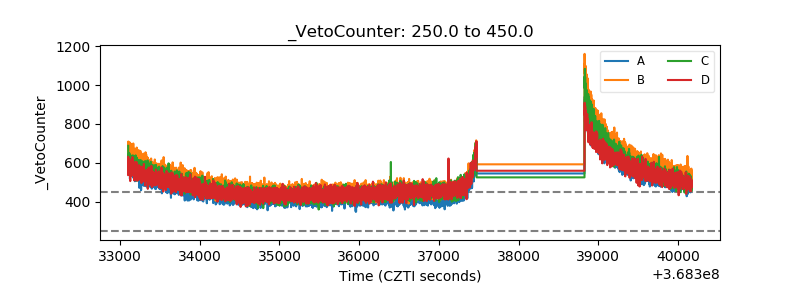 |