| Param | Original file | Final file |
|---|---|---|
| Filename | modeM0/AS1C06_002T04_9000004684_32078cztM0_level2.evt | modeM0/AS1C06_002T04_9000004684_32078cztM0_level2_quad_clean.evt |
| Size (bytes) | 44,948,160 | 8,429,760 |
| Size | 42.9 MB | 8.0 MB |
| Events in quadrant A | 263,948 | 77,694 |
| Events in quadrant B | 432,930 | 26,155 |
| Events in quadrant C | 306,959 | 59,943 |
| Events in quadrant D | 326,583 | 54,707 |
| Mode M9 | |||
|---|---|---|---|
| Quadrant | BADHDUFLAG | Total packets | Discarded packets |
| A | 0 | 12 | 9 |
| B | 0 | 16 | 14 |
| C | 0 | 14 | 11 |
| D | 0 | 15 | 12 |
| Mode M0 | |||
|---|---|---|---|
| Quadrant | BADHDUFLAG | Total packets | Discarded packets |
| A | 0 | 6926 | 5860 |
| B | 0 | 19552 | 18112 |
| C | 0 | 10719 | 9514 |
| D | 0 | 10333 | 9105 |
| Mode SS | |||
|---|---|---|---|
| Quadrant | BADHDUFLAG | Total packets | Discarded packets |
| A | 0 | 71 | 61 |
| B | 0 | 77 | 63 |
| C | 0 | 75 | 63 |
| D | 0 | 69 | 51 |
| Quadrant | Total seconds | Saturated seconds | Saturation percentage |
|---|---|---|---|
| A | 504 | 5 | 0.992063% |
| B | 228 | 144 | 63.157895% |
| C | 430 | 28 | 6.511628% |
| D | 378 | 5 | 1.322751% |
Noise dominated data is calculated using 1-second bins in cleaned event files. If a bin has >2000 counts, and if more than 50% of those come from <1% of pixels, then it is considered to be noise-dominated and hence unusable.
| Quadrant | # 1 sec bins | Bins with >0 counts | Bins with >2000 counts | High rate bins dominated by noise | Noise dominated (total time) | Noise dominated (detector-on time) | Marked lightcurve |
|---|---|---|---|---|---|---|---|
| A | 7107 | 717 | 0 | 0 | 0.00% | 0.00% | 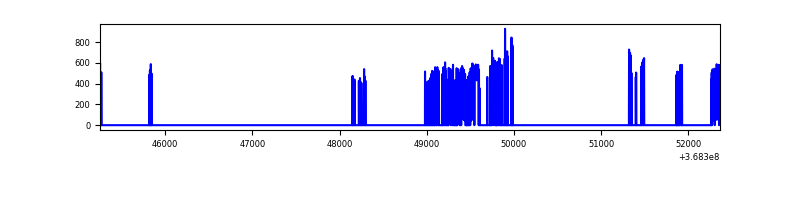 |
| B | 6534 | 288 | 110 | 110 | 1.68% | 38.19% | 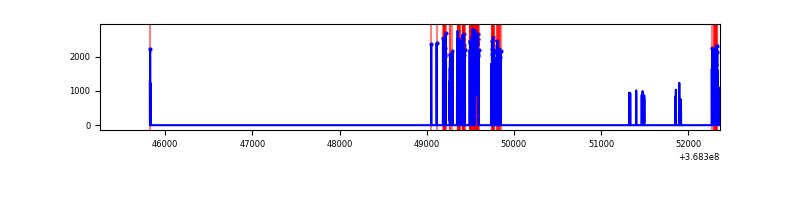 |
| C | 6553 | 607 | 4 | 4 | 0.06% | 0.66% | 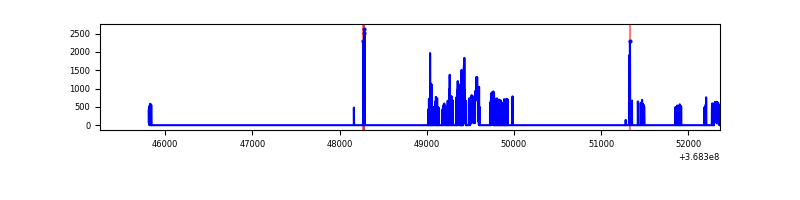 |
| D | 7086 | 556 | 2 | 2 | 0.03% | 0.36% | 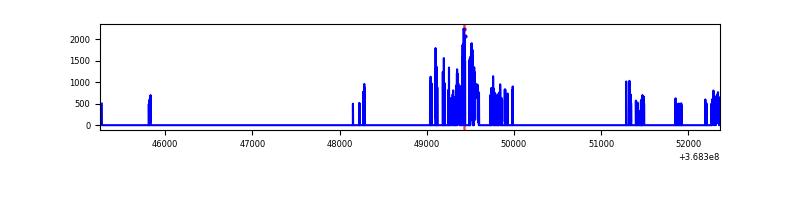 |
Top three noisy pixels from each quadrant. If the there are fewer than three noisy pixels in the level2.evt file, extra rows are filled as -1
| Pixel properties | Quadrant properties | ||||||
|---|---|---|---|---|---|---|---|
| Quadrant | DetID | PixID | Counts | Sigma | Mean | Median | Sigma |
| A | 13 | 254 | 1006 | 59.83 | 68 | 66 | 15.7 |
| A | 3 | 137 | 654 | 37.43 | 68 | 66 | 15.7 |
| A | 0 | 226 | 633 | 36.09 | 68 | 66 | 15.7 |
| B | 10 | 245 | 286883 | 42865.4 | 24 | 23 | 6.7 |
| B | 6 | 159 | 47197 | 7049.2 | 24 | 23 | 6.7 |
| B | 5 | 172 | 1672 | 246.41 | 24 | 23 | 6.7 |
| C | 3 | 233 | 74000 | 5136.64 | 54 | 54 | 14.4 |
| C | 14 | 238 | 9284 | 641.16 | 54 | 54 | 14.4 |
| C | 0 | 10 | 8293 | 572.32 | 54 | 54 | 14.4 |
| D | 12 | 227 | 69835 | 5050.62 | 50 | 48 | 13.8 |
| D | 8 | 195 | 60696 | 4389.21 | 50 | 48 | 13.8 |
| D | 12 | 233 | 4351 | 311.42 | 50 | 48 | 13.8 |
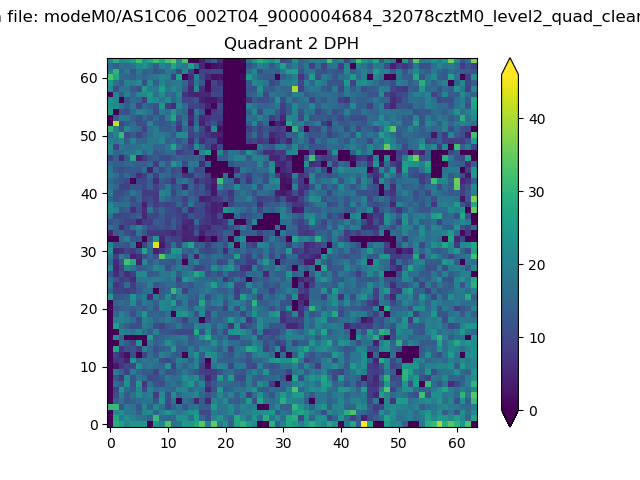
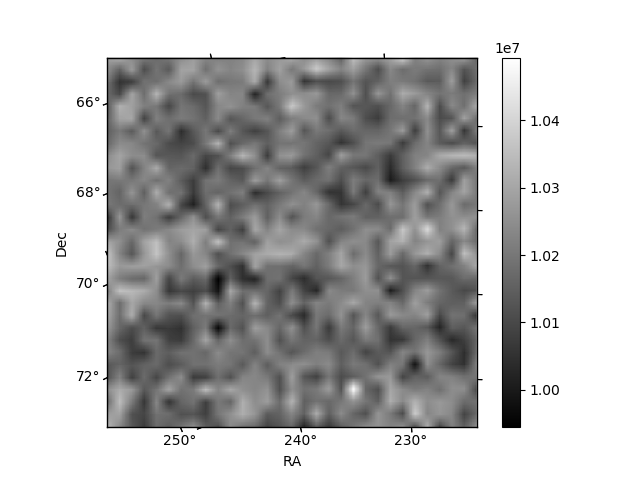
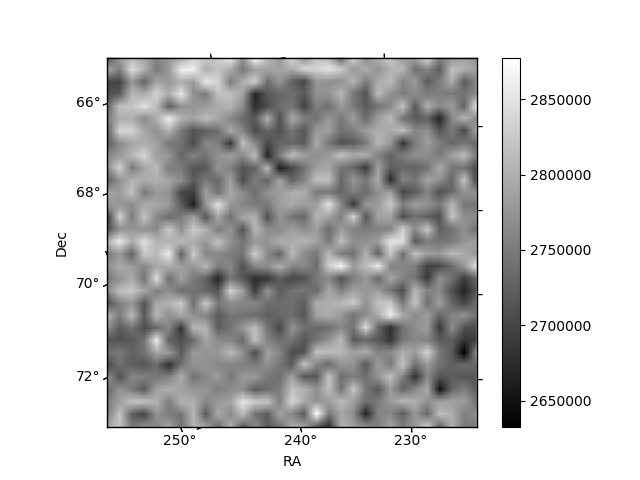
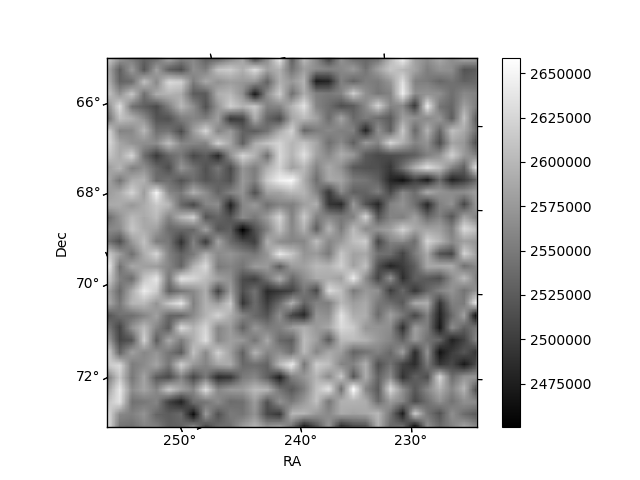
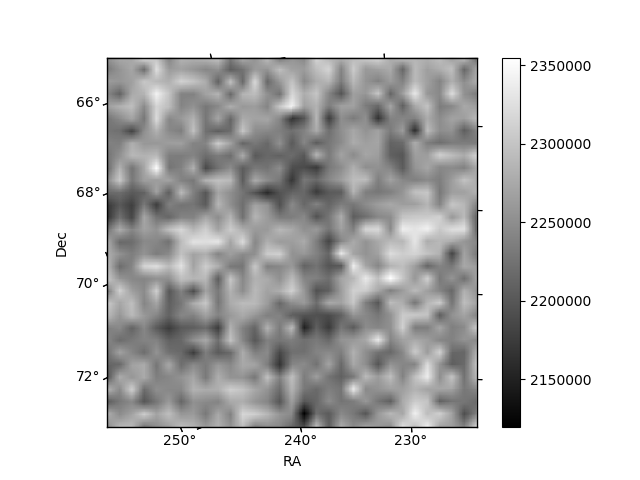
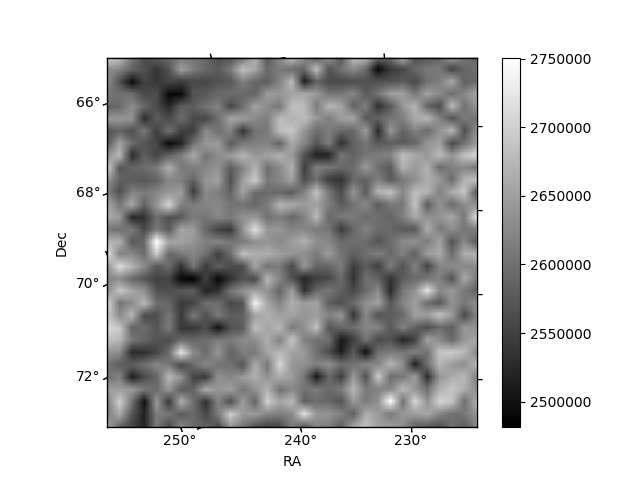
Histogram calculated using DETX and DETY for each event in the final _common_clean file
| Quadrant A | 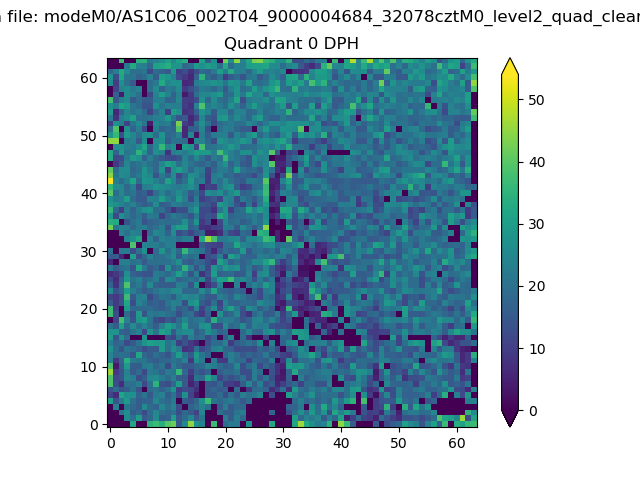 |
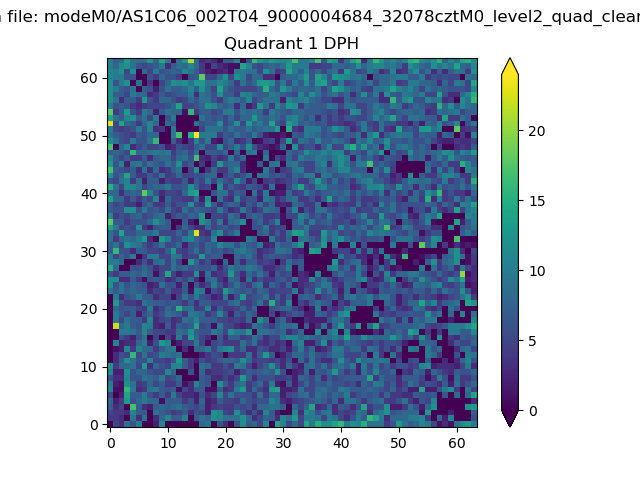 |
Quadrant B |
|---|---|---|---|
| Quadrant D | 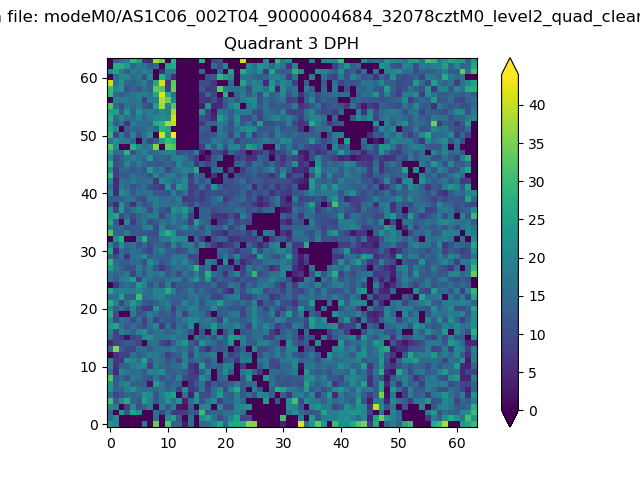 |
 |
Quadrant C |
| Plot type | Count rate plots | Images |
|---|---|---|
| Comparison with Poisson distribution Blue bars denote a histogram of data divided into 1 sec bins. Red curve is a Poisson curve with rate = median count rate of data. |
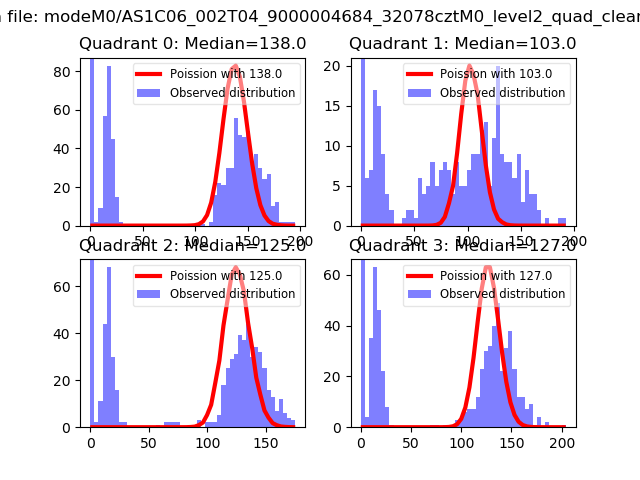 |
 |
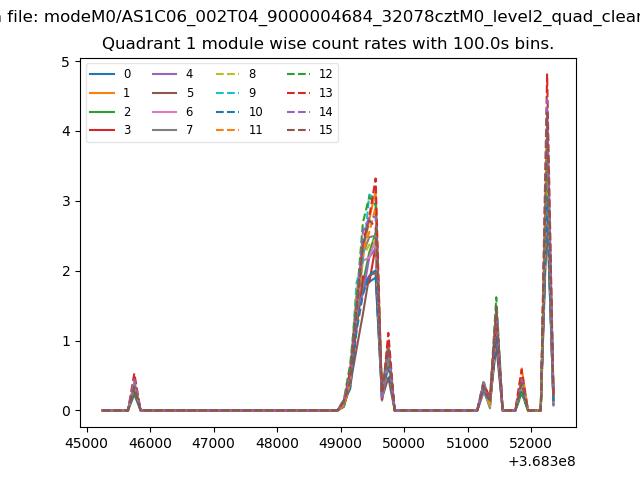
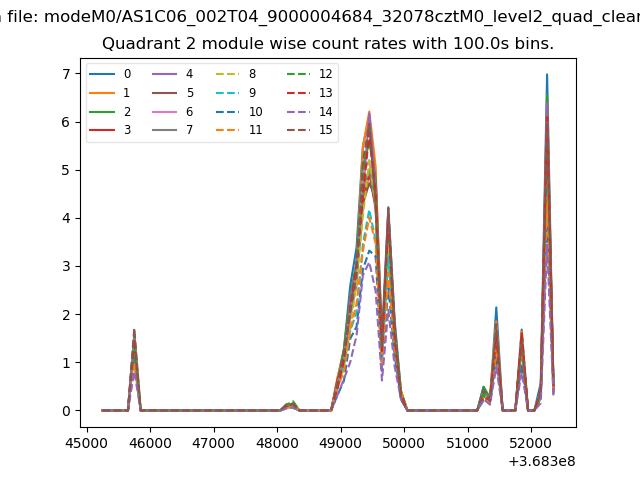
| Quadrant-wise count rates Data is divided into 100 sec bins |
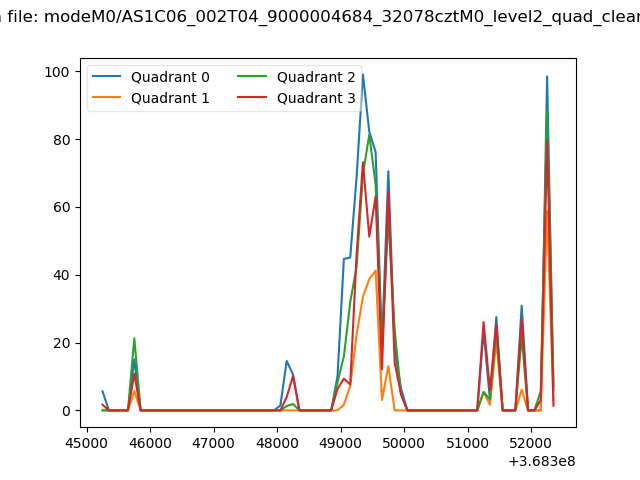 |
|
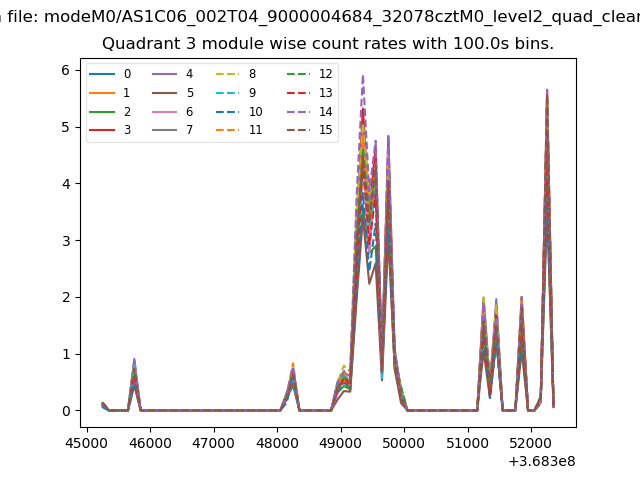
| Module-wise count rates for Quadrant A Data is divided into 100 sec bins |
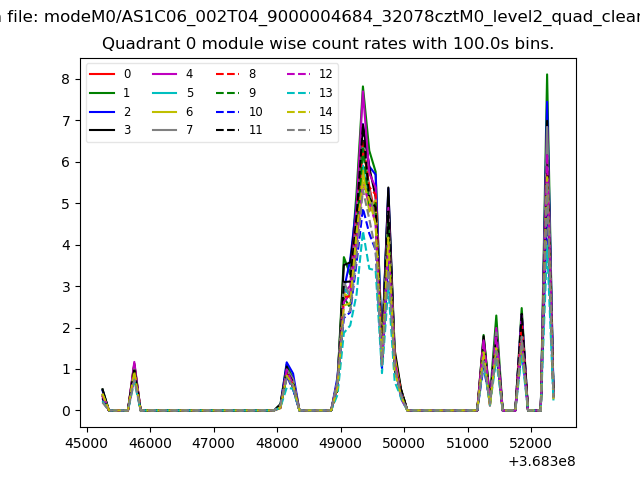 |
 |
| Module-wise count rates for Quadrant B Data is divided into 100 sec bins |
 |
 |
| Module-wise count rates for Quadrant C Data is divided into 100 sec bins |
 |
 |
| Module-wise count rates for Quadrant D Data is divided into 100 sec bins |
 |
 |
| Parameter | Plot |
|---|---|
| CZT HV Monitor | 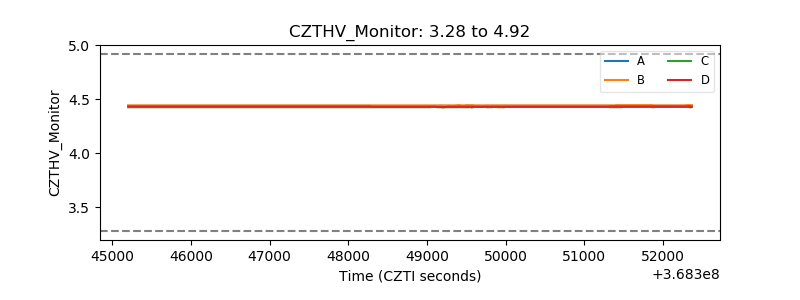 |
| D_VDD | 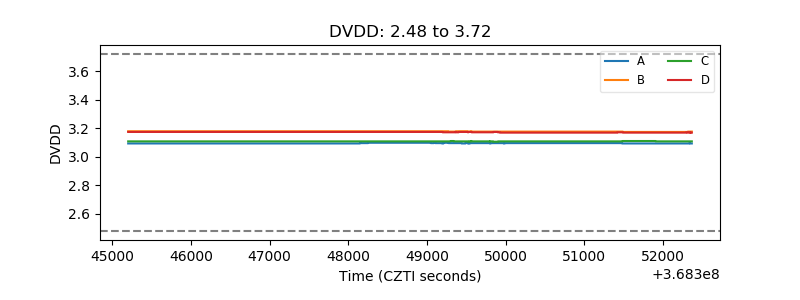 |
| Temperature 1 | 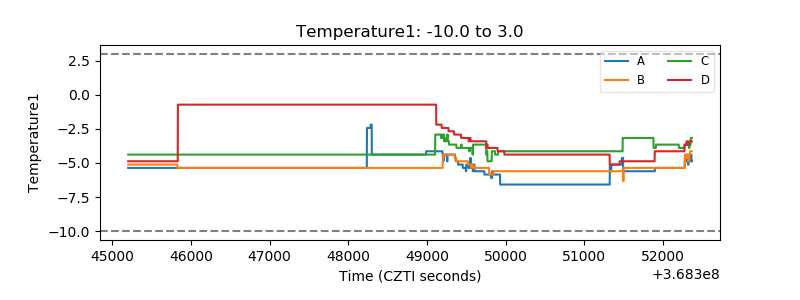 |
| Veto HV Monitor | 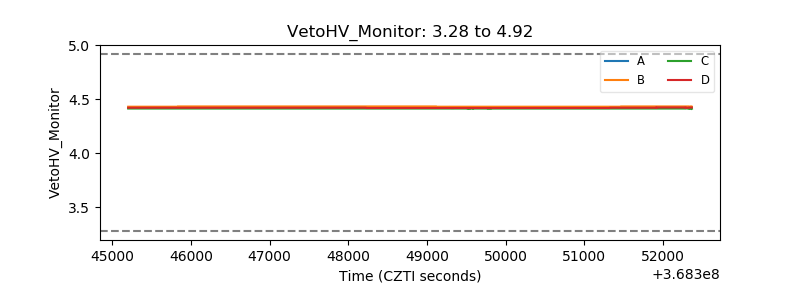 |
| Veto LLD | 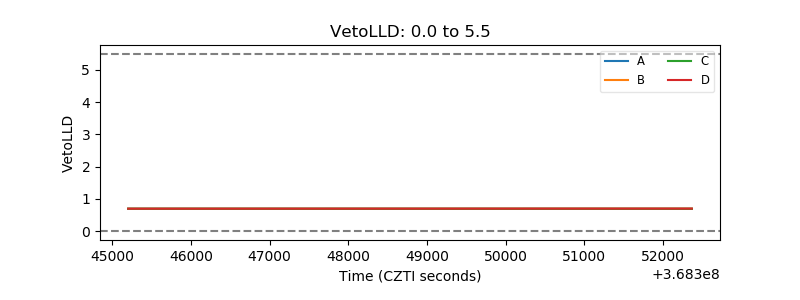 |
| Alpha Counter | 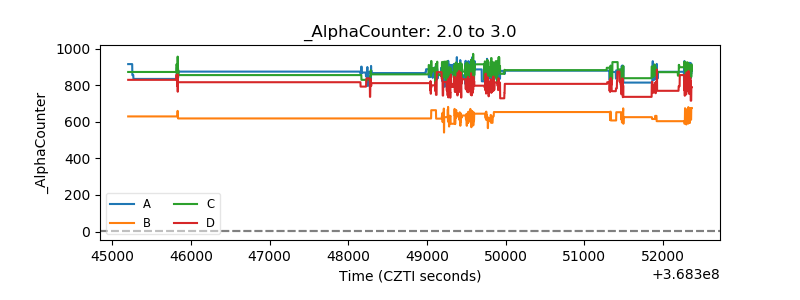 |
| _CPM_Rate | 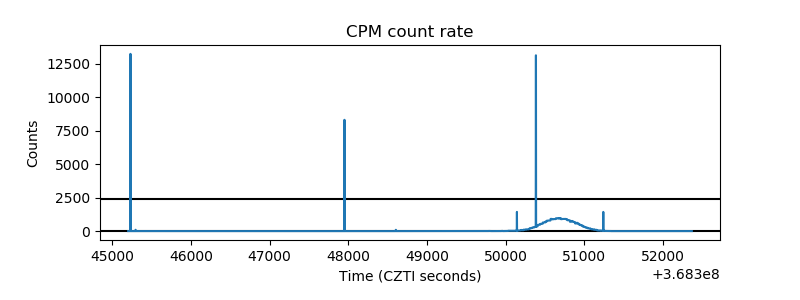 |
| CZT Counter | 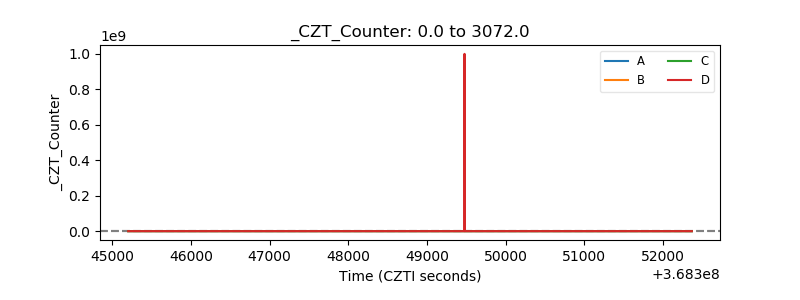 |
| +2.5 Volts monitor |  |
| +5 Volts monitor |  |
| _ROLL_ROT | 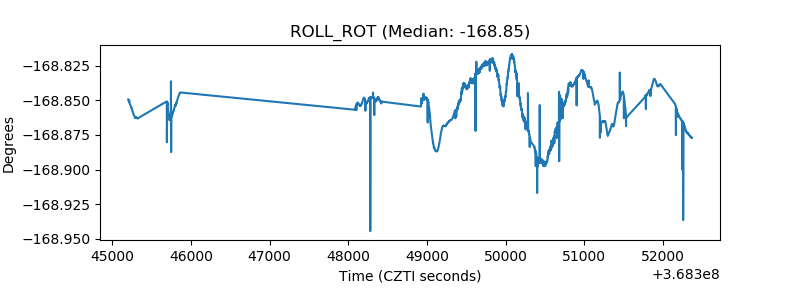 |
| _Roll_DEC | 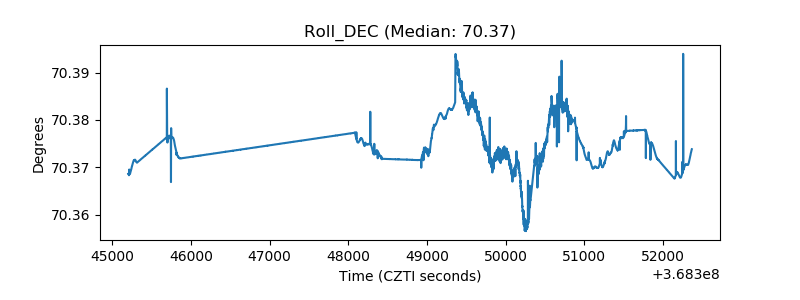 |
| _Roll_RA | 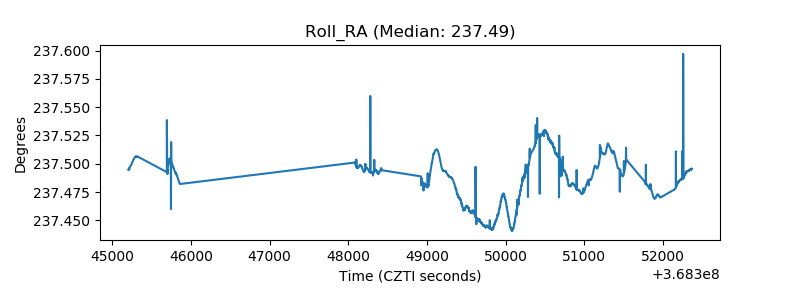 |
| Veto Counter | 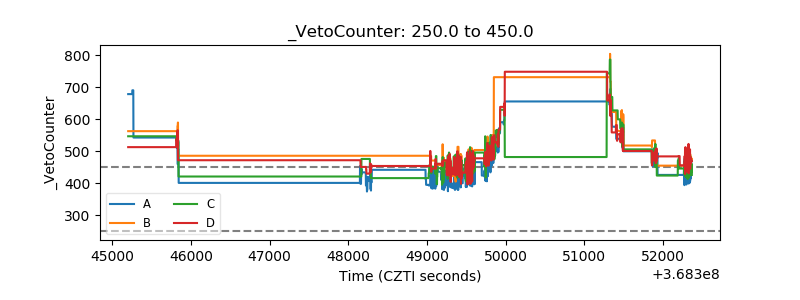 |