| Param | Original file | Final file |
|---|---|---|
| Filename | modeM0/AS1C06_002T04_9000004684_32079cztM0_level2.evt | modeM0/AS1C06_002T04_9000004684_32079cztM0_level2_quad_clean.evt |
| Size (bytes) | 1,362,450,240 | 198,866,880 |
| Size | 1.3 GB | 189.7 MB |
| Events in quadrant A | 5,221,584 | 1,494,288 |
| Events in quadrant B | 18,528,680 | 1,154,171 |
| Events in quadrant C | 8,430,429 | 1,287,167 |
| Events in quadrant D | 8,378,676 | 1,361,068 |
| Mode M9 | |||
|---|---|---|---|
| Quadrant | BADHDUFLAG | Total packets | Discarded packets |
| A | 0 | 22 | 0 |
| B | 0 | 22 | 0 |
| C | 0 | 22 | 0 |
| D | 0 | 22 | 0 |
| Mode M0 | |||
|---|---|---|---|
| Quadrant | BADHDUFLAG | Total packets | Discarded packets |
| A | 0 | 22134 | 458 |
| B | 0 | 64406 | 2295 |
| C | 0 | 33049 | 1102 |
| D | 0 | 32847 | 584 |
| Mode SS | |||
|---|---|---|---|
| Quadrant | BADHDUFLAG | Total packets | Discarded packets |
| A | 0 | 220 | 4 |
| B | 0 | 220 | 6 |
| C | 0 | 220 | 4 |
| D | 0 | 220 | 4 |
| Quadrant | Total seconds | Saturated seconds | Saturation percentage |
|---|---|---|---|
| A | 10502 | 142 | 1.352123% |
| B | 10343 | 5392 | 52.131877% |
| C | 10441 | 1263 | 12.096542% |
| D | 10494 | 285 | 2.715838% |
Noise dominated data is calculated using 1-second bins in cleaned event files. If a bin has >2000 counts, and if more than 50% of those come from <1% of pixels, then it is considered to be noise-dominated and hence unusable.
| Quadrant | # 1 sec bins | Bins with >0 counts | Bins with >2000 counts | High rate bins dominated by noise | Noise dominated (total time) | Noise dominated (detector-on time) | Marked lightcurve |
|---|---|---|---|---|---|---|---|
| A | 12986 | 10612 | 0 | 0 | 0.00% | 0.00% | 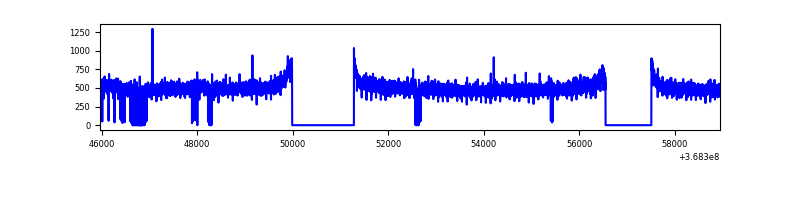 |
| B | 12985 | 10428 | 4226 | 4226 | 32.55% | 40.53% | 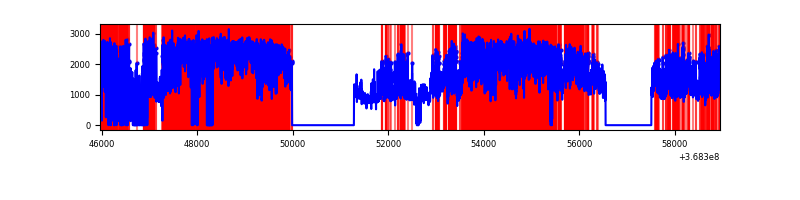 |
| C | 12985 | 10544 | 887 | 887 | 6.83% | 8.41% | 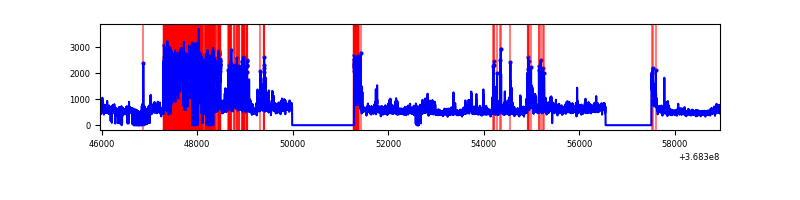 |
| D | 12986 | 10603 | 211 | 211 | 1.62% | 1.99% | 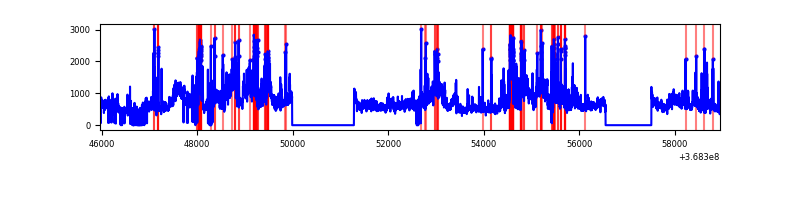 |
Top three noisy pixels from each quadrant. If the there are fewer than three noisy pixels in the level2.evt file, extra rows are filled as -1
| Pixel properties | Quadrant properties | ||||||
|---|---|---|---|---|---|---|---|
| Quadrant | DetID | PixID | Counts | Sigma | Mean | Median | Sigma |
| A | 13 | 254 | 20501 | 72.11 | 1348 | 1322 | 266.0 |
| A | 3 | 137 | 12613 | 42.45 | 1348 | 1322 | 266.0 |
| A | 0 | 226 | 11766 | 39.27 | 1348 | 1322 | 266.0 |
| B | 10 | 245 | 11401807 | 55617.97 | 1095 | 1068 | 205.0 |
| B | 6 | 159 | 2313286 | 11280.05 | 1095 | 1068 | 205.0 |
| B | 0 | 190 | 250623 | 1217.44 | 1095 | 1068 | 205.0 |
| C | 3 | 233 | 2876173 | 10558.93 | 1194 | 1203 | 272.3 |
| C | 0 | 10 | 513266 | 1880.66 | 1194 | 1203 | 272.3 |
| C | 14 | 238 | 196797 | 718.36 | 1194 | 1203 | 272.3 |
| D | 8 | 195 | 1848676 | 6153.83 | 1283 | 1251 | 300.2 |
| D | 12 | 227 | 1239754 | 4125.49 | 1283 | 1251 | 300.2 |
| D | 12 | 233 | 329326 | 1092.83 | 1283 | 1251 | 300.2 |
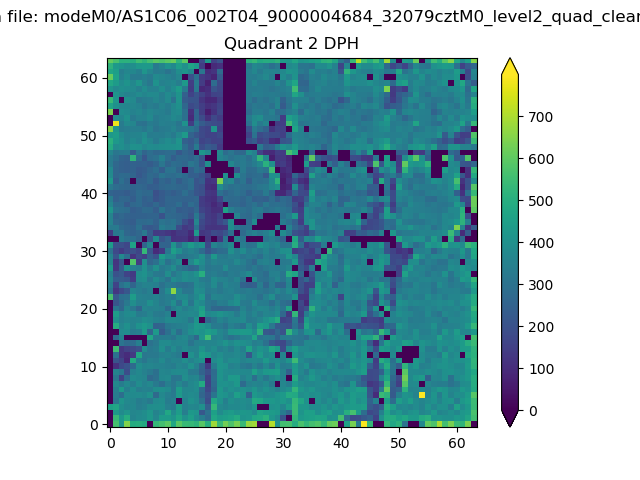
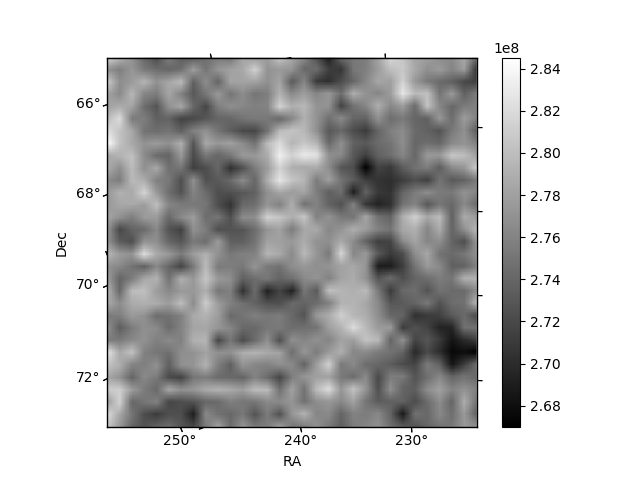
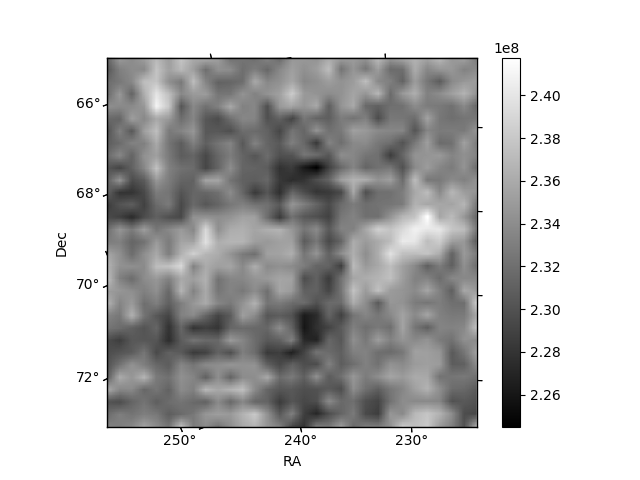
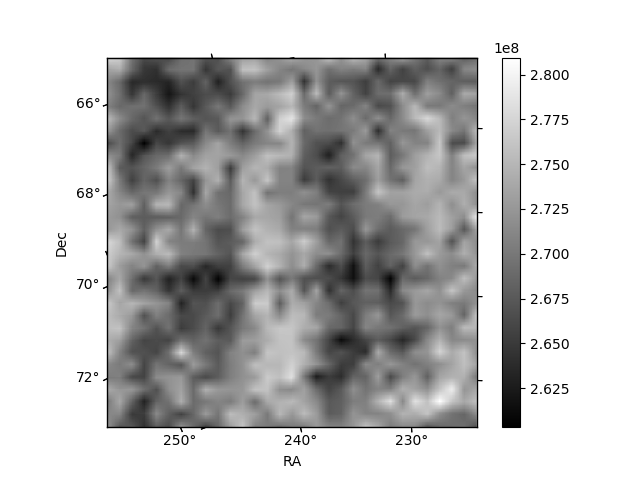
Histogram calculated using DETX and DETY for each event in the final _common_clean file
| Quadrant A | 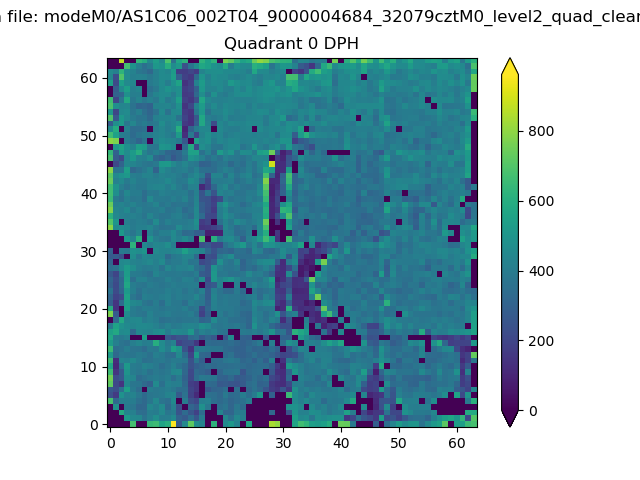 |
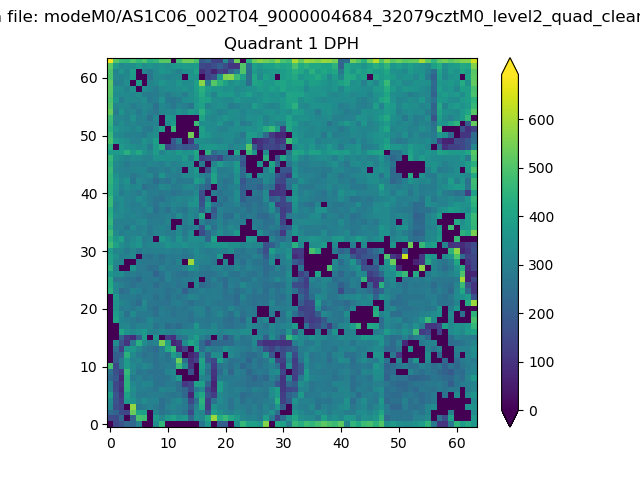 |
Quadrant B |
|---|---|---|---|
| Quadrant D | 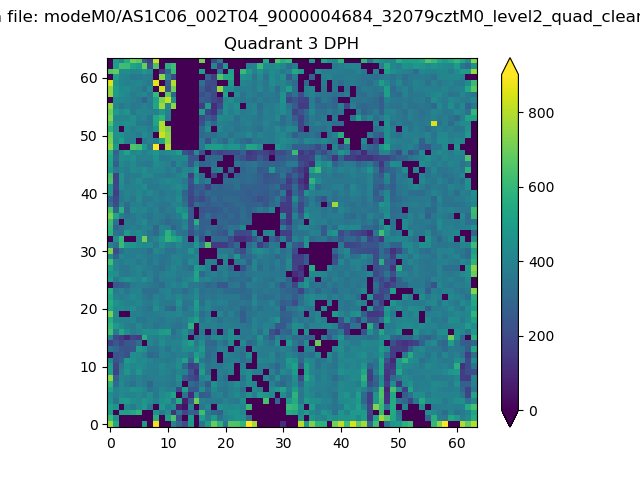 |
 |
Quadrant C |
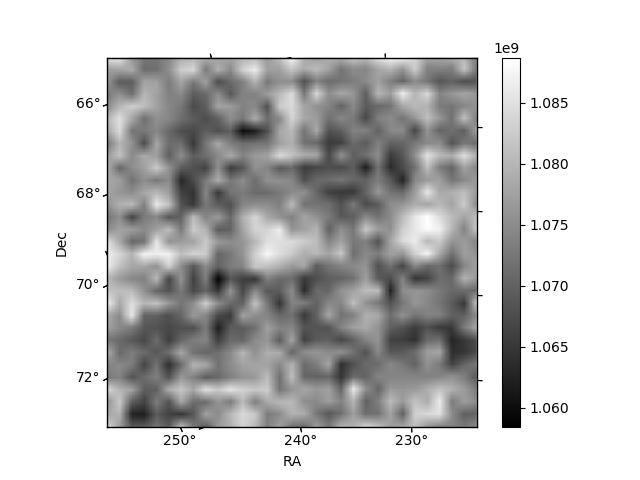
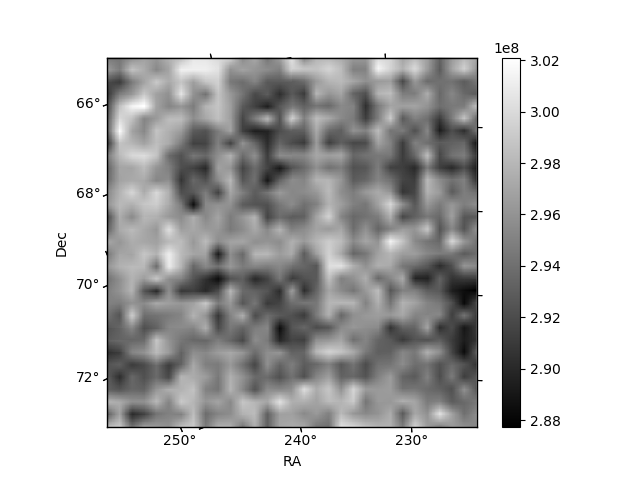
| Plot type | Count rate plots | Images |
|---|---|---|
| Comparison with Poisson distribution Blue bars denote a histogram of data divided into 1 sec bins. Red curve is a Poisson curve with rate = median count rate of data. |
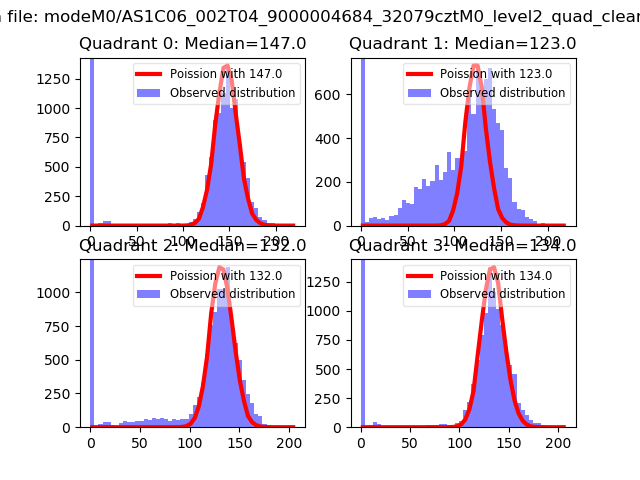 |
 |
| Quadrant-wise count rates Data is divided into 100 sec bins |
 |
|
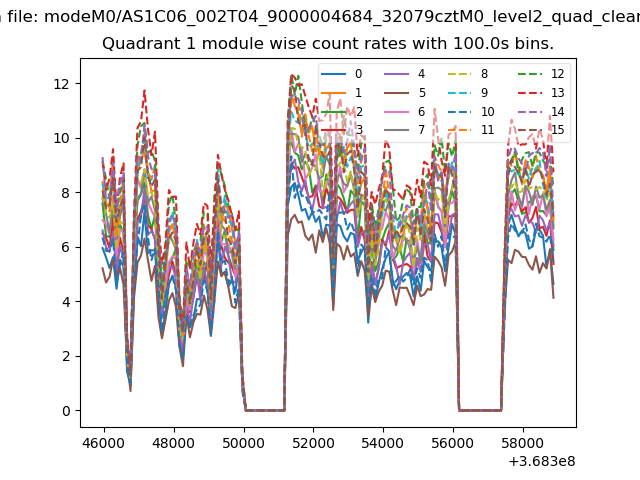
| Module-wise count rates for Quadrant A Data is divided into 100 sec bins |
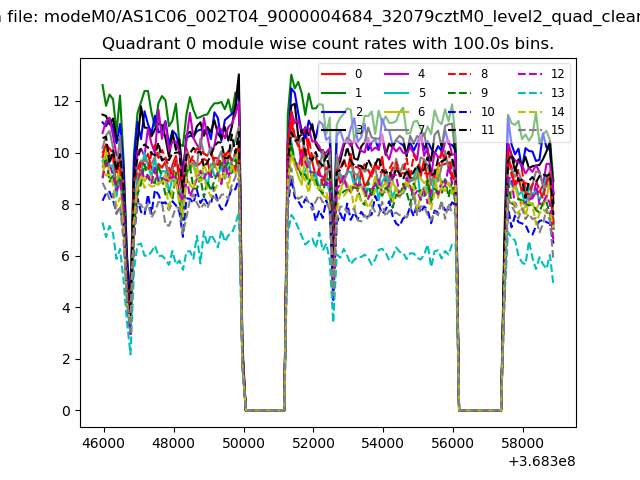 |
 |
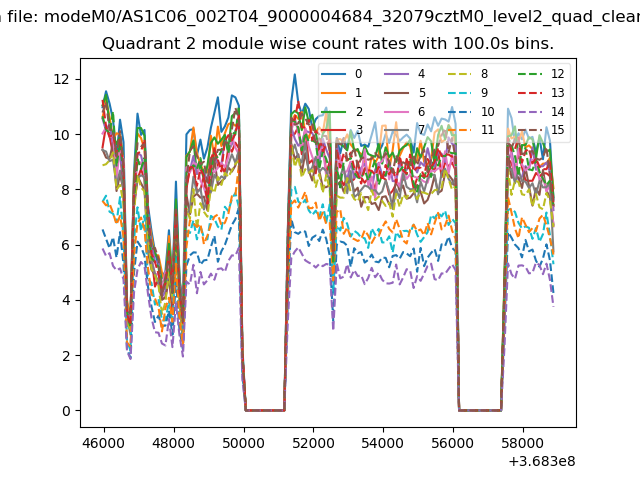
| Module-wise count rates for Quadrant B Data is divided into 100 sec bins |
 |
 |
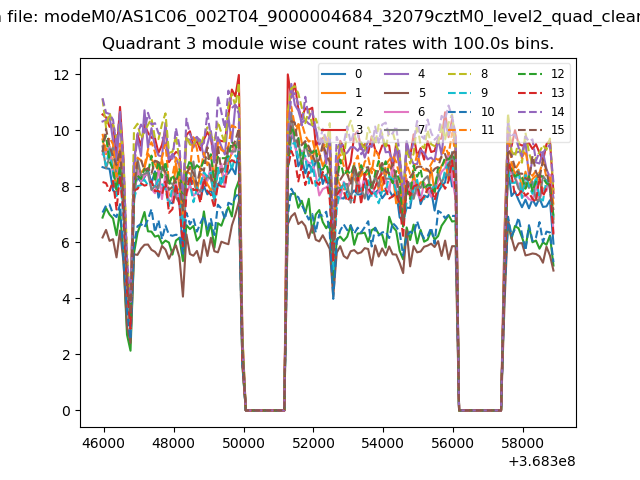
| Module-wise count rates for Quadrant C Data is divided into 100 sec bins |
 |
 |
| Module-wise count rates for Quadrant D Data is divided into 100 sec bins |
 |
 |
| Parameter | Plot |
|---|---|
| CZT HV Monitor |  |
| D_VDD | 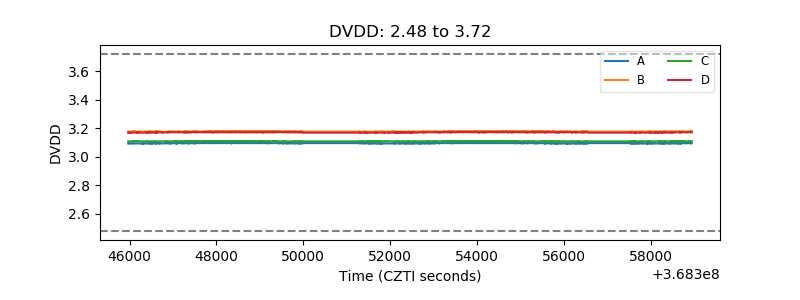 |
| Temperature 1 | 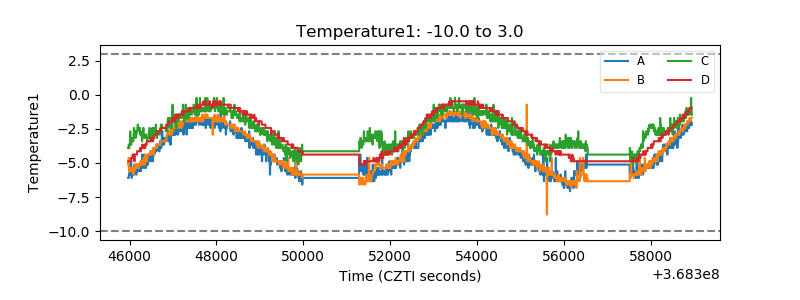 |
| Veto HV Monitor | 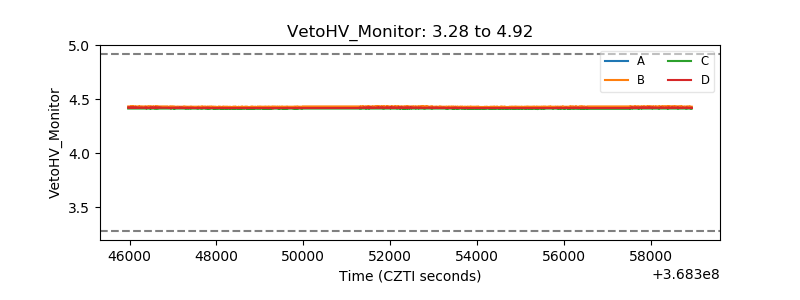 |
| Veto LLD | 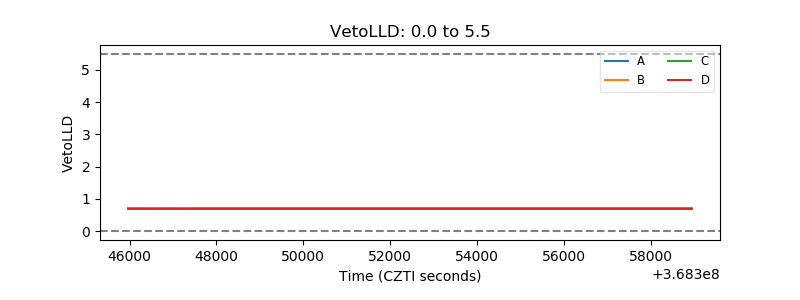 |
| Alpha Counter | 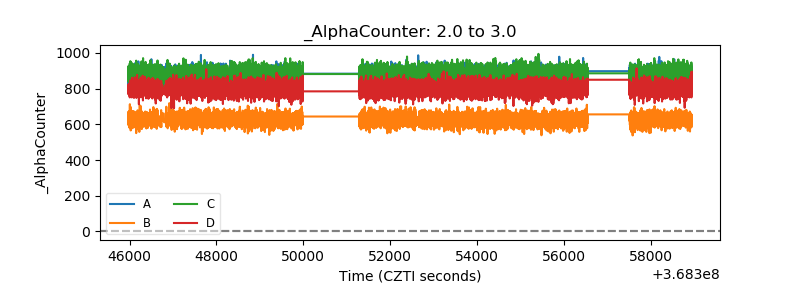 |
| _CPM_Rate | 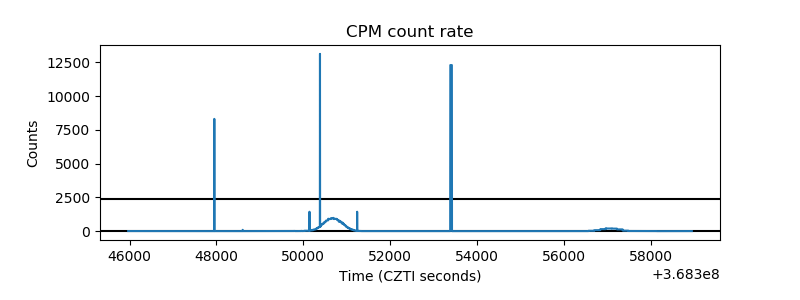 |
| CZT Counter | 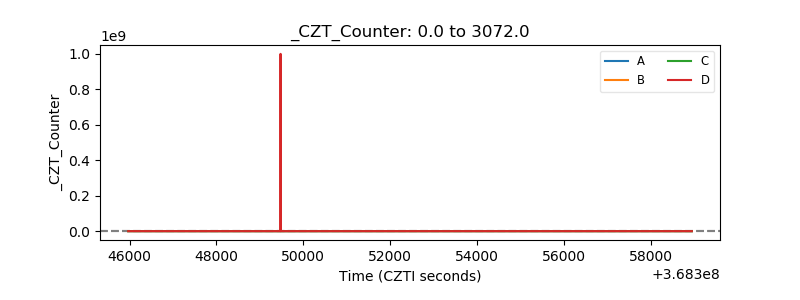 |
| +2.5 Volts monitor | 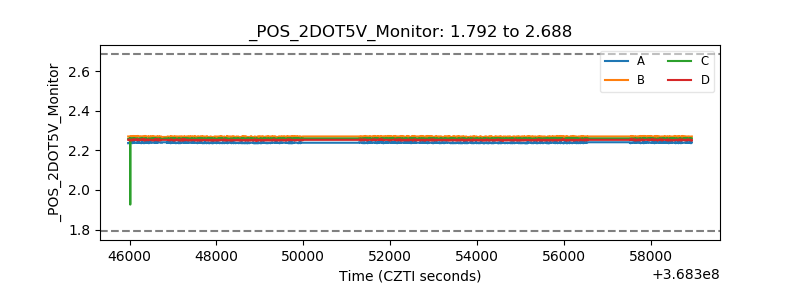 |
| +5 Volts monitor |  |
| _ROLL_ROT | 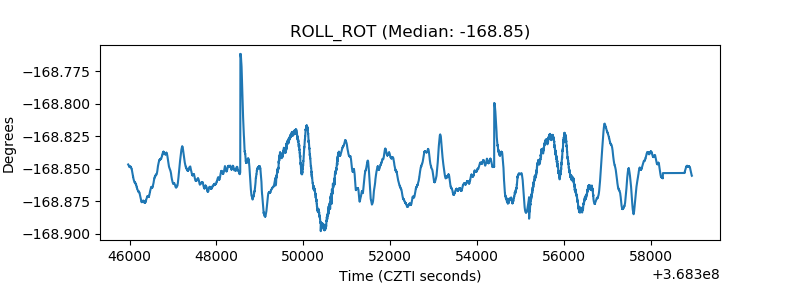 |
| _Roll_DEC | 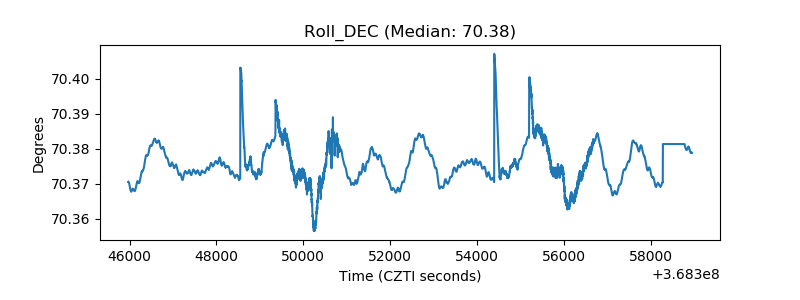 |
| _Roll_RA | 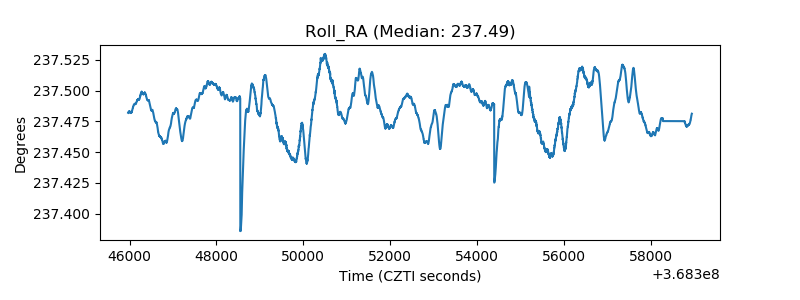 |
| Veto Counter | 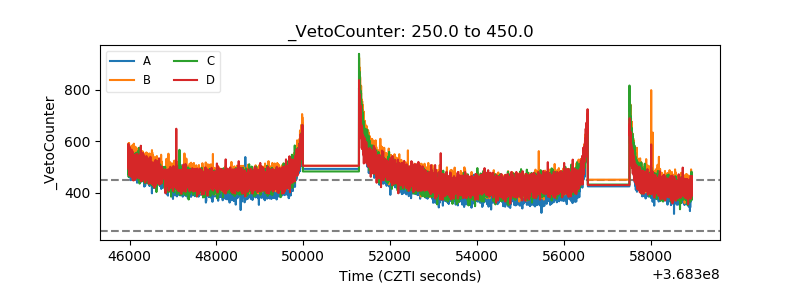 |