| Param | Original file | Final file |
|---|---|---|
| Filename | modeM0/AS1C06_002T04_9000004684_32081cztM0_level2.evt | modeM0/AS1C06_002T04_9000004684_32081cztM0_level2_quad_clean.evt |
| Size (bytes) | 839,269,440 | 130,533,120 |
| Size | 800.4 MB | 124.5 MB |
| Events in quadrant A | 3,690,797 | 924,093 |
| Events in quadrant B | 12,605,852 | 775,356 |
| Events in quadrant C | 3,899,881 | 861,473 |
| Events in quadrant D | 4,703,974 | 859,336 |
| Mode M0 | |||
|---|---|---|---|
| Quadrant | BADHDUFLAG | Total packets | Discarded packets |
| A | 0 | 15840 | 1 |
| B | 0 | 42799 | 1 |
| C | 0 | 16310 | 1 |
| D | 0 | 18627 | 1 |
| Mode SS | |||
|---|---|---|---|
| Quadrant | BADHDUFLAG | Total packets | Discarded packets |
| A | 0 | 152 | 0 |
| B | 0 | 152 | 0 |
| C | 0 | 152 | 0 |
| D | 0 | 152 | 0 |
| Quadrant | Total seconds | Saturated seconds | Saturation percentage |
|---|---|---|---|
| A | 7646 | 141 | 1.844101% |
| B | 7645 | 3409 | 44.591236% |
| C | 7645 | 342 | 4.473512% |
| D | 7645 | 255 | 3.335513% |
Noise dominated data is calculated using 1-second bins in cleaned event files. If a bin has >2000 counts, and if more than 50% of those come from <1% of pixels, then it is considered to be noise-dominated and hence unusable.
| Quadrant | # 1 sec bins | Bins with >0 counts | Bins with >2000 counts | High rate bins dominated by noise | Noise dominated (total time) | Noise dominated (detector-on time) | Marked lightcurve |
|---|---|---|---|---|---|---|---|
| A | 7671 | 7647 | 0 | 0 | 0.00% | 0.00% |  |
| B | 7670 | 7645 | 2262 | 2262 | 29.49% | 29.59% | 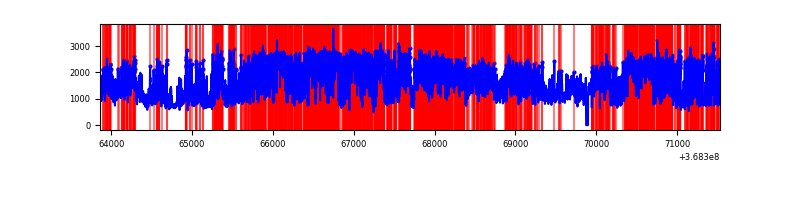 |
| C | 7670 | 7645 | 1 | 1 | 0.01% | 0.01% | 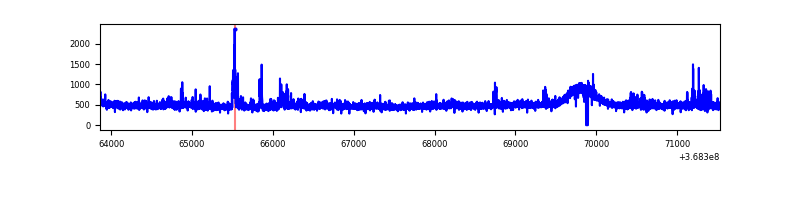 |
| D | 7670 | 7646 | 174 | 174 | 2.27% | 2.28% | 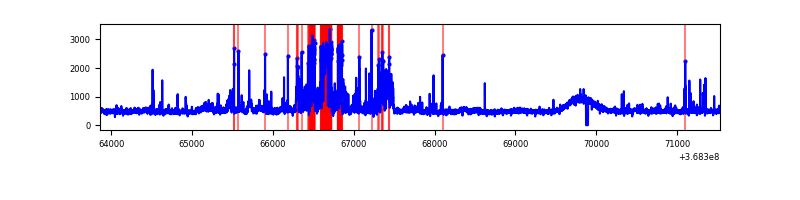 |
Top three noisy pixels from each quadrant. If the there are fewer than three noisy pixels in the level2.evt file, extra rows are filled as -1
| Pixel properties | Quadrant properties | ||||||
|---|---|---|---|---|---|---|---|
| Quadrant | DetID | PixID | Counts | Sigma | Mean | Median | Sigma |
| A | 13 | 254 | 14982 | 73.41 | 952 | 931 | 191.4 |
| A | 13 | 6 | 12074 | 58.22 | 952 | 931 | 191.4 |
| A | 3 | 137 | 9488 | 44.71 | 952 | 931 | 191.4 |
| B | 10 | 245 | 7287882 | 46352.35 | 822 | 798 | 157.2 |
| B | 6 | 159 | 1843852 | 11723.47 | 822 | 798 | 157.2 |
| B | 0 | 190 | 126893 | 802.08 | 822 | 798 | 157.2 |
| C | 14 | 238 | 179148 | 852.44 | 890 | 894 | 209.1 |
| C | 3 | 233 | 108610 | 515.12 | 890 | 894 | 209.1 |
| C | 14 | 254 | 52622 | 247.37 | 890 | 894 | 209.1 |
| D | 12 | 233 | 597375 | 2735.34 | 913 | 886 | 218.1 |
| D | 8 | 195 | 269332 | 1231.02 | 913 | 886 | 218.1 |
| D | 12 | 227 | 264751 | 1210.02 | 913 | 886 | 218.1 |
Histogram calculated using DETX and DETY for each event in the final _common_clean file
| Quadrant A | 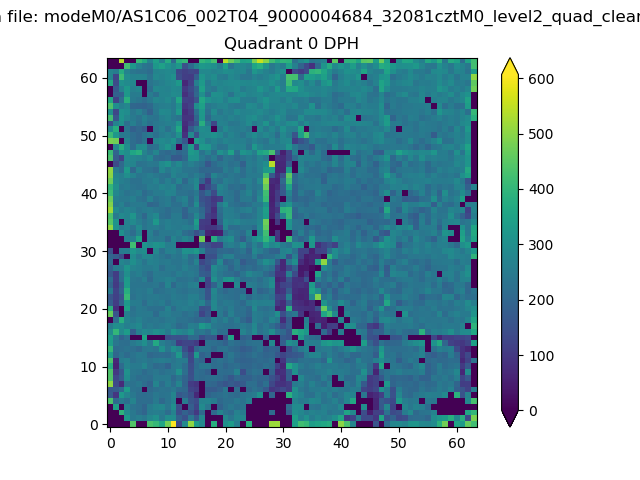 |
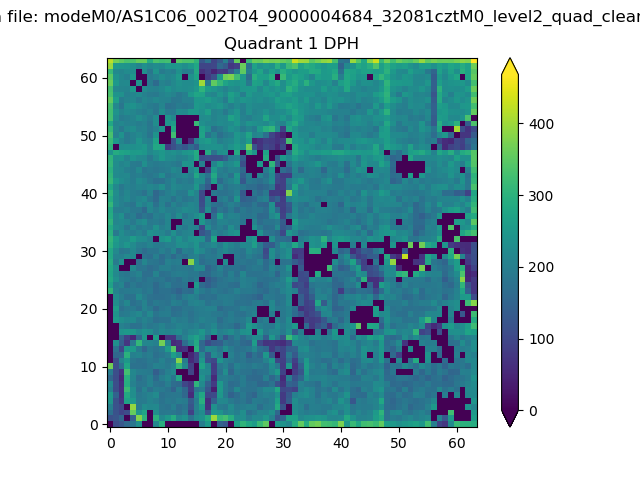 |
Quadrant B |
|---|---|---|---|
| Quadrant D | 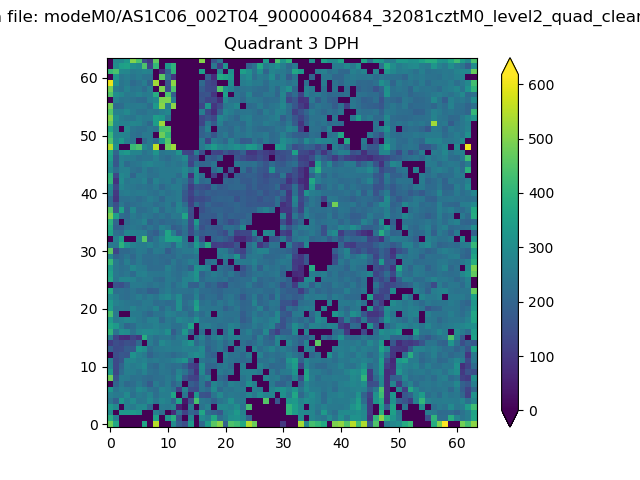 |
 |
Quadrant C |
| Plot type | Count rate plots | Images |
|---|---|---|
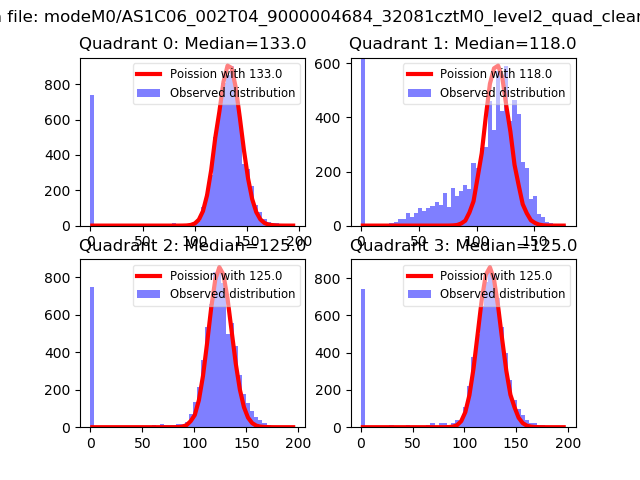
| Comparison with Poisson distribution Blue bars denote a histogram of data divided into 1 sec bins. Red curve is a Poisson curve with rate = median count rate of data. |
 |
 |
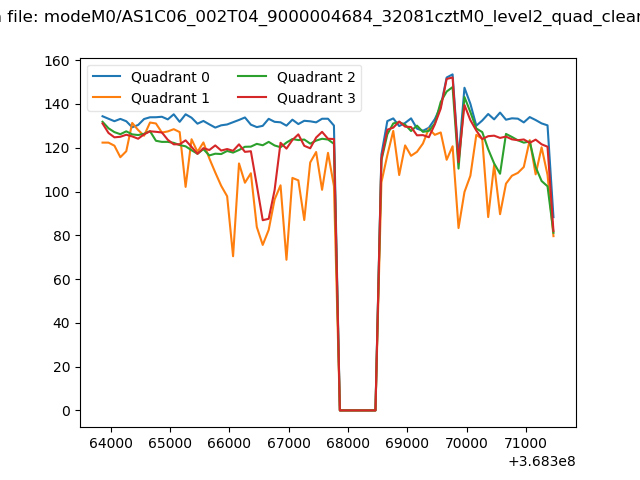
| Quadrant-wise count rates Data is divided into 100 sec bins |
 |
|
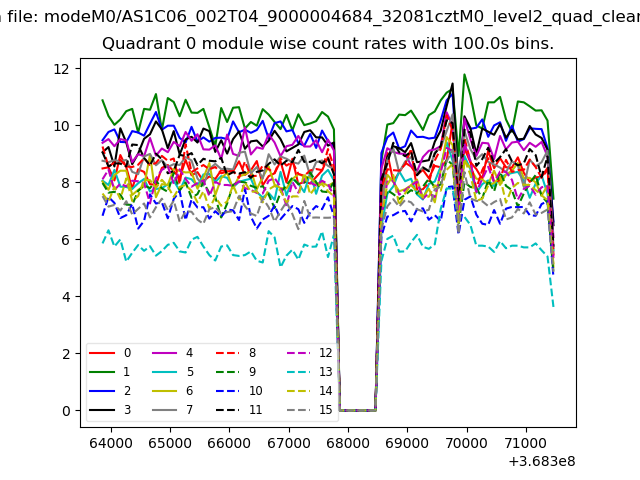
| Module-wise count rates for Quadrant A Data is divided into 100 sec bins |
 |
 |
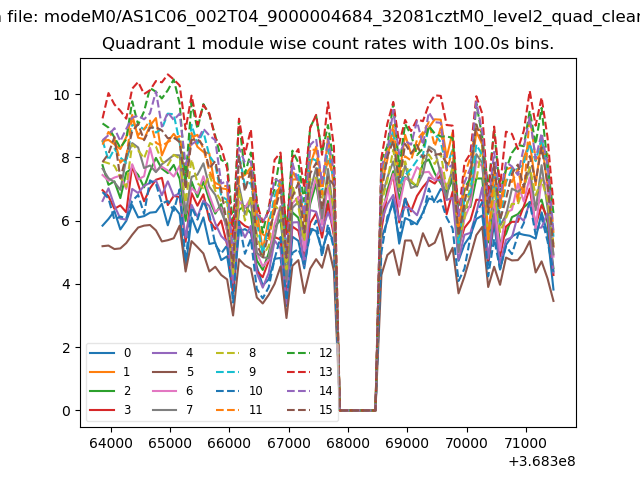
| Module-wise count rates for Quadrant B Data is divided into 100 sec bins |
 |
 |
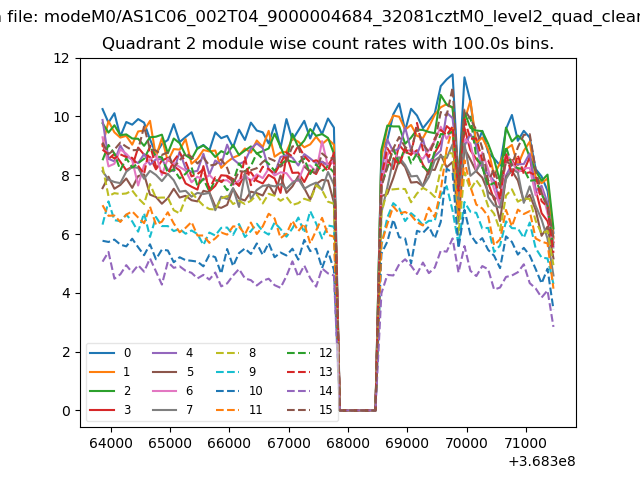
| Module-wise count rates for Quadrant C Data is divided into 100 sec bins |
 |
 |
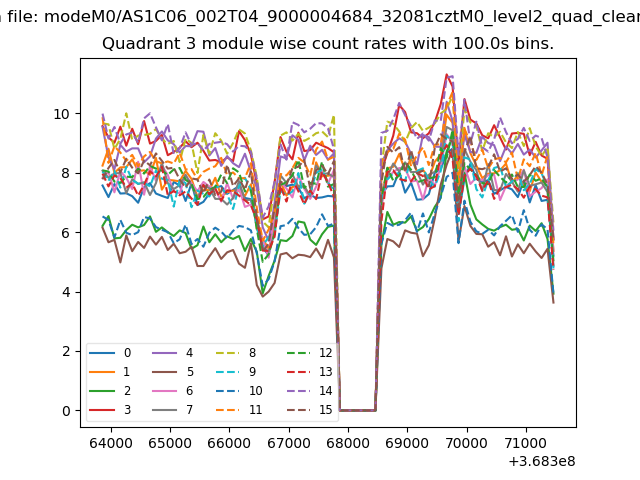
| Module-wise count rates for Quadrant D Data is divided into 100 sec bins |
 |
 |
| Parameter | Plot |
|---|---|
| CZT HV Monitor | 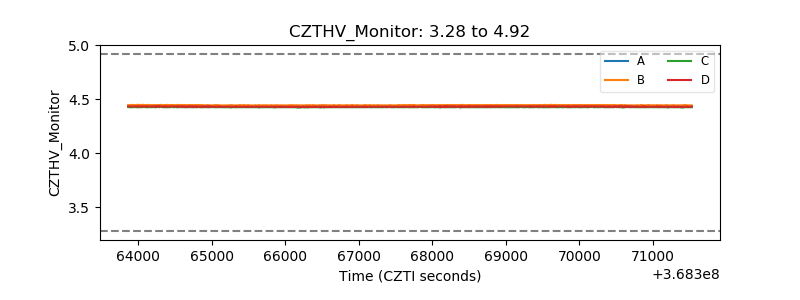 |
| D_VDD | 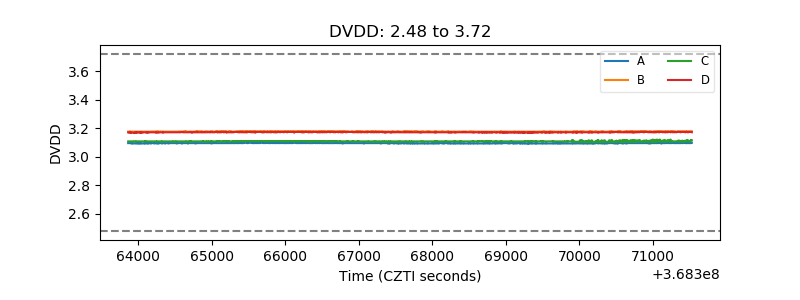 |
| Temperature 1 | 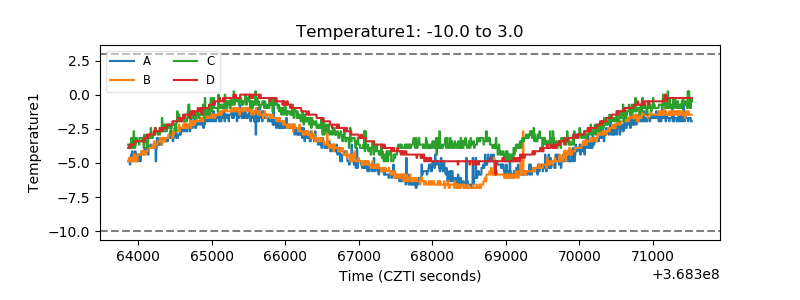 |
| Veto HV Monitor | 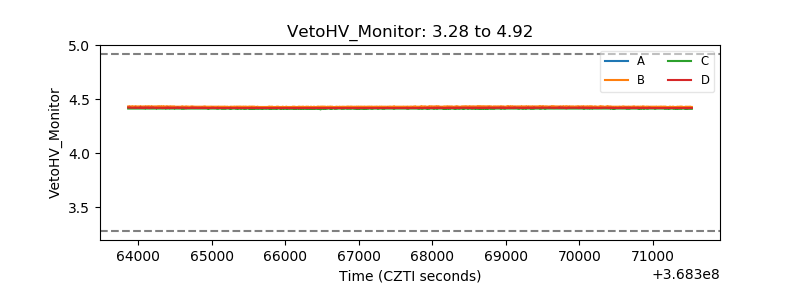 |
| Veto LLD |  |
| Alpha Counter | 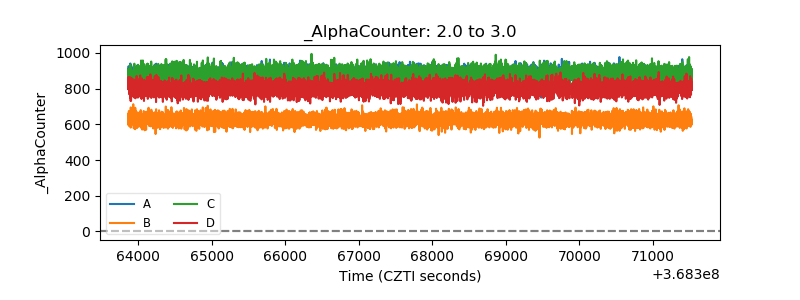 |
| _CPM_Rate | 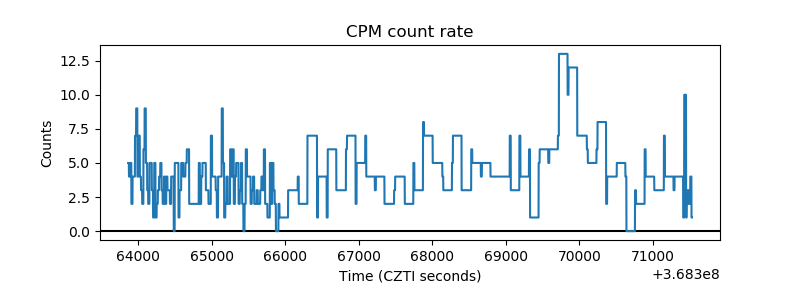 |
| CZT Counter | 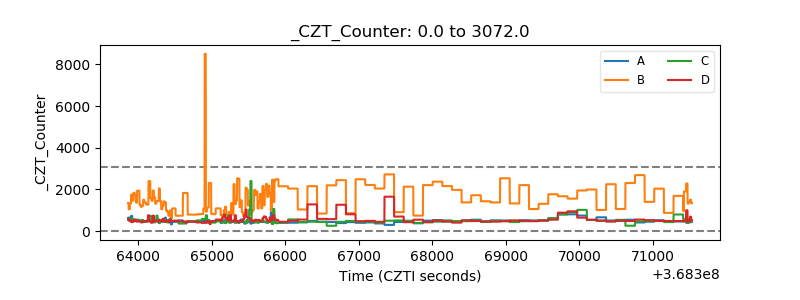 |
| +2.5 Volts monitor |  |
| +5 Volts monitor |  |
| _ROLL_ROT | 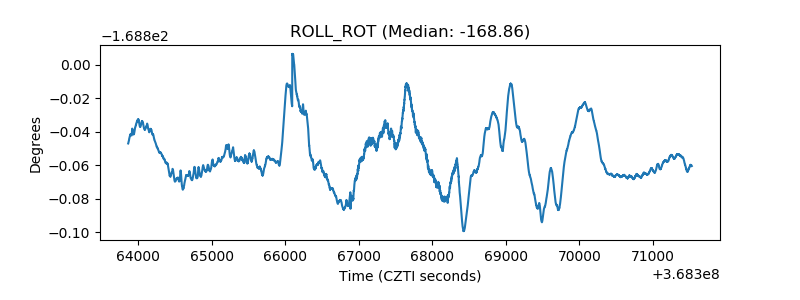 |
| _Roll_DEC | 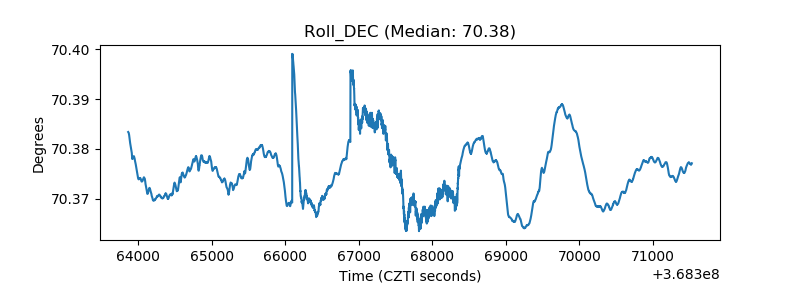 |
| _Roll_RA | 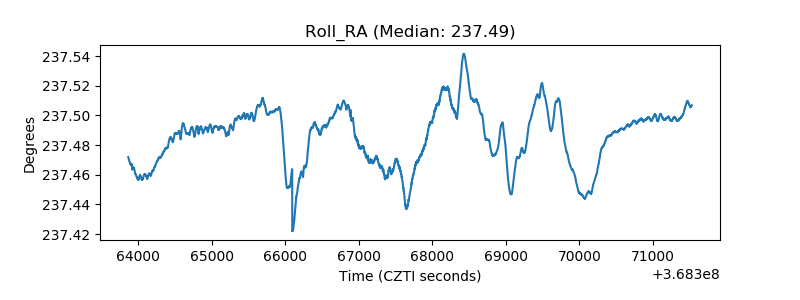 |
| Veto Counter | 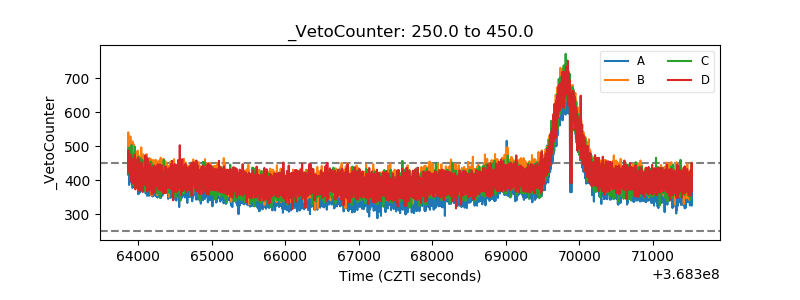 |