| Param | Original file | Final file |
|---|---|---|
| Filename | modeM0/AS1C06_002T04_9000004684_32082cztM0_level2.evt | modeM0/AS1C06_002T04_9000004684_32082cztM0_level2_quad_clean.evt |
| Size (bytes) | 853,594,560 | 130,294,080 |
| Size | 814.1 MB | 124.3 MB |
| Events in quadrant A | 3,687,446 | 929,394 |
| Events in quadrant B | 13,183,976 | 746,644 |
| Events in quadrant C | 4,129,831 | 860,099 |
| Events in quadrant D | 4,327,675 | 871,123 |
| Mode M9 | |||
|---|---|---|---|
| Quadrant | BADHDUFLAG | Total packets | Discarded packets |
| A | 0 | 2 | 0 |
| B | 0 | 2 | 0 |
| C | 0 | 2 | 0 |
| D | 0 | 2 | 0 |
| Mode M0 | |||
|---|---|---|---|
| Quadrant | BADHDUFLAG | Total packets | Discarded packets |
| A | 0 | 15917 | 1 |
| B | 0 | 44526 | 2 |
| C | 0 | 17002 | 1 |
| D | 0 | 17640 | 1 |
| Mode SS | |||
|---|---|---|---|
| Quadrant | BADHDUFLAG | Total packets | Discarded packets |
| A | 0 | 156 | 0 |
| B | 0 | 156 | 0 |
| C | 0 | 156 | 0 |
| D | 0 | 156 | 0 |
| Quadrant | Total seconds | Saturated seconds | Saturation percentage |
|---|---|---|---|
| A | 7732 | 111 | 1.435592% |
| B | 7731 | 3870 | 50.058207% |
| C | 7732 | 357 | 4.617175% |
| D | 7732 | 143 | 1.849457% |
Noise dominated data is calculated using 1-second bins in cleaned event files. If a bin has >2000 counts, and if more than 50% of those come from <1% of pixels, then it is considered to be noise-dominated and hence unusable.
| Quadrant | # 1 sec bins | Bins with >0 counts | Bins with >2000 counts | High rate bins dominated by noise | Noise dominated (total time) | Noise dominated (detector-on time) | Marked lightcurve |
|---|---|---|---|---|---|---|---|
| A | 7847 | 7733 | 0 | 0 | 0.00% | 0.00% | 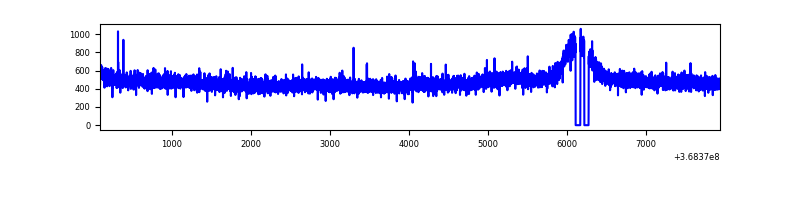 |
| B | 7846 | 7731 | 2782 | 2782 | 35.46% | 35.98% | 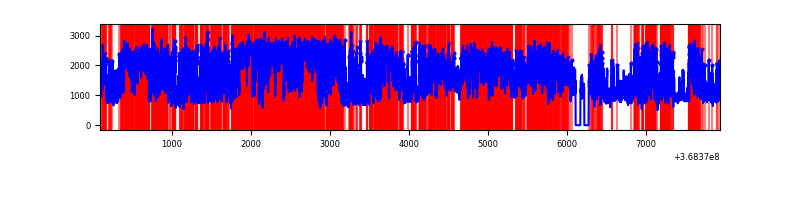 |
| C | 7847 | 7733 | 3 | 3 | 0.04% | 0.04% | 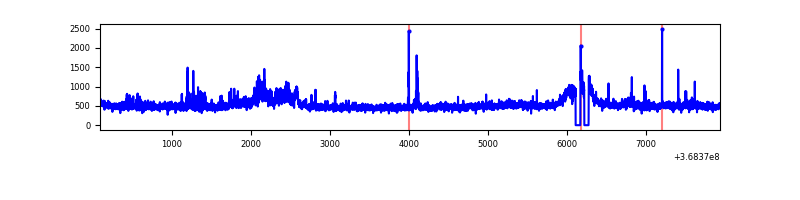 |
| D | 7847 | 7734 | 48 | 48 | 0.61% | 0.62% | 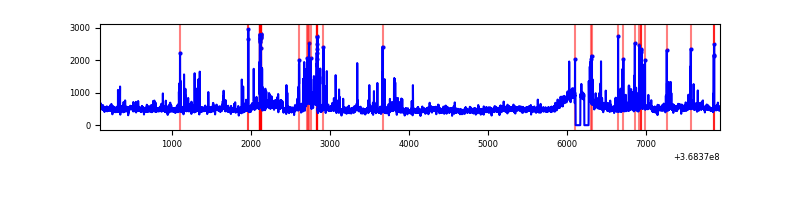 |
Top three noisy pixels from each quadrant. If the there are fewer than three noisy pixels in the level2.evt file, extra rows are filled as -1
| Pixel properties | Quadrant properties | ||||||
|---|---|---|---|---|---|---|---|
| Quadrant | DetID | PixID | Counts | Sigma | Mean | Median | Sigma |
| A | 13 | 254 | 16498 | 81.34 | 951 | 930 | 191.4 |
| A | 13 | 6 | 14441 | 70.59 | 951 | 930 | 191.4 |
| A | 3 | 137 | 9646 | 45.54 | 951 | 930 | 191.4 |
| B | 10 | 245 | 7955864 | 51737.09 | 800 | 779 | 153.8 |
| B | 6 | 159 | 1838101 | 11949.3 | 800 | 779 | 153.8 |
| B | 0 | 190 | 91976 | 593.11 | 800 | 779 | 153.8 |
| C | 3 | 233 | 277290 | 1334.99 | 889 | 893 | 207.0 |
| C | 14 | 238 | 180520 | 867.59 | 889 | 893 | 207.0 |
| C | 0 | 10 | 68981 | 328.86 | 889 | 893 | 207.0 |
| D | 8 | 195 | 300915 | 1371.35 | 921 | 892 | 218.8 |
| D | 12 | 233 | 225485 | 1026.57 | 921 | 892 | 218.8 |
| D | 12 | 218 | 174887 | 795.3 | 921 | 892 | 218.8 |
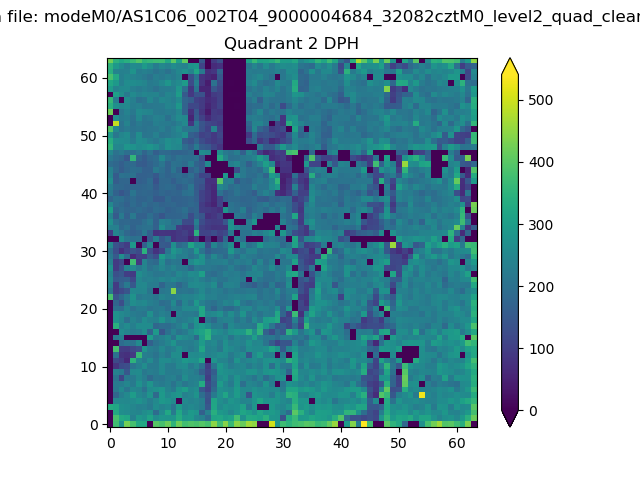
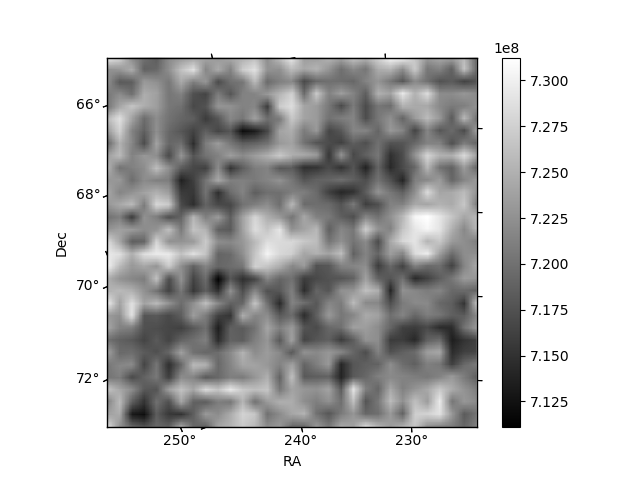
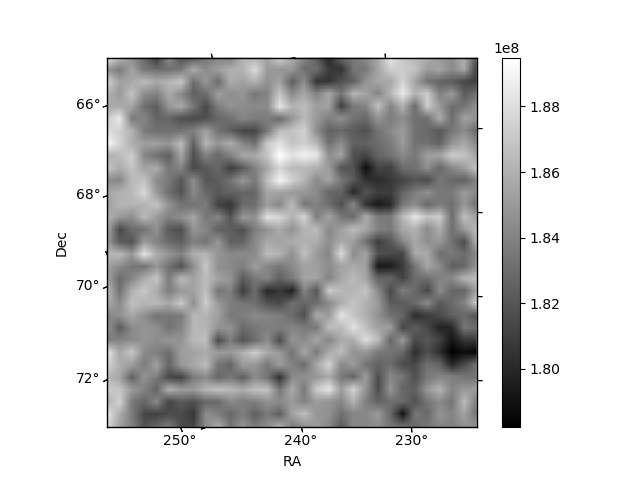
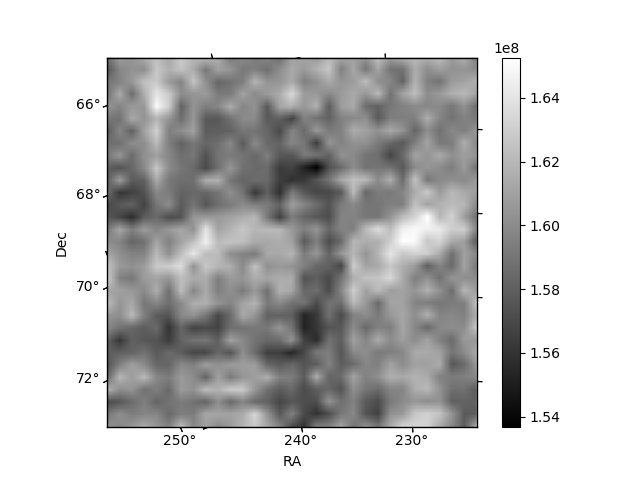
Histogram calculated using DETX and DETY for each event in the final _common_clean file
| Quadrant A | 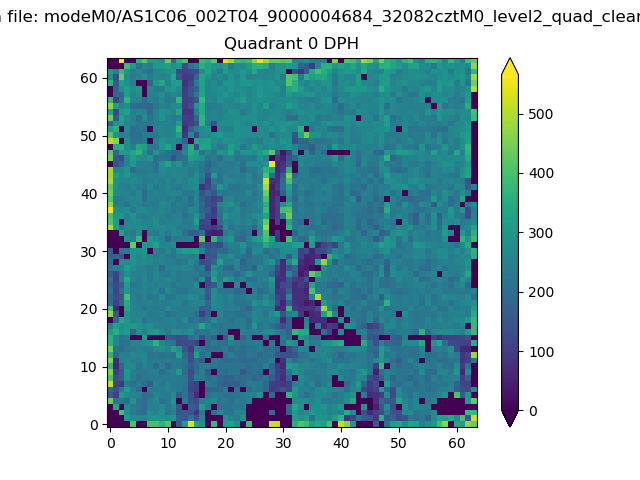 |
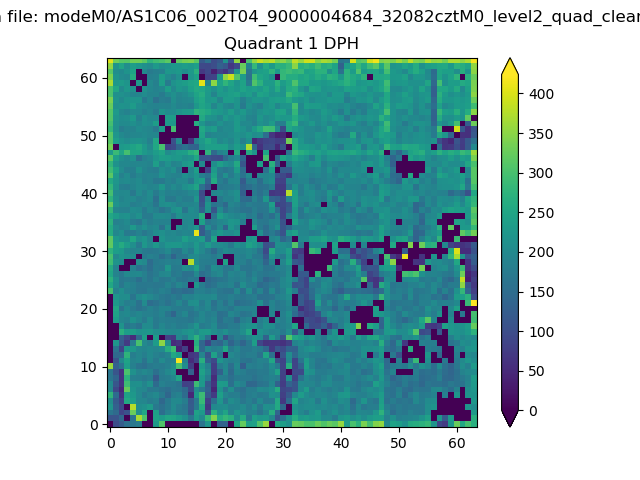 |
Quadrant B |
|---|---|---|---|
| Quadrant D | 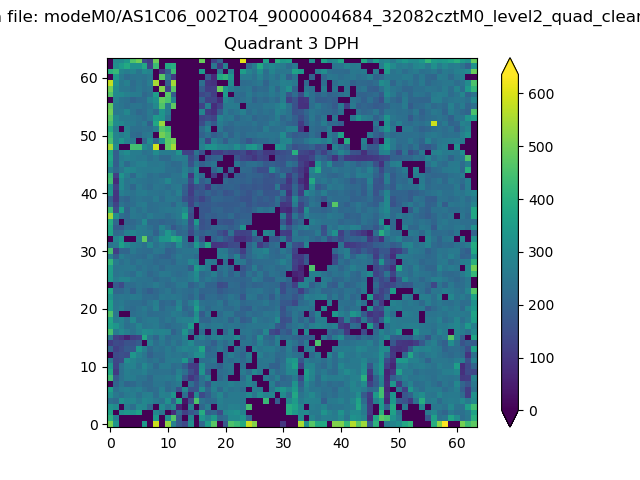 |
 |
Quadrant C |
| Plot type | Count rate plots | Images |
|---|---|---|
| Comparison with Poisson distribution Blue bars denote a histogram of data divided into 1 sec bins. Red curve is a Poisson curve with rate = median count rate of data. |
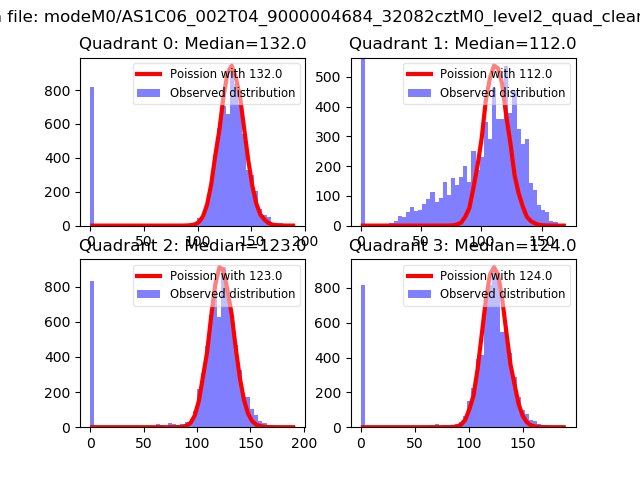 |
 |
| Quadrant-wise count rates Data is divided into 100 sec bins |
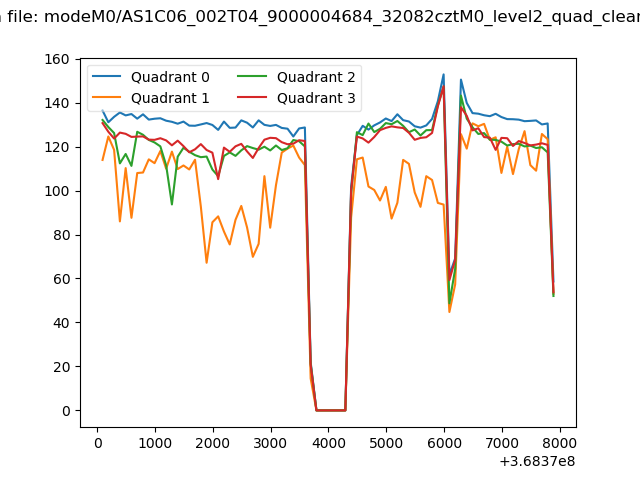 |
|
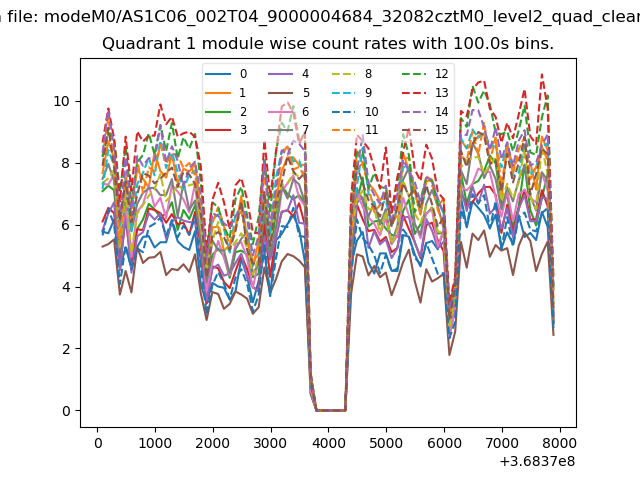
| Module-wise count rates for Quadrant A Data is divided into 100 sec bins |
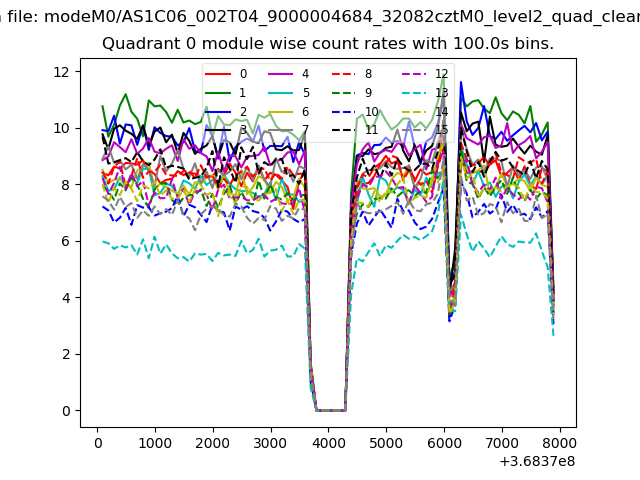 |
 |
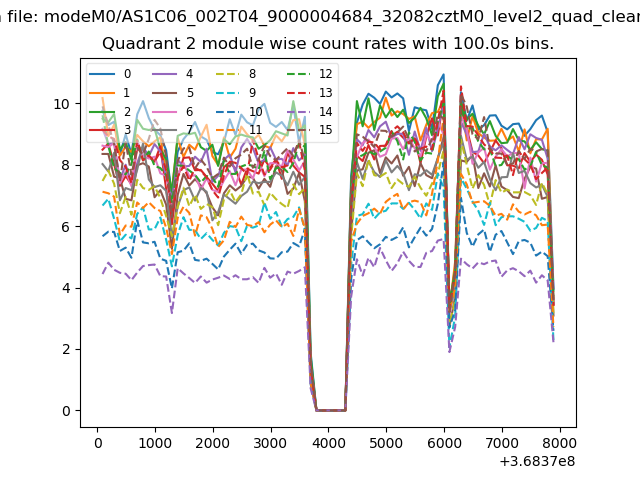
| Module-wise count rates for Quadrant B Data is divided into 100 sec bins |
 |
 |
| Module-wise count rates for Quadrant C Data is divided into 100 sec bins |
 |
 |
| Module-wise count rates for Quadrant D Data is divided into 100 sec bins |
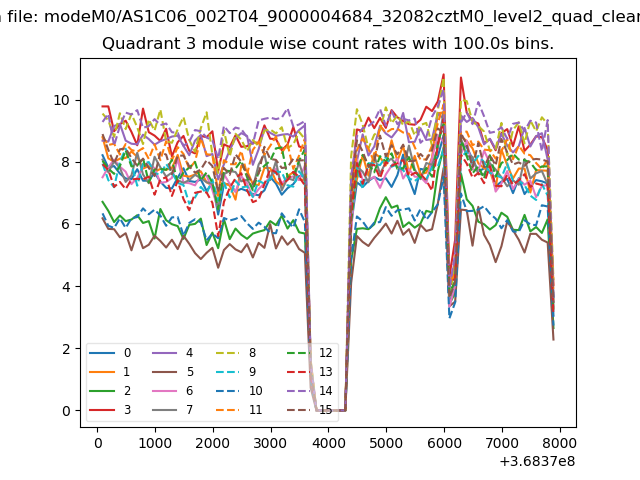 |
 |
| Parameter | Plot |
|---|---|
| CZT HV Monitor | 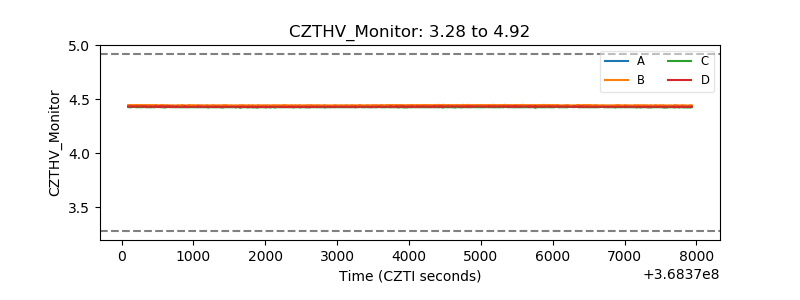 |
| D_VDD | 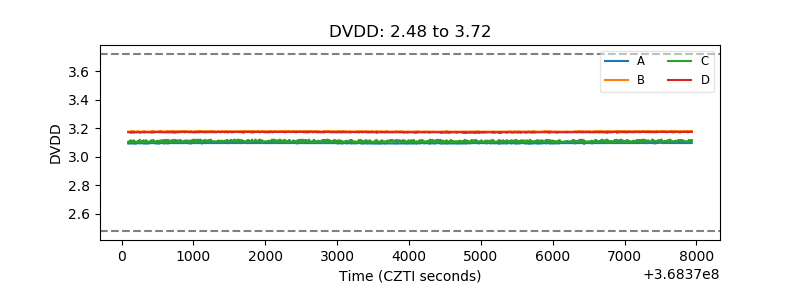 |
| Temperature 1 | 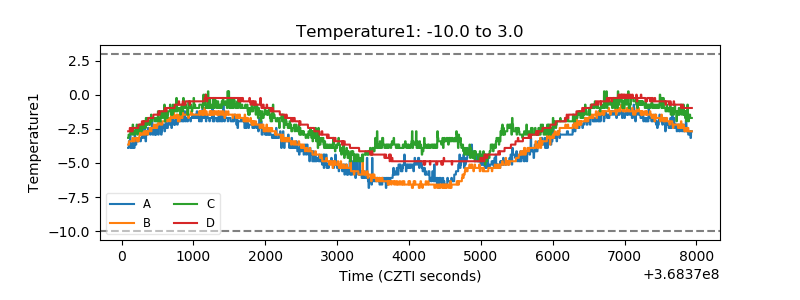 |
| Veto HV Monitor | 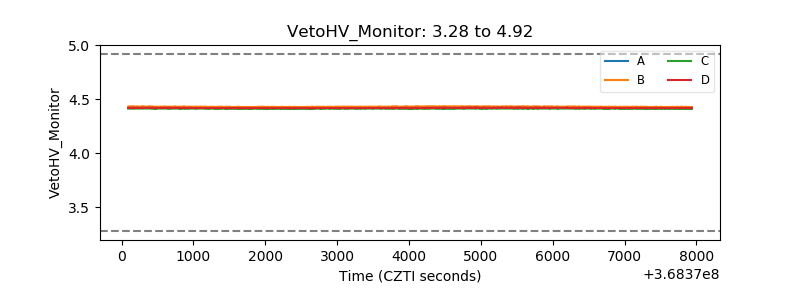 |
| Veto LLD | 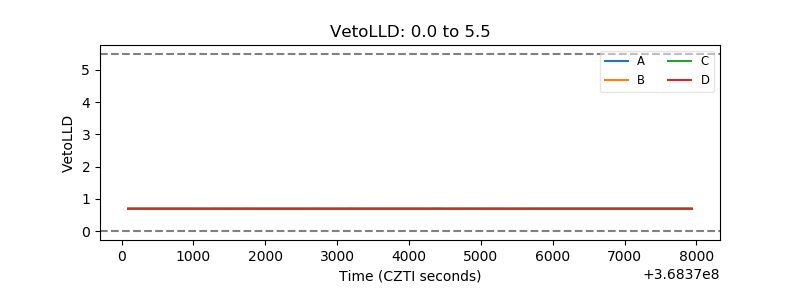 |
| Alpha Counter | 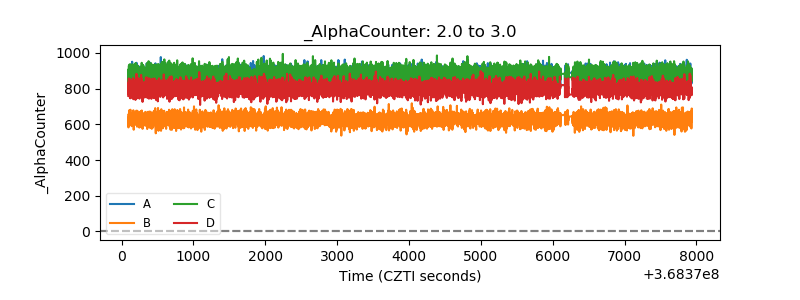 |
| _CPM_Rate | 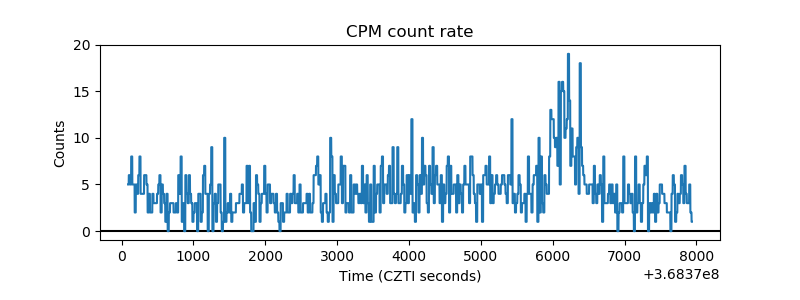 |
| CZT Counter | 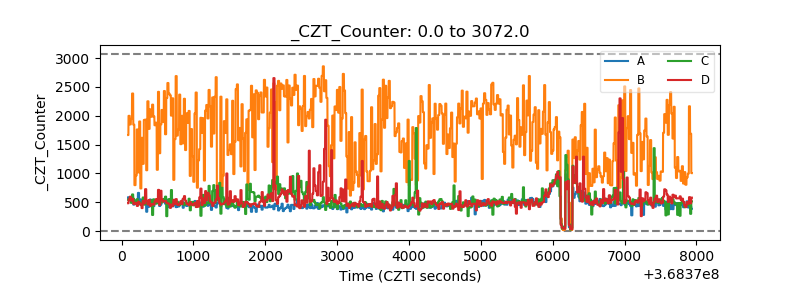 |
| +2.5 Volts monitor |  |
| +5 Volts monitor |  |
| _ROLL_ROT | 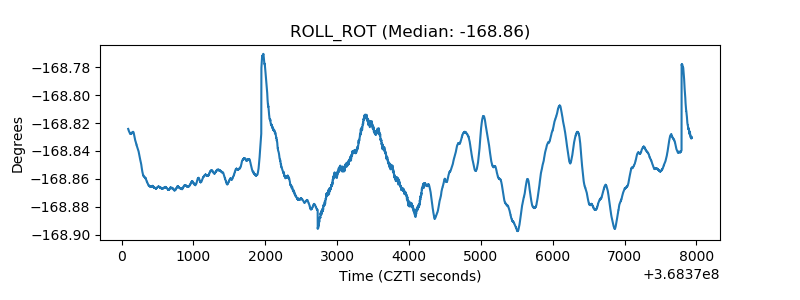 |
| _Roll_DEC | 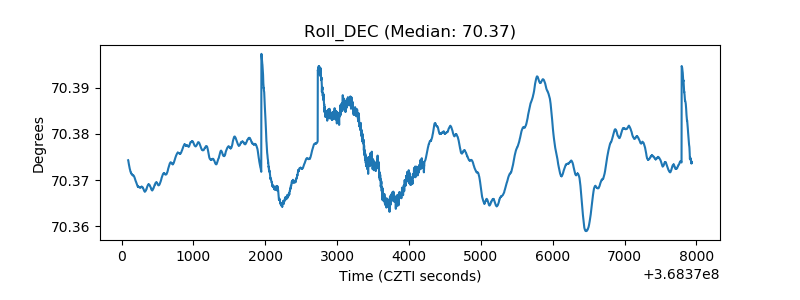 |
| _Roll_RA | 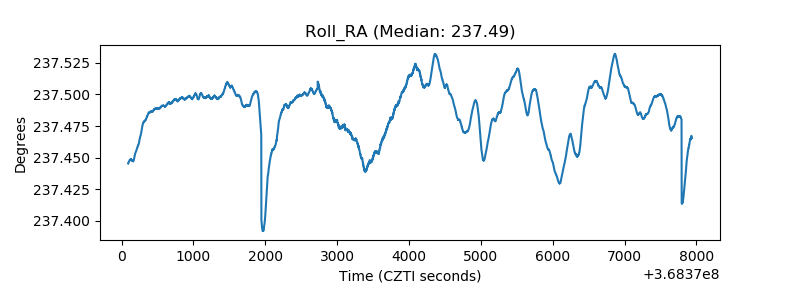 |
| Veto Counter |  |