| Param | Original file | Final file |
|---|---|---|
| Filename | modeM0/AS1C06_002T04_9000004684_32083cztM0_level2.evt | modeM0/AS1C06_002T04_9000004684_32083cztM0_level2_quad_clean.evt |
| Size (bytes) | 794,612,160 | 127,376,640 |
| Size | 757.8 MB | 121.5 MB |
| Events in quadrant A | 3,535,598 | 897,012 |
| Events in quadrant B | 10,900,143 | 767,082 |
| Events in quadrant C | 3,932,710 | 836,849 |
| Events in quadrant D | 5,189,091 | 833,113 |
| Mode M9 | |||
|---|---|---|---|
| Quadrant | BADHDUFLAG | Total packets | Discarded packets |
| A | 0 | 4 | 0 |
| B | 0 | 4 | 0 |
| C | 0 | 4 | 0 |
| D | 0 | 4 | 0 |
| Mode M0 | |||
|---|---|---|---|
| Quadrant | BADHDUFLAG | Total packets | Discarded packets |
| A | 0 | 15382 | 2 |
| B | 0 | 37637 | 2 |
| C | 0 | 16287 | 2 |
| D | 0 | 20265 | 2 |
| Mode SS | |||
|---|---|---|---|
| Quadrant | BADHDUFLAG | Total packets | Discarded packets |
| A | 0 | 152 | 0 |
| B | 0 | 152 | 0 |
| C | 0 | 152 | 0 |
| D | 0 | 152 | 0 |
| Quadrant | Total seconds | Saturated seconds | Saturation percentage |
|---|---|---|---|
| A | 7514 | 41 | 0.545648% |
| B | 7515 | 2250 | 29.940120% |
| C | 7514 | 154 | 2.049508% |
| D | 7514 | 168 | 2.235826% |
Noise dominated data is calculated using 1-second bins in cleaned event files. If a bin has >2000 counts, and if more than 50% of those come from <1% of pixels, then it is considered to be noise-dominated and hence unusable.
| Quadrant | # 1 sec bins | Bins with >0 counts | Bins with >2000 counts | High rate bins dominated by noise | Noise dominated (total time) | Noise dominated (detector-on time) | Marked lightcurve |
|---|---|---|---|---|---|---|---|
| A | 7919 | 7514 | 0 | 0 | 0.00% | 0.00% |  |
| B | 7919 | 7514 | 1607 | 1607 | 20.29% | 21.39% | 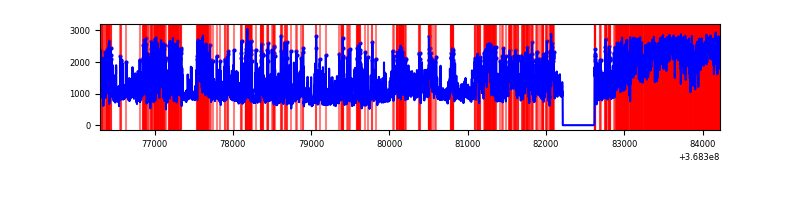 |
| C | 7919 | 7514 | 21 | 21 | 0.27% | 0.28% | 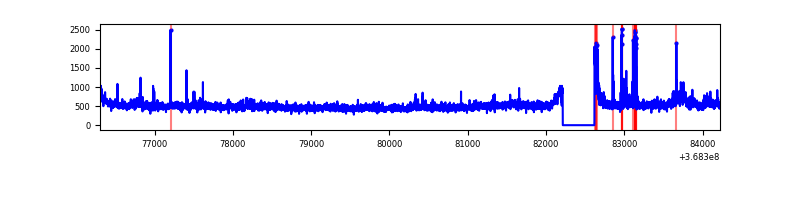 |
| D | 7919 | 7514 | 117 | 117 | 1.48% | 1.56% | 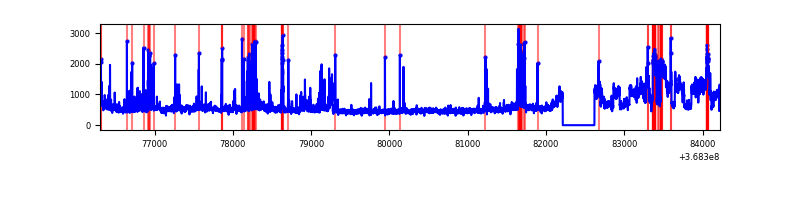 |
Top three noisy pixels from each quadrant. If the there are fewer than three noisy pixels in the level2.evt file, extra rows are filled as -1
| Pixel properties | Quadrant properties | ||||||
|---|---|---|---|---|---|---|---|
| Quadrant | DetID | PixID | Counts | Sigma | Mean | Median | Sigma |
| A | 13 | 254 | 16466 | 85.19 | 912 | 893 | 182.8 |
| A | 13 | 6 | 12823 | 65.26 | 912 | 893 | 182.8 |
| A | 3 | 137 | 9252 | 45.73 | 912 | 893 | 182.8 |
| B | 10 | 245 | 5533744 | 35171.14 | 811 | 788 | 157.3 |
| B | 6 | 159 | 1952849 | 12408.59 | 811 | 788 | 157.3 |
| B | 5 | 172 | 62294 | 390.97 | 811 | 788 | 157.3 |
| C | 3 | 233 | 186170 | 911.65 | 863 | 868 | 203.3 |
| C | 0 | 10 | 170662 | 835.35 | 863 | 868 | 203.3 |
| C | 14 | 238 | 138974 | 679.45 | 863 | 868 | 203.3 |
| D | 8 | 195 | 1287349 | 6120.1 | 881 | 856 | 210.2 |
| D | 12 | 218 | 249331 | 1182.05 | 881 | 856 | 210.2 |
| D | 2 | 120 | 88998 | 419.31 | 881 | 856 | 210.2 |
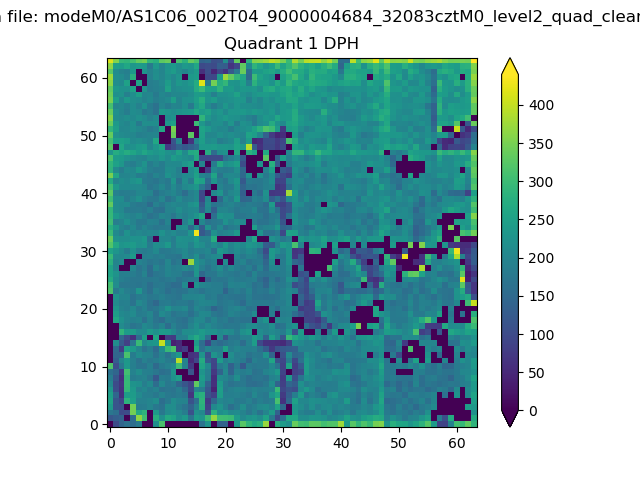
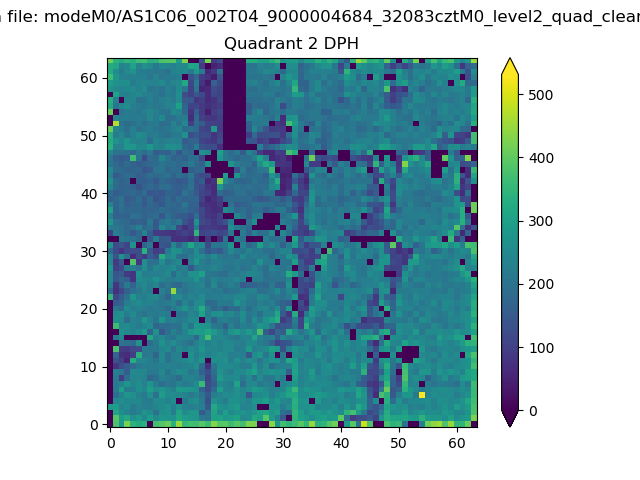
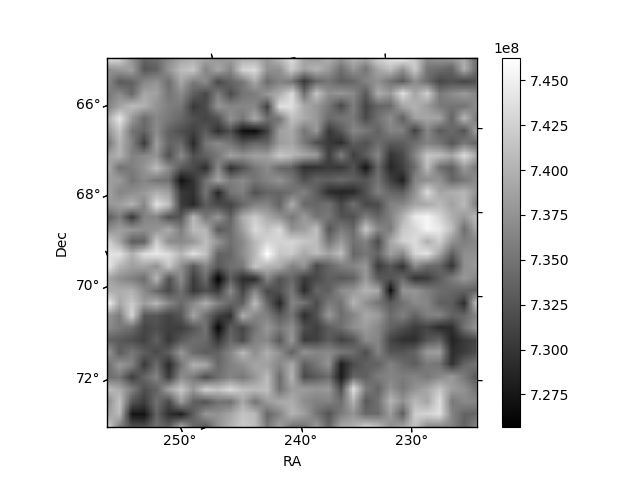
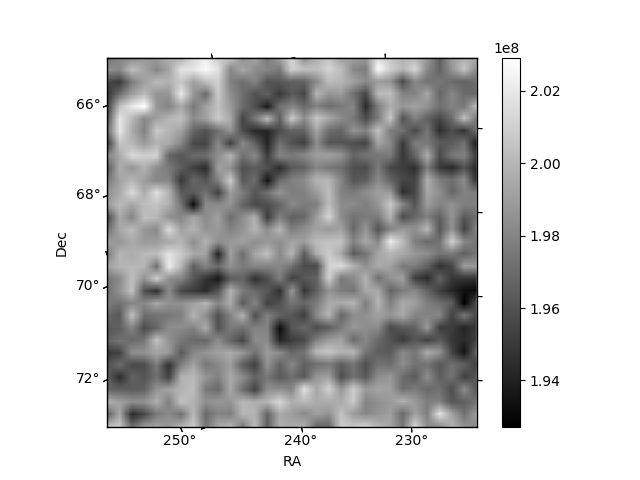
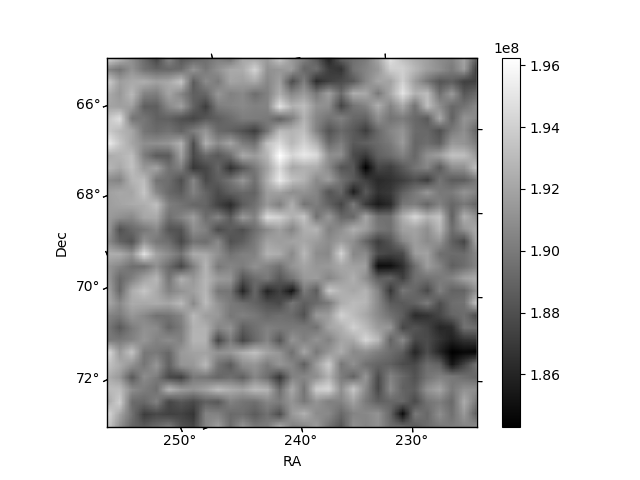
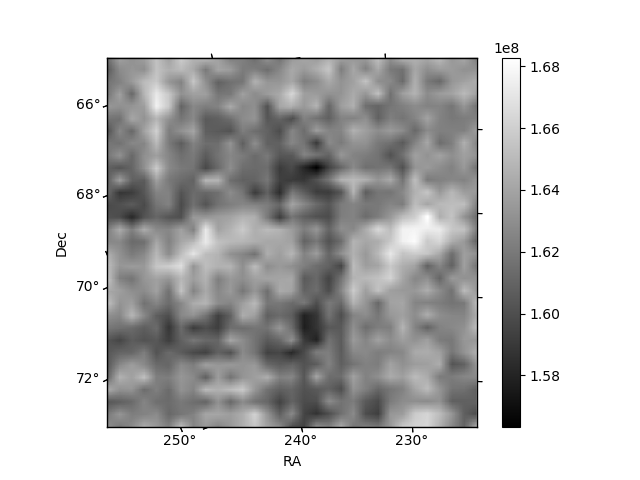
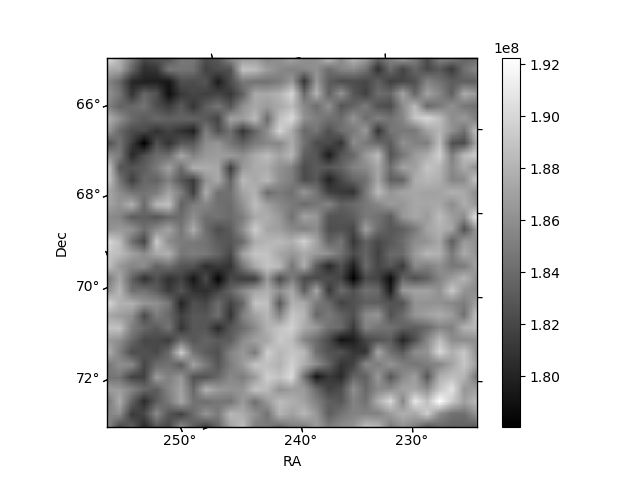
Histogram calculated using DETX and DETY for each event in the final _common_clean file
| Quadrant A | 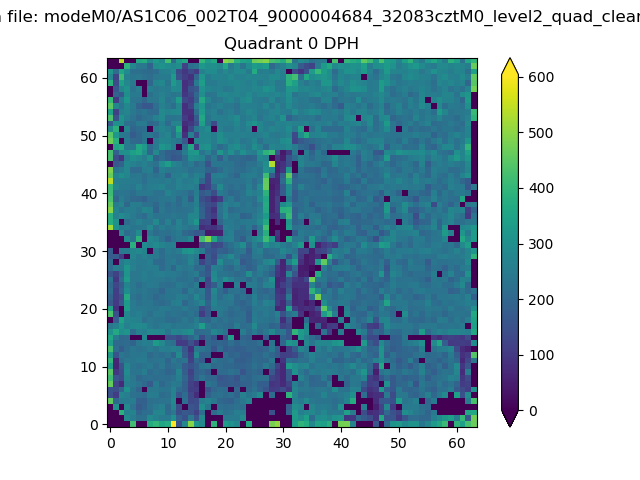 |
 |
Quadrant B |
|---|---|---|---|
| Quadrant D | 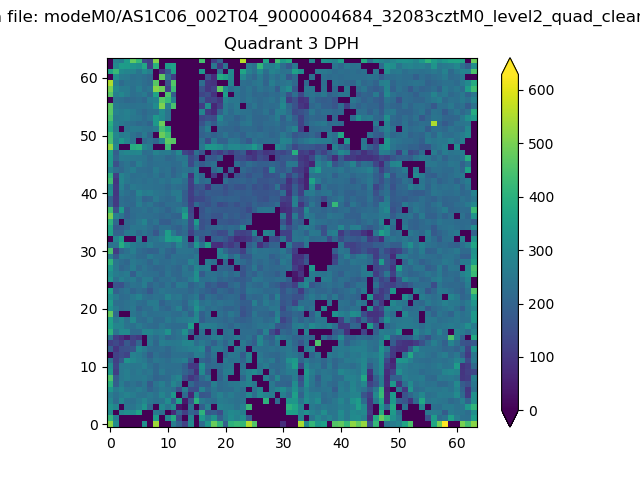 |
 |
Quadrant C |
| Plot type | Count rate plots | Images |
|---|---|---|
| Comparison with Poisson distribution Blue bars denote a histogram of data divided into 1 sec bins. Red curve is a Poisson curve with rate = median count rate of data. |
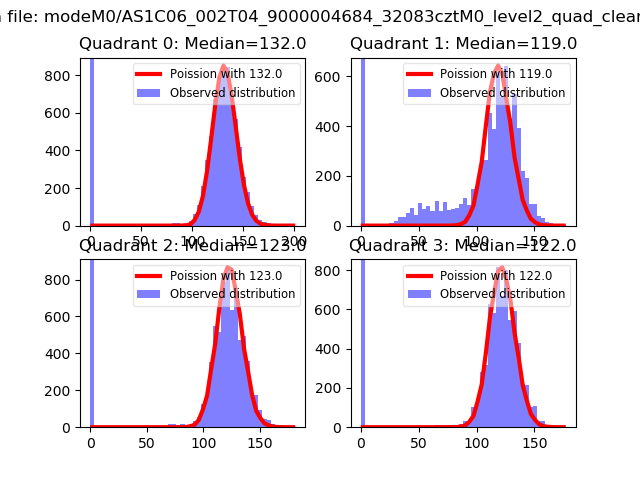 |
 |
| Quadrant-wise count rates Data is divided into 100 sec bins |
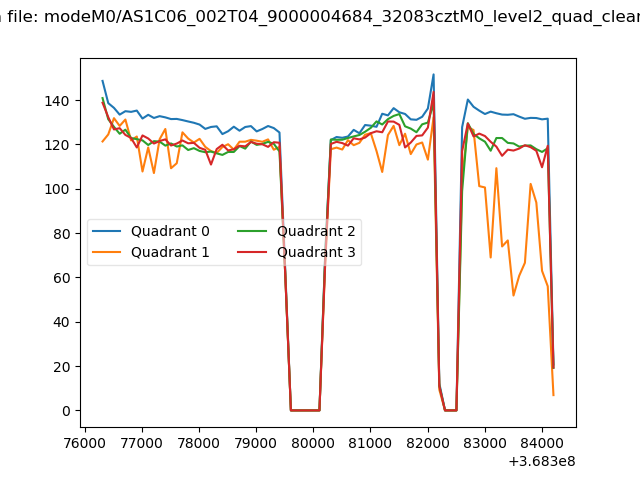 |
|
| Module-wise count rates for Quadrant A Data is divided into 100 sec bins |
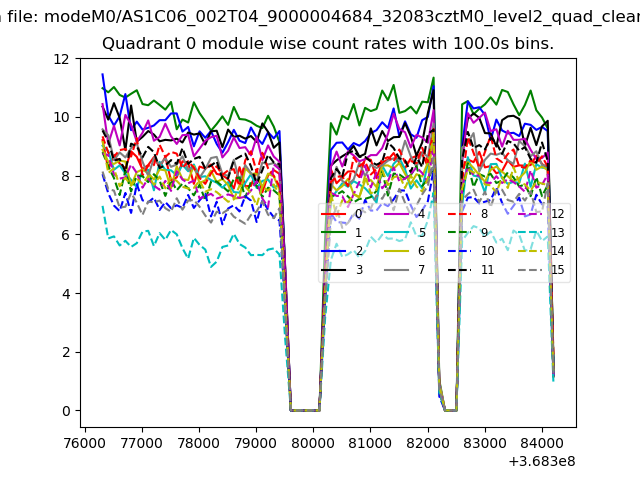 |
 |
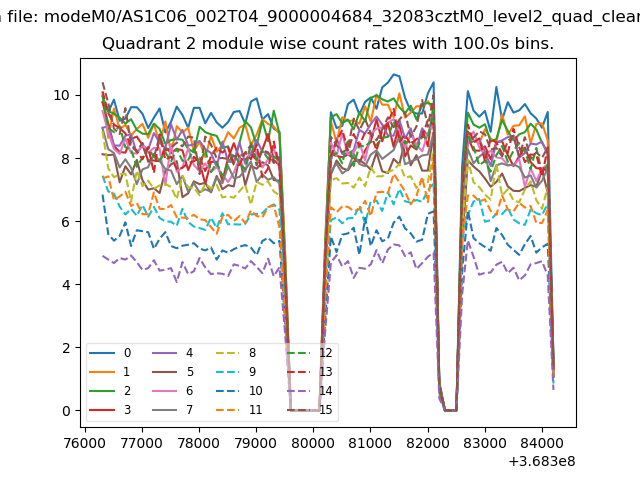
| Module-wise count rates for Quadrant B Data is divided into 100 sec bins |
 |
 |
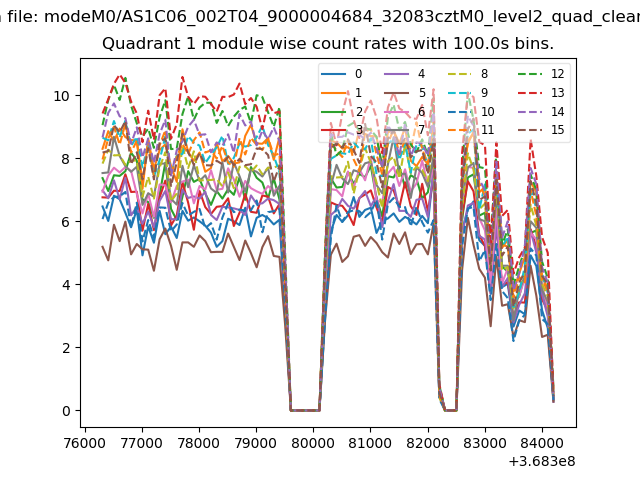
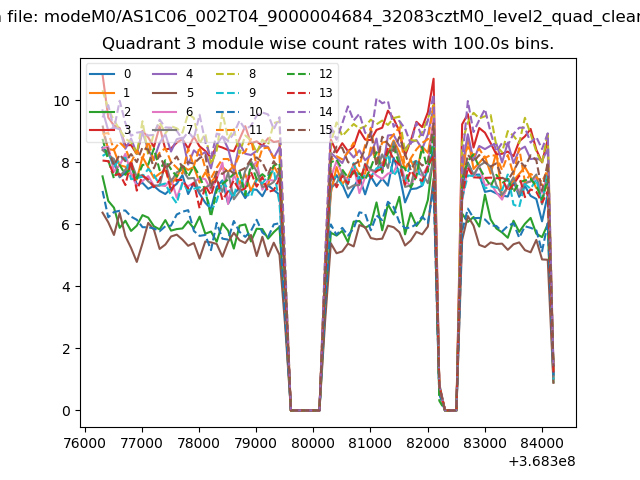
| Module-wise count rates for Quadrant C Data is divided into 100 sec bins |
 |
 |
| Module-wise count rates for Quadrant D Data is divided into 100 sec bins |
 |
 |
| Parameter | Plot |
|---|---|
| CZT HV Monitor | 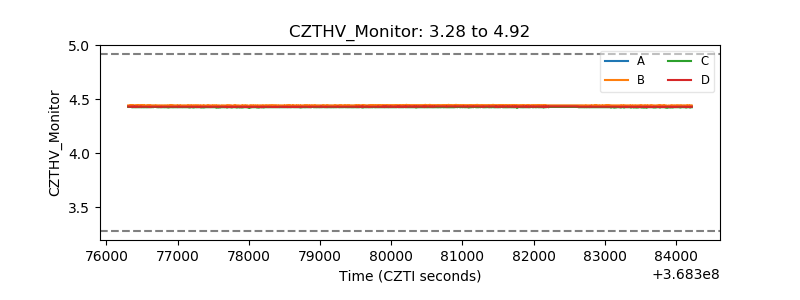 |
| D_VDD | 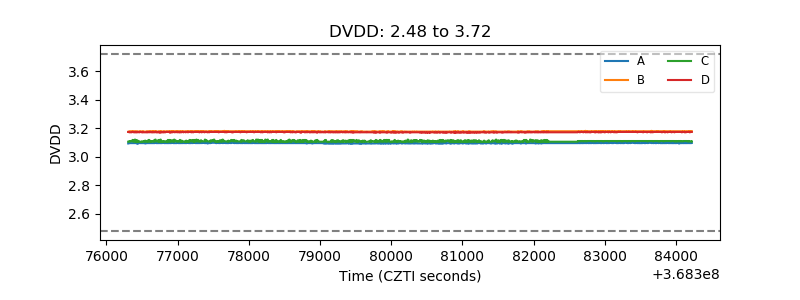 |
| Temperature 1 | 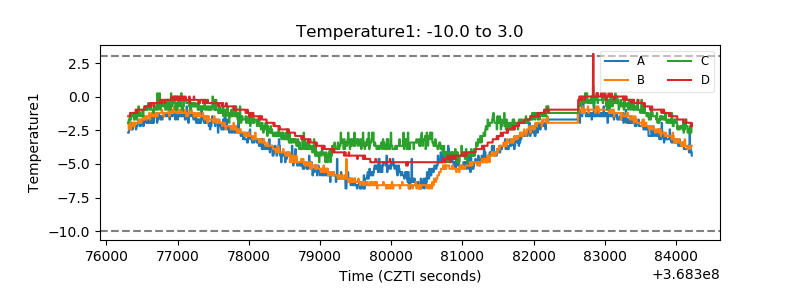 |
| Veto HV Monitor | 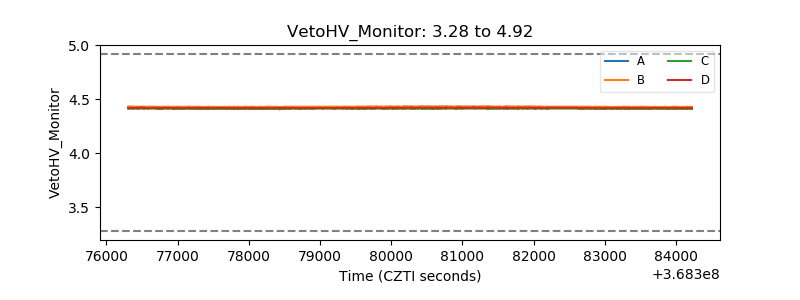 |
| Veto LLD |  |
| Alpha Counter | 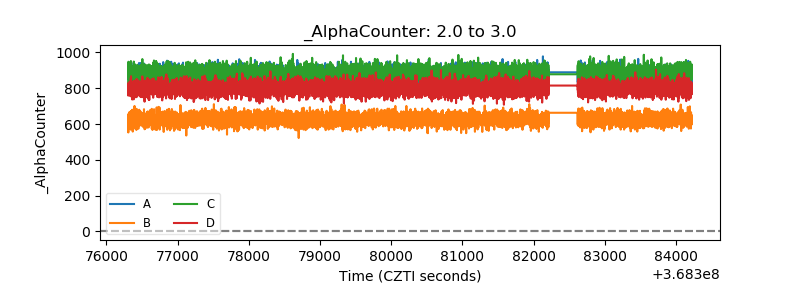 |
| _CPM_Rate | 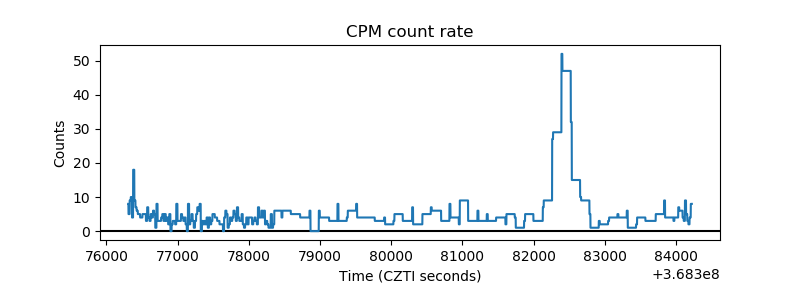 |
| CZT Counter |  |
| +2.5 Volts monitor |  |
| +5 Volts monitor |  |
| _ROLL_ROT | 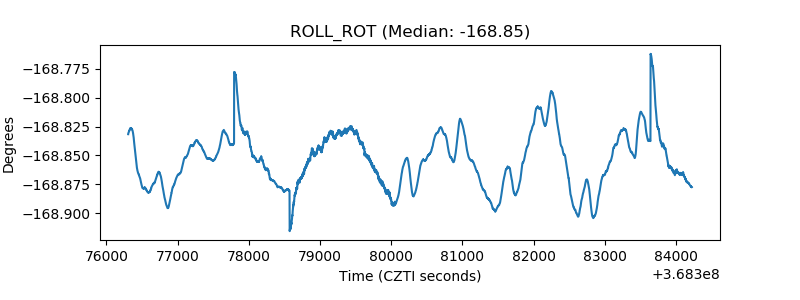 |
| _Roll_DEC | 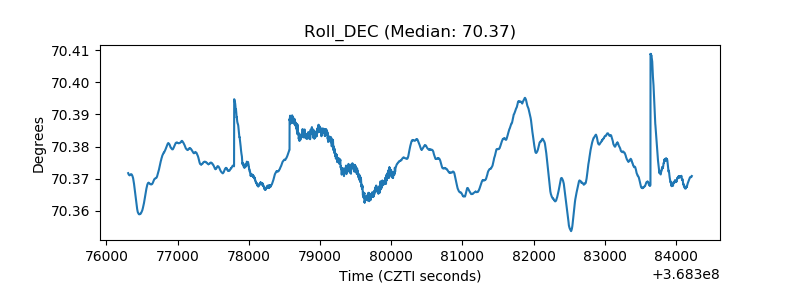 |
| _Roll_RA | 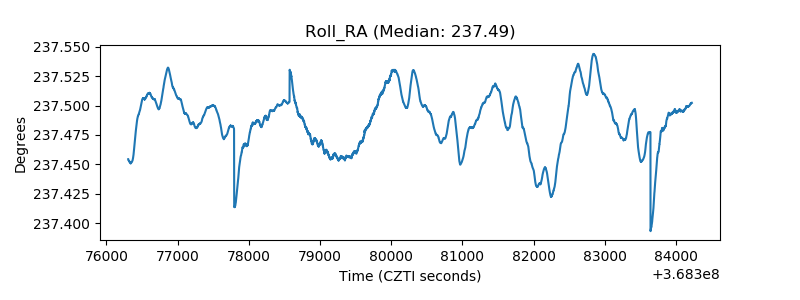 |
| Veto Counter | 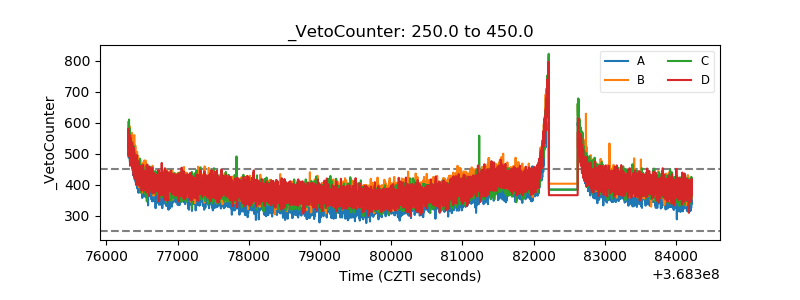 |