| Param | Original file | Final file |
|---|---|---|
| Filename | modeM0/AS1C06_002T04_9000004684_32085cztM0_level2.evt | modeM0/AS1C06_002T04_9000004684_32085cztM0_level2_quad_clean.evt |
| Size (bytes) | 1,658,272,320 | 198,218,880 |
| Size | 1.5 GB | 189.0 MB |
| Events in quadrant A | 5,783,929 | 1,444,122 |
| Events in quadrant B | 24,282,263 | 1,053,583 |
| Events in quadrant C | 7,252,025 | 1,351,260 |
| Events in quadrant D | 12,064,724 | 1,289,453 |
| Mode M9 | |||
|---|---|---|---|
| Quadrant | BADHDUFLAG | Total packets | Discarded packets |
| A | 0 | 15 | 0 |
| B | 0 | 15 | 0 |
| C | 0 | 15 | 0 |
| D | 0 | 15 | 0 |
| Mode M0 | |||
|---|---|---|---|
| Quadrant | BADHDUFLAG | Total packets | Discarded packets |
| A | 0 | 25397 | 2 |
| B | 0 | 80715 | 3 |
| C | 0 | 29528 | 2 |
| D | 0 | 44540 | 2 |
| Mode SS | |||
|---|---|---|---|
| Quadrant | BADHDUFLAG | Total packets | Discarded packets |
| A | 0 | 252 | 0 |
| B | 0 | 252 | 0 |
| C | 0 | 252 | 0 |
| D | 0 | 252 | 0 |
| Quadrant | Total seconds | Saturated seconds | Saturation percentage |
|---|---|---|---|
| A | 12464 | 34 | 0.272786% |
| B | 12463 | 8080 | 64.831902% |
| C | 12464 | 476 | 3.818999% |
| D | 12464 | 1475 | 11.834082% |
Noise dominated data is calculated using 1-second bins in cleaned event files. If a bin has >2000 counts, and if more than 50% of those come from <1% of pixels, then it is considered to be noise-dominated and hence unusable.
| Quadrant | # 1 sec bins | Bins with >0 counts | Bins with >2000 counts | High rate bins dominated by noise | Noise dominated (total time) | Noise dominated (detector-on time) | Marked lightcurve |
|---|---|---|---|---|---|---|---|
| A | 13869 | 12466 | 0 | 0 | 0.00% | 0.00% | 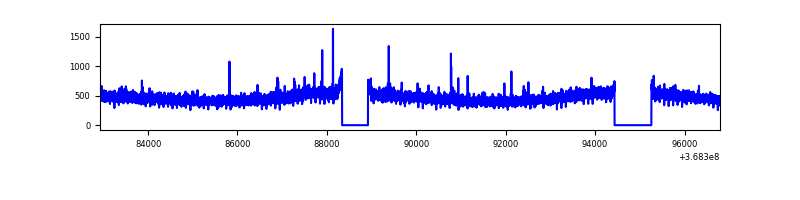 |
| B | 13868 | 12463 | 6879 | 6879 | 49.60% | 55.20% |  |
| C | 13869 | 12465 | 68 | 68 | 0.49% | 0.55% | 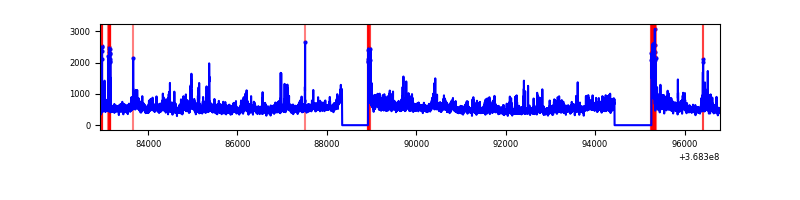 |
| D | 13869 | 12464 | 1303 | 1303 | 9.40% | 10.45% | 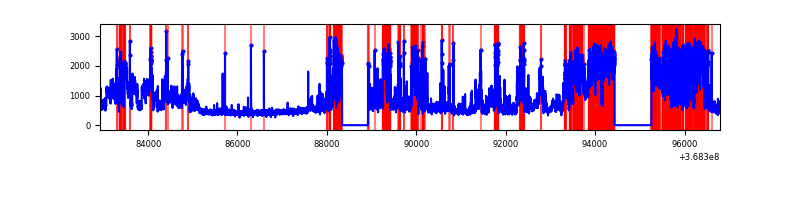 |
Top three noisy pixels from each quadrant. If the there are fewer than three noisy pixels in the level2.evt file, extra rows are filled as -1
| Pixel properties | Quadrant properties | ||||||
|---|---|---|---|---|---|---|---|
| Quadrant | DetID | PixID | Counts | Sigma | Mean | Median | Sigma |
| A | 13 | 254 | 24617 | 78.23 | 1485 | 1454 | 296.1 |
| A | 13 | 6 | 24285 | 77.11 | 1485 | 1454 | 296.1 |
| A | 15 | 174 | 22810 | 72.13 | 1485 | 1454 | 296.1 |
| B | 10 | 245 | 16624514 | 76072.98 | 1151 | 1121 | 218.5 |
| B | 6 | 159 | 2884329 | 13194.31 | 1151 | 1121 | 218.5 |
| B | 5 | 172 | 98015 | 443.41 | 1151 | 1121 | 218.5 |
| C | 3 | 233 | 592444 | 1806.28 | 1404 | 1413 | 327.2 |
| C | 0 | 10 | 448126 | 1365.23 | 1404 | 1413 | 327.2 |
| C | 14 | 238 | 401900 | 1223.95 | 1404 | 1413 | 327.2 |
| D | 12 | 227 | 3389497 | 10190.47 | 1390 | 1351 | 332.5 |
| D | 8 | 195 | 1966567 | 5910.74 | 1390 | 1351 | 332.5 |
| D | 12 | 233 | 944305 | 2836.11 | 1390 | 1351 | 332.5 |
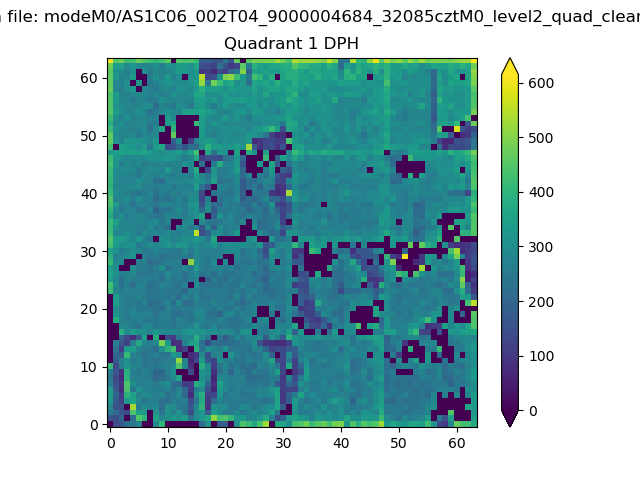
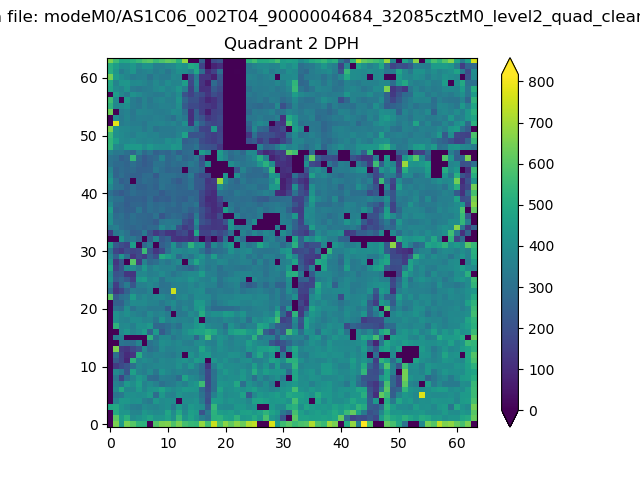
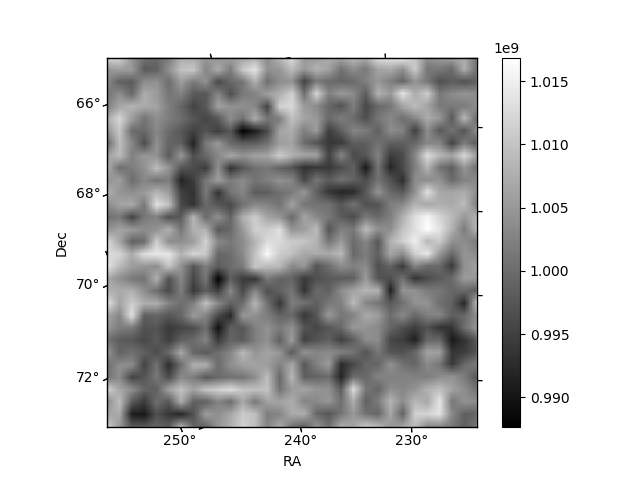
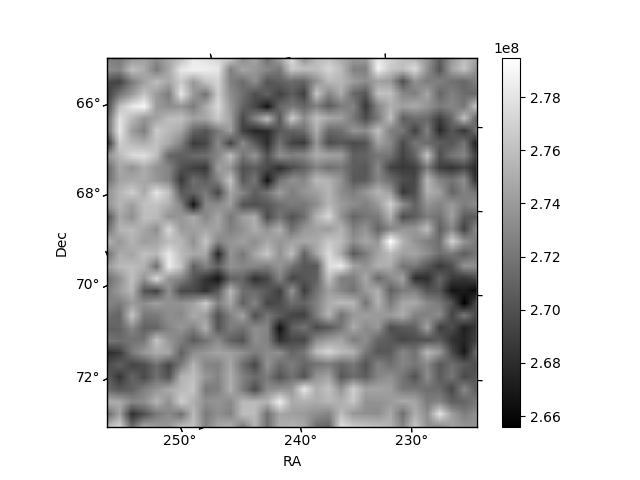
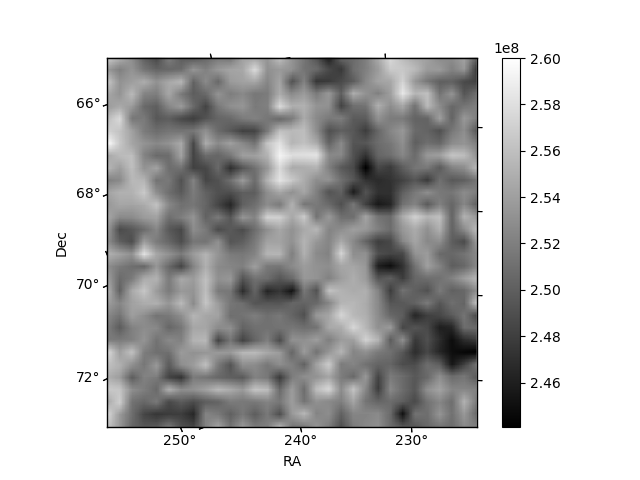
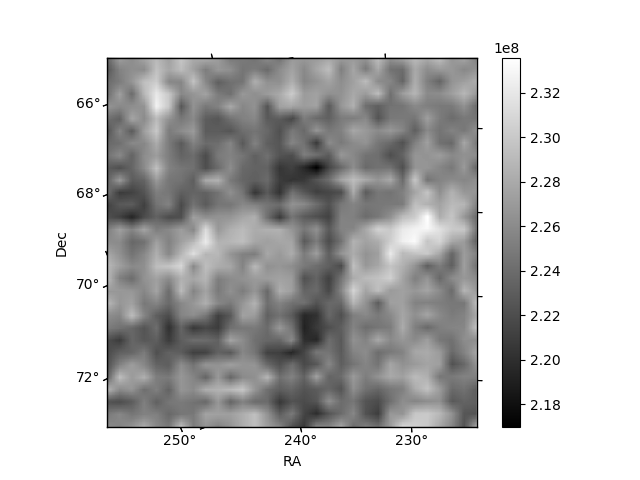
Histogram calculated using DETX and DETY for each event in the final _common_clean file
| Quadrant A | 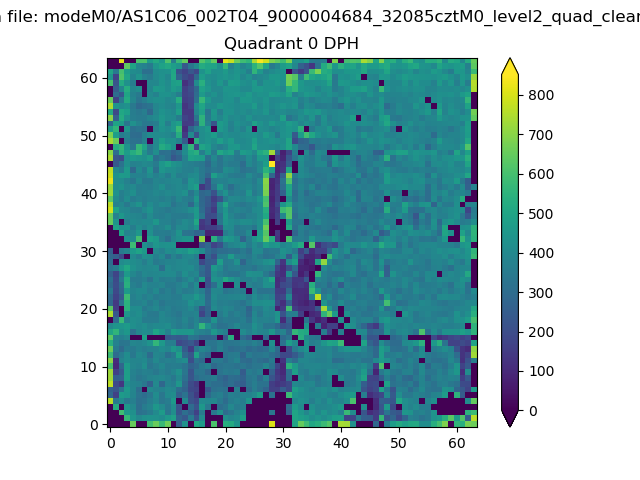 |
 |
Quadrant B |
|---|---|---|---|
| Quadrant D | 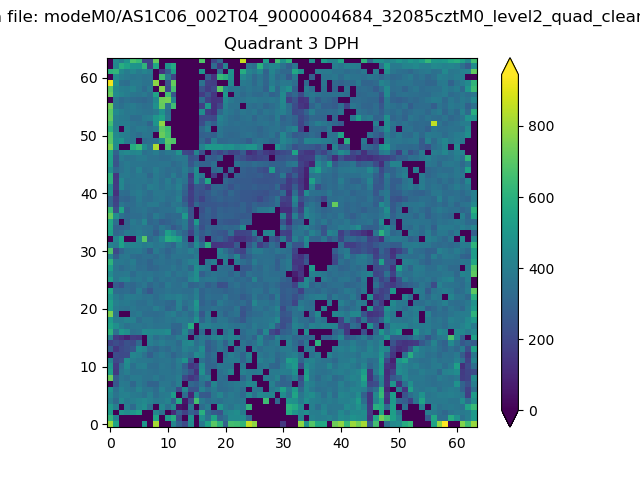 |
 |
Quadrant C |
| Plot type | Count rate plots | Images |
|---|---|---|
| Comparison with Poisson distribution Blue bars denote a histogram of data divided into 1 sec bins. Red curve is a Poisson curve with rate = median count rate of data. |
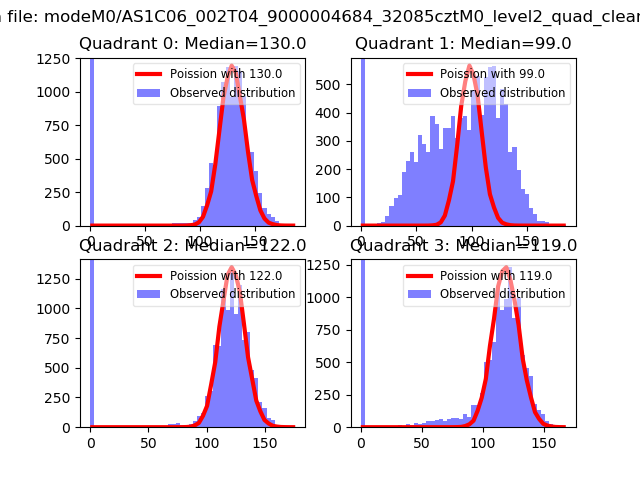 |
 |
| Quadrant-wise count rates Data is divided into 100 sec bins |
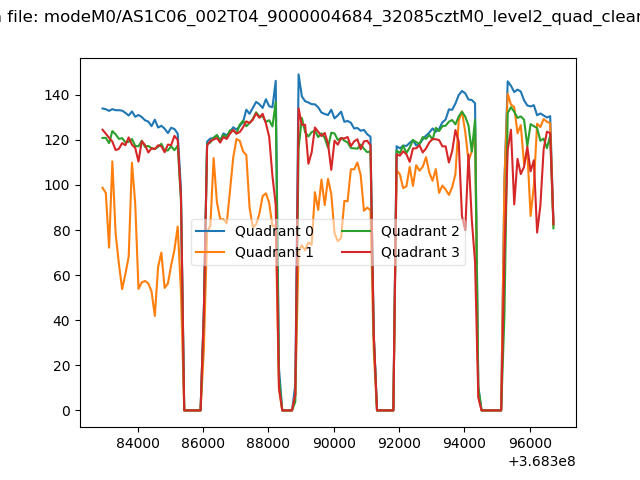 |
|
| Module-wise count rates for Quadrant A Data is divided into 100 sec bins |
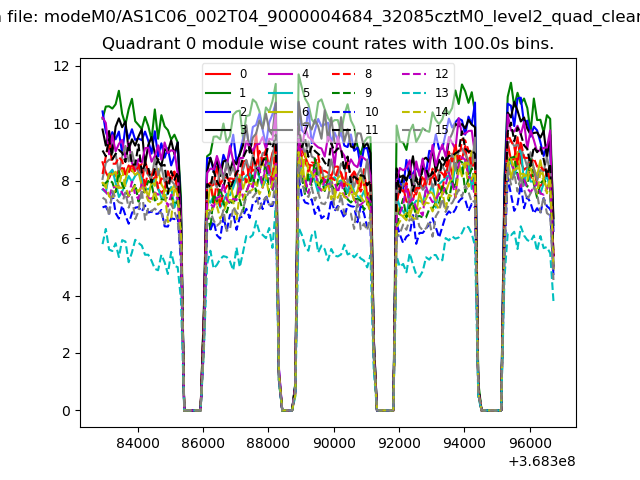 |
 |
| Module-wise count rates for Quadrant B Data is divided into 100 sec bins |
 |
 |
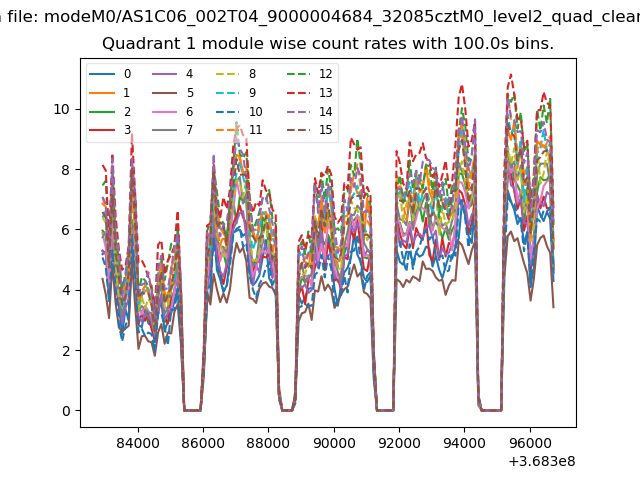
| Module-wise count rates for Quadrant C Data is divided into 100 sec bins |
 |
 |
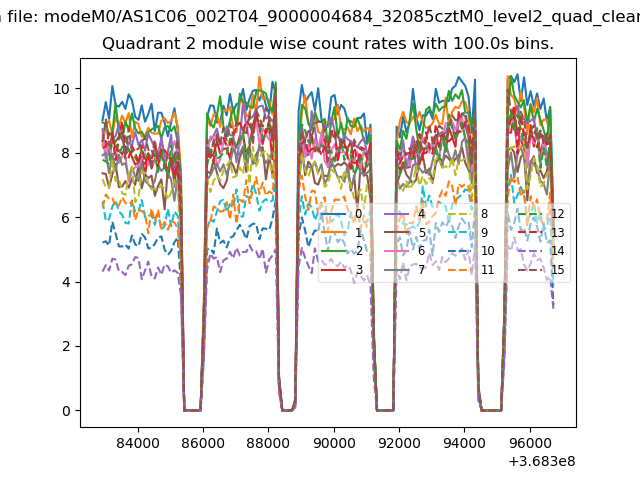
| Module-wise count rates for Quadrant D Data is divided into 100 sec bins |
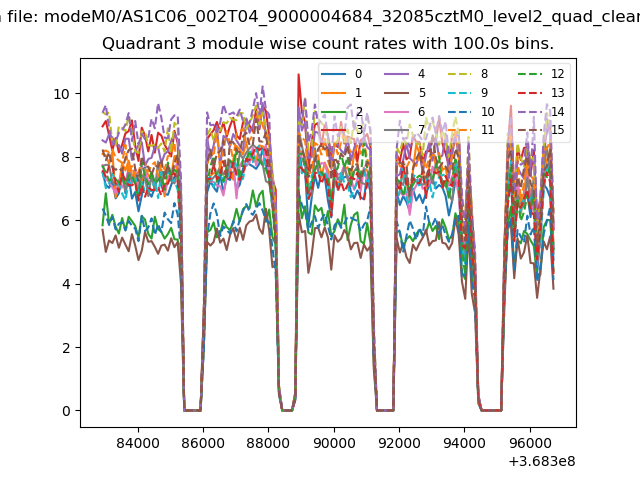 |
 |
| Parameter | Plot |
|---|---|
| CZT HV Monitor | 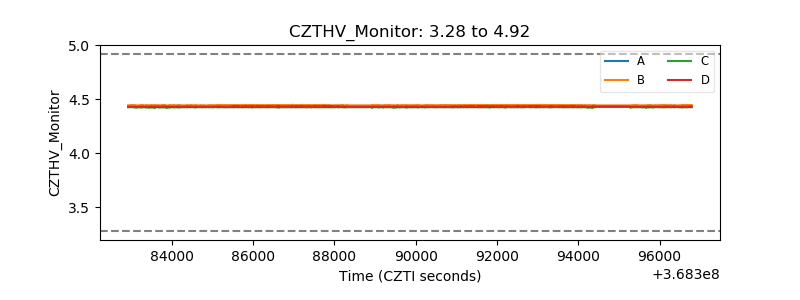 |
| D_VDD | 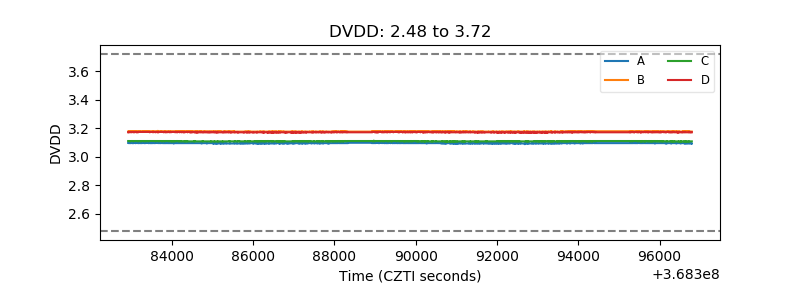 |
| Temperature 1 | 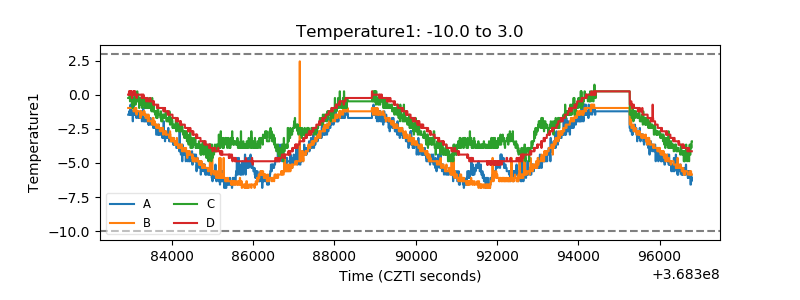 |
| Veto HV Monitor | 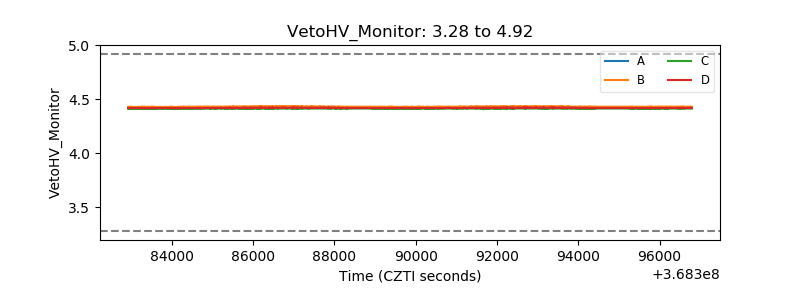 |
| Veto LLD | 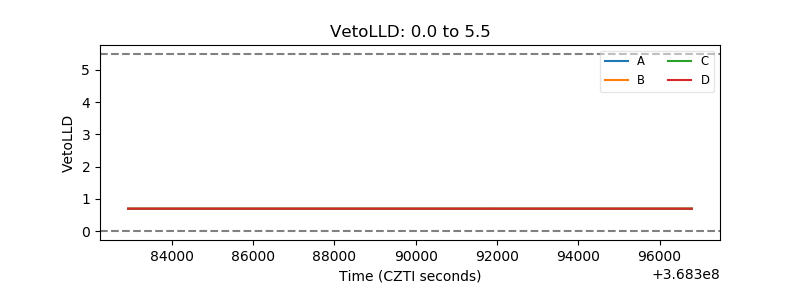 |
| Alpha Counter | 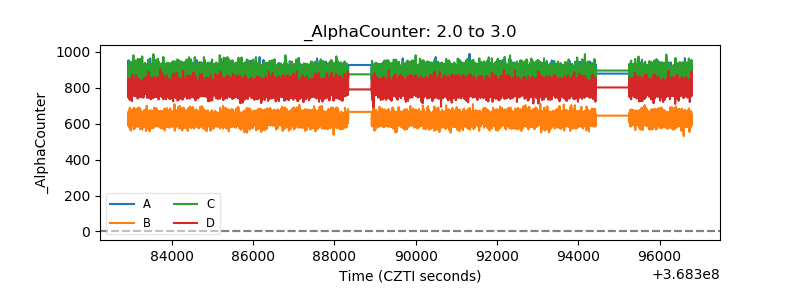 |
| _CPM_Rate | 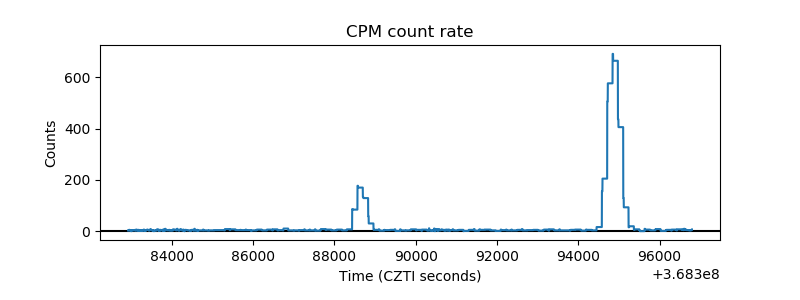 |
| CZT Counter | 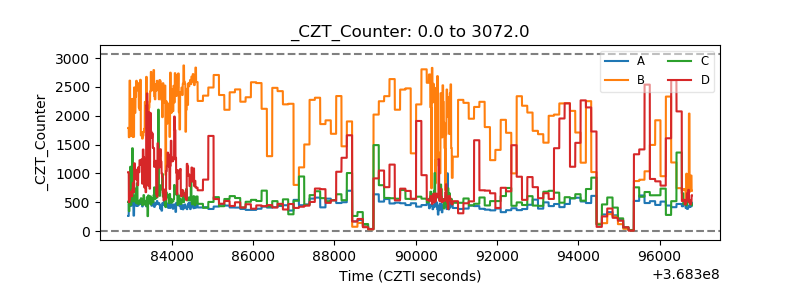 |
| +2.5 Volts monitor |  |
| +5 Volts monitor |  |
| _ROLL_ROT | 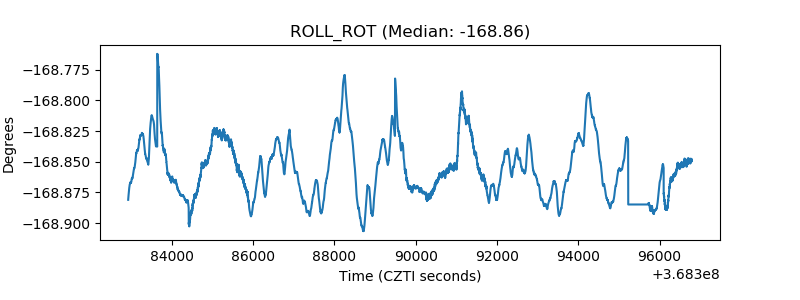 |
| _Roll_DEC | 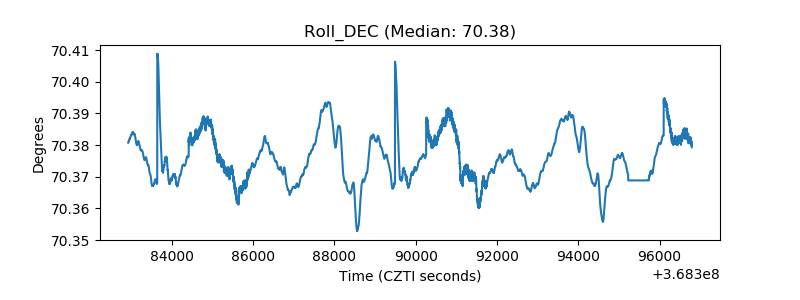 |
| _Roll_RA | 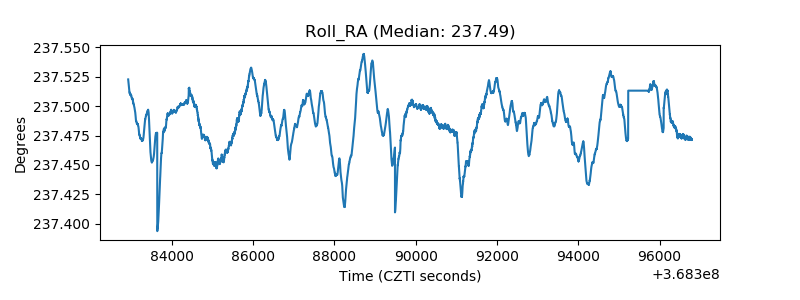 |
| Veto Counter | 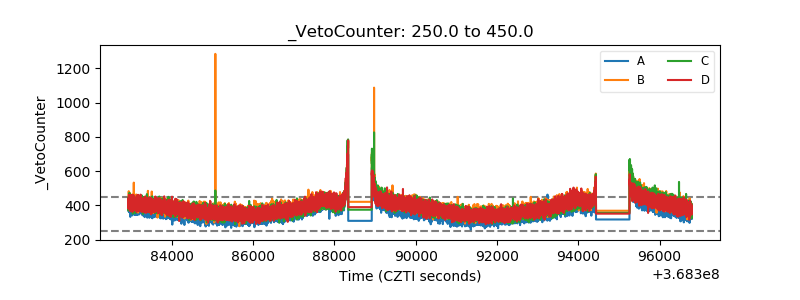 |