| Param | Original file | Final file |
|---|---|---|
| Filename | modeM0/AS1C06_002T04_9000004684_32086cztM0_level2.evt | modeM0/AS1C06_002T04_9000004684_32086cztM0_level2_quad_clean.evt |
| Size (bytes) | 889,286,400 | 110,174,400 |
| Size | 848.1 MB | 105.1 MB |
| Events in quadrant A | 3,136,713 | 803,712 |
| Events in quadrant B | 11,159,232 | 662,630 |
| Events in quadrant C | 3,952,271 | 739,380 |
| Events in quadrant D | 8,233,346 | 662,795 |
| Mode M9 | |||
|---|---|---|---|
| Quadrant | BADHDUFLAG | Total packets | Discarded packets |
| A | 0 | 10 | 0 |
| B | 0 | 11 | 0 |
| C | 0 | 11 | 0 |
| D | 0 | 11 | 0 |
| Mode M0 | |||
|---|---|---|---|
| Quadrant | BADHDUFLAG | Total packets | Discarded packets |
| A | 0 | 13656 | 2 |
| B | 0 | 37842 | 6 |
| C | 0 | 16116 | 2 |
| D | 0 | 28974 | 2 |
| Mode SS | |||
|---|---|---|---|
| Quadrant | BADHDUFLAG | Total packets | Discarded packets |
| A | 0 | 134 | 0 |
| B | 0 | 134 | 0 |
| C | 0 | 134 | 0 |
| D | 0 | 134 | 0 |
| Quadrant | Total seconds | Saturated seconds | Saturation percentage |
|---|---|---|---|
| A | 6689 | 20 | 0.298998% |
| B | 6688 | 3010 | 45.005981% |
| C | 6688 | 558 | 8.343301% |
| D | 6688 | 1462 | 21.860048% |
Noise dominated data is calculated using 1-second bins in cleaned event files. If a bin has >2000 counts, and if more than 50% of those come from <1% of pixels, then it is considered to be noise-dominated and hence unusable.
| Quadrant | # 1 sec bins | Bins with >0 counts | Bins with >2000 counts | High rate bins dominated by noise | Noise dominated (total time) | Noise dominated (detector-on time) | Marked lightcurve |
|---|---|---|---|---|---|---|---|
| A | 7669 | 6690 | 0 | 0 | 0.00% | 0.00% |  |
| B | 7667 | 6687 | 2340 | 2340 | 30.52% | 34.99% | 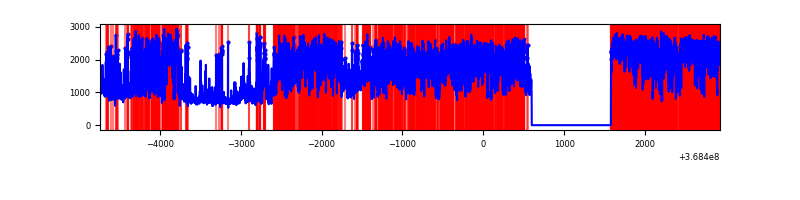 |
| C | 7668 | 6688 | 89 | 89 | 1.16% | 1.33% | 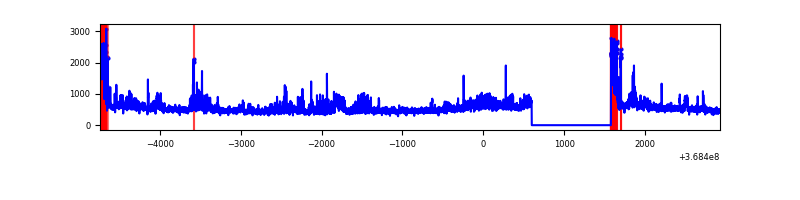 |
| D | 7668 | 6688 | 1363 | 1363 | 17.78% | 20.38% |  |
Top three noisy pixels from each quadrant. If the there are fewer than three noisy pixels in the level2.evt file, extra rows are filled as -1
| Pixel properties | Quadrant properties | ||||||
|---|---|---|---|---|---|---|---|
| Quadrant | DetID | PixID | Counts | Sigma | Mean | Median | Sigma |
| A | 13 | 6 | 17673 | 104.16 | 807 | 790 | 162.1 |
| A | 13 | 254 | 14813 | 86.51 | 807 | 790 | 162.1 |
| A | 3 | 137 | 8176 | 45.57 | 807 | 790 | 162.1 |
| B | 10 | 245 | 6446257 | 47463.96 | 702 | 684 | 135.8 |
| B | 6 | 159 | 1702276 | 12530.2 | 702 | 684 | 135.8 |
| B | 5 | 172 | 116569 | 853.35 | 702 | 684 | 135.8 |
| C | 0 | 10 | 448342 | 2523.56 | 754 | 756 | 177.4 |
| C | 14 | 238 | 281099 | 1580.62 | 754 | 756 | 177.4 |
| C | 14 | 254 | 218667 | 1228.62 | 754 | 756 | 177.4 |
| D | 12 | 227 | 3963035 | 23342.51 | 710 | 691 | 169.7 |
| D | 12 | 233 | 541122 | 3183.73 | 710 | 691 | 169.7 |
| D | 12 | 218 | 499527 | 2938.69 | 710 | 691 | 169.7 |
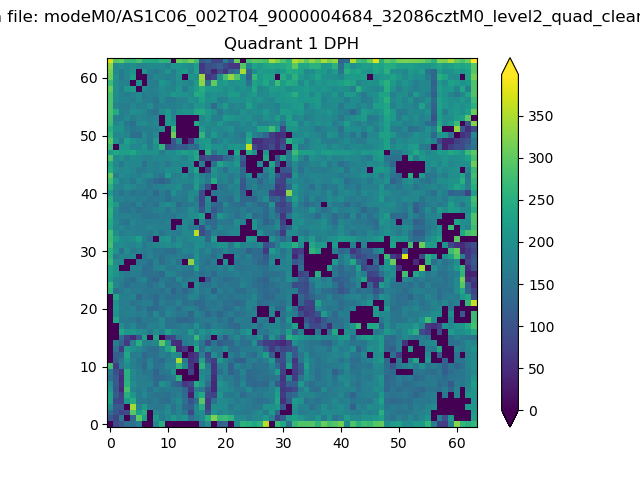
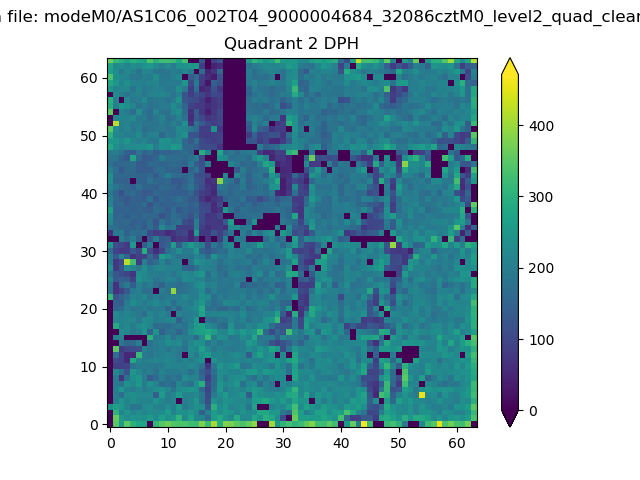
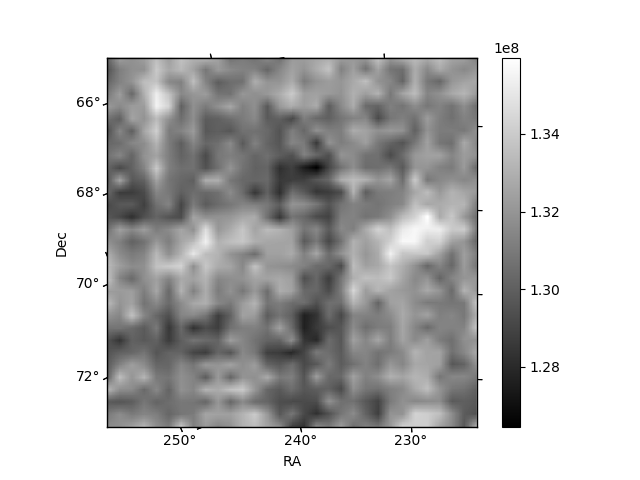
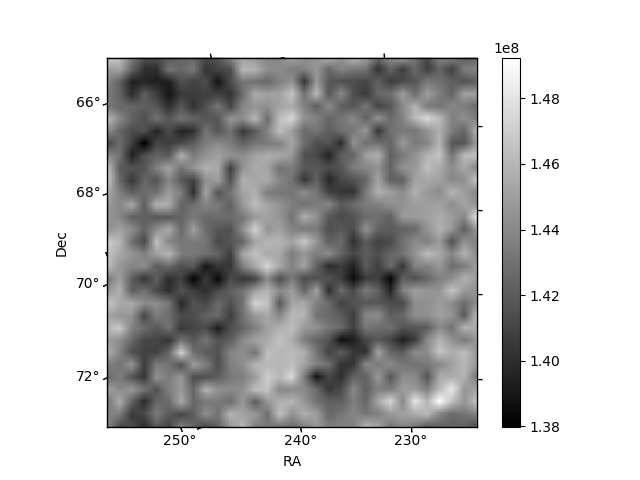
Histogram calculated using DETX and DETY for each event in the final _common_clean file
| Quadrant A |  |
 |
Quadrant B |
|---|---|---|---|
| Quadrant D | 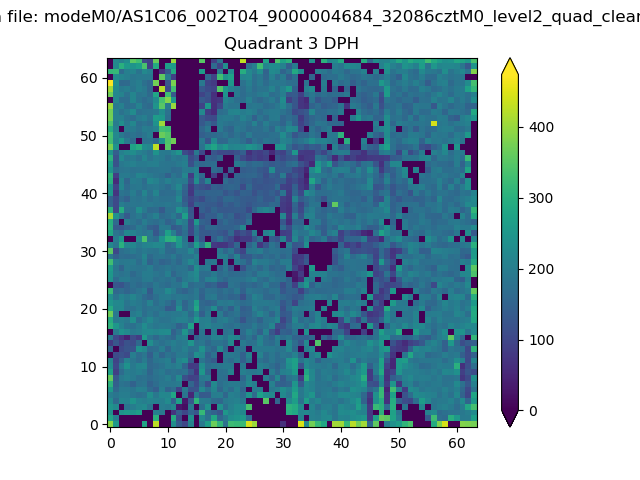 |
 |
Quadrant C |
| Plot type | Count rate plots | Images |
|---|---|---|
| Comparison with Poisson distribution Blue bars denote a histogram of data divided into 1 sec bins. Red curve is a Poisson curve with rate = median count rate of data. |
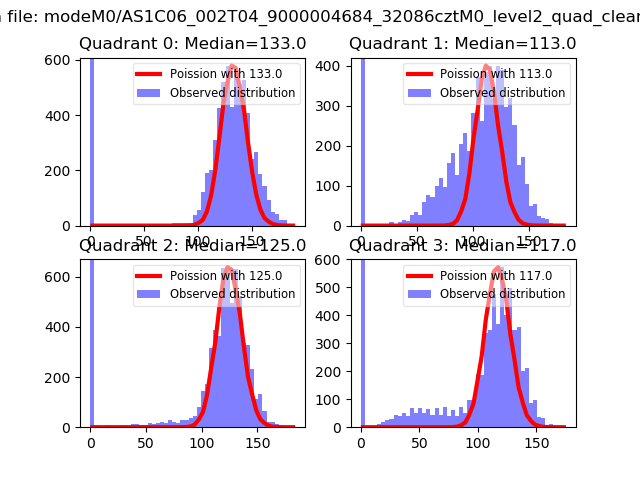 |
 |
| Quadrant-wise count rates Data is divided into 100 sec bins |
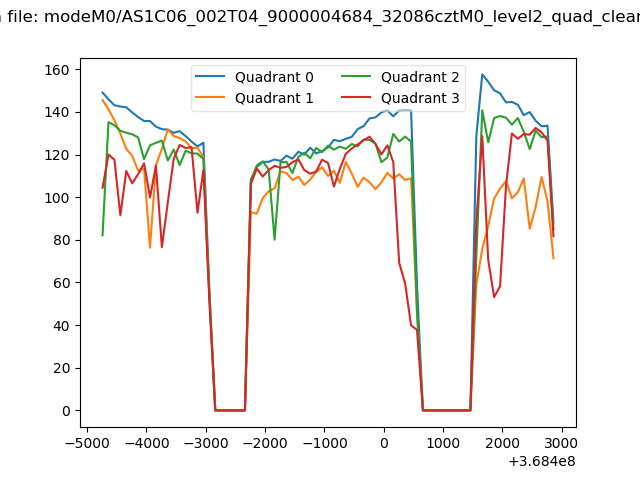 |
|
| Module-wise count rates for Quadrant A Data is divided into 100 sec bins |
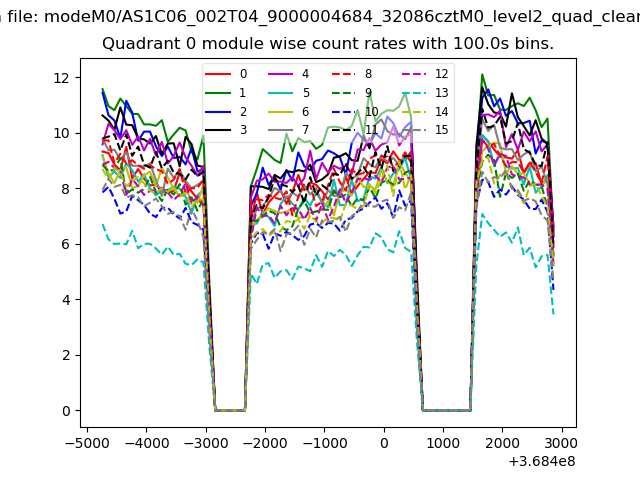 |
 |
| Module-wise count rates for Quadrant B Data is divided into 100 sec bins |
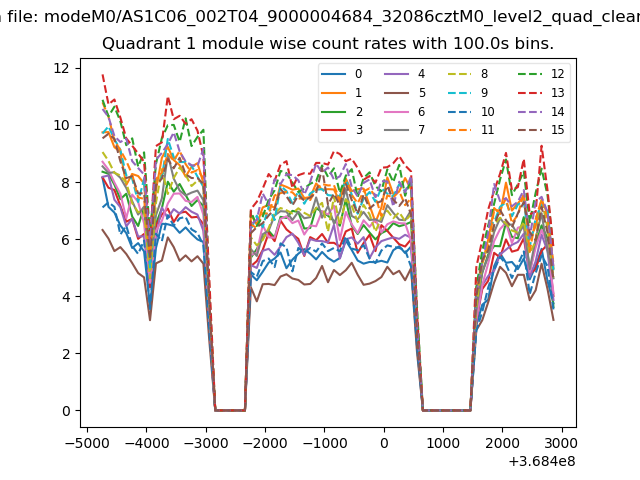 |
 |
| Module-wise count rates for Quadrant C Data is divided into 100 sec bins |
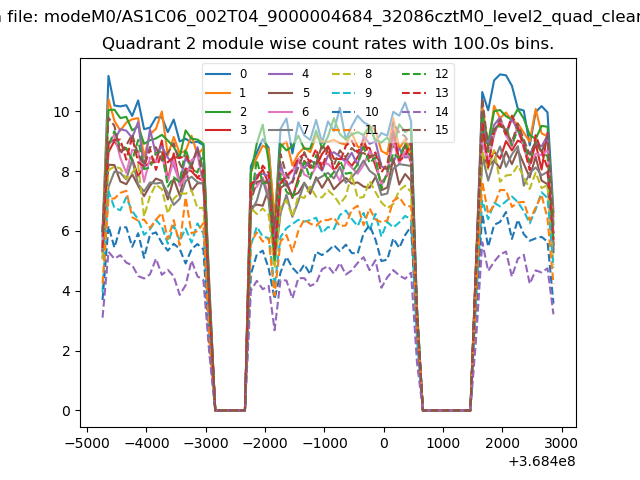 |
 |
| Module-wise count rates for Quadrant D Data is divided into 100 sec bins |
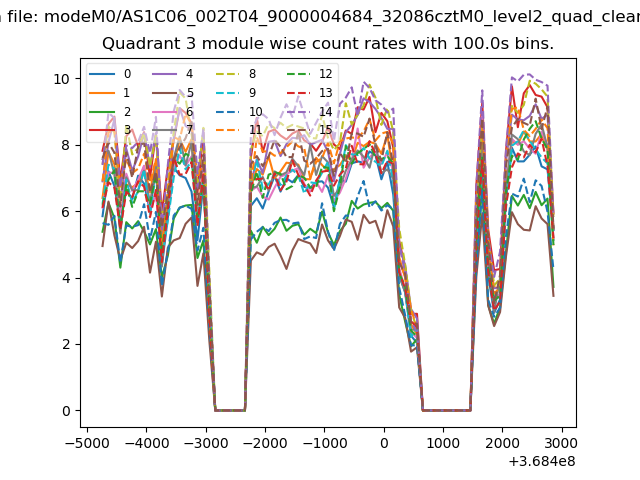 |
 |
| Parameter | Plot |
|---|---|
| CZT HV Monitor | 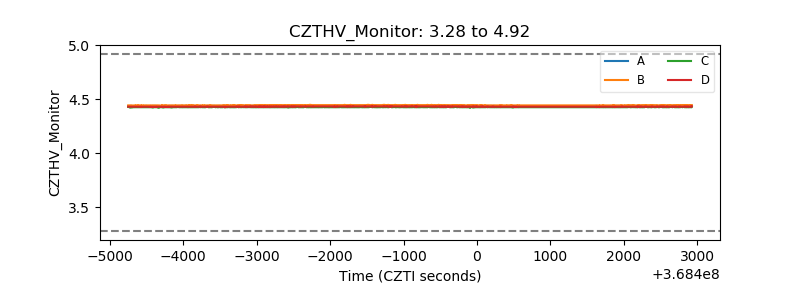 |
| D_VDD | 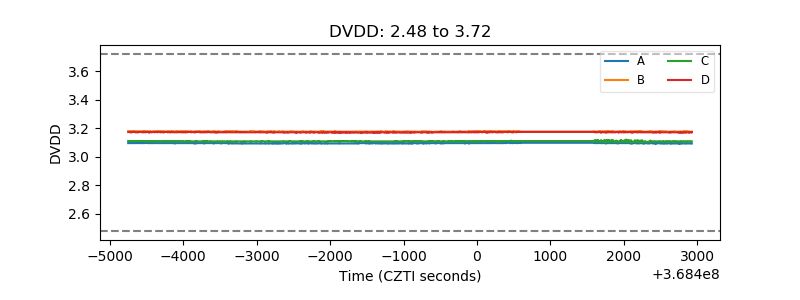 |
| Temperature 1 | 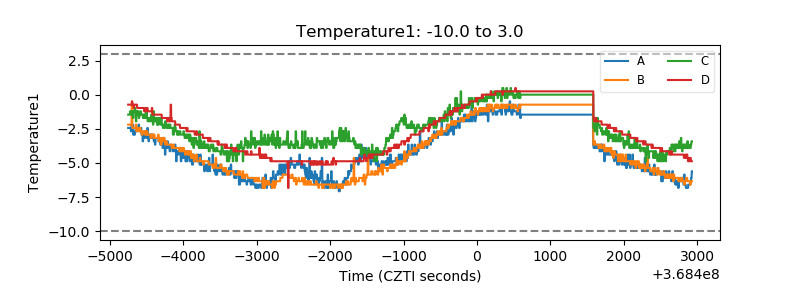 |
| Veto HV Monitor | 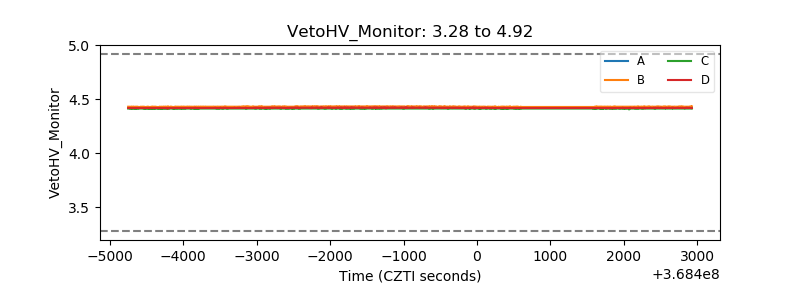 |
| Veto LLD |  |
| Alpha Counter | 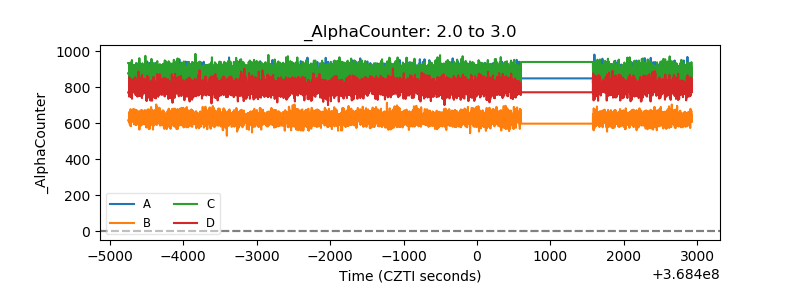 |
| _CPM_Rate | 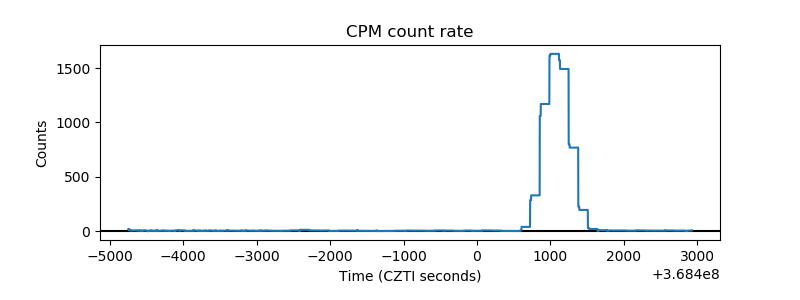 |
| CZT Counter | 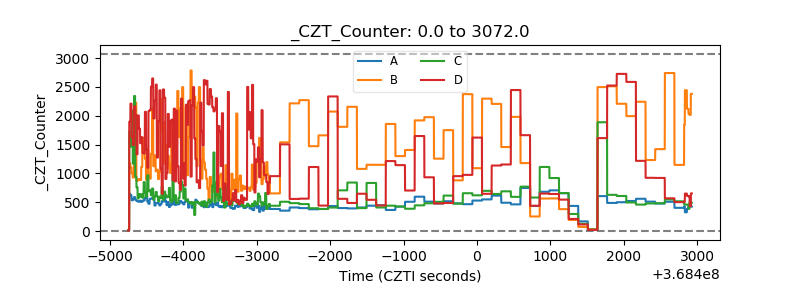 |
| +2.5 Volts monitor |  |
| +5 Volts monitor |  |
| _ROLL_ROT | 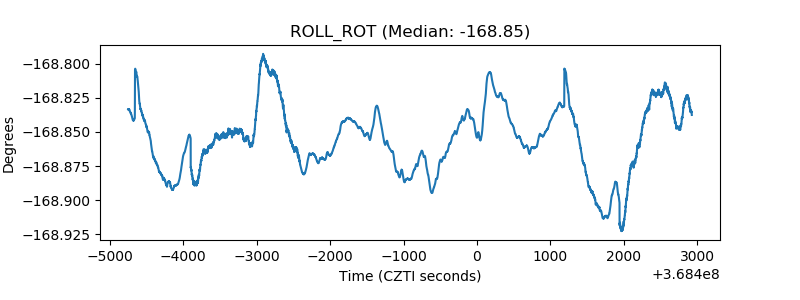 |
| _Roll_DEC | 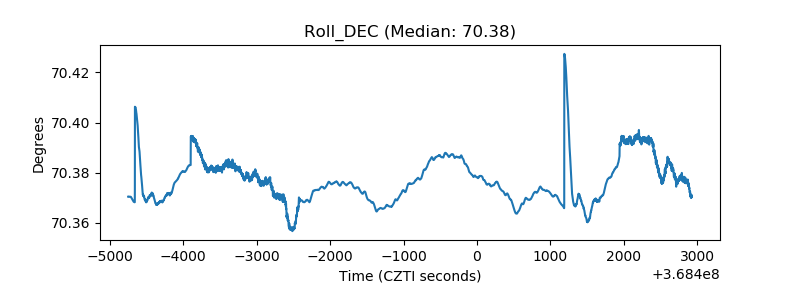 |
| _Roll_RA | 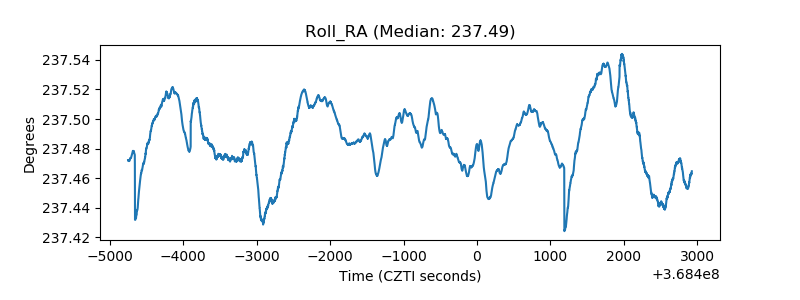 |
| Veto Counter | 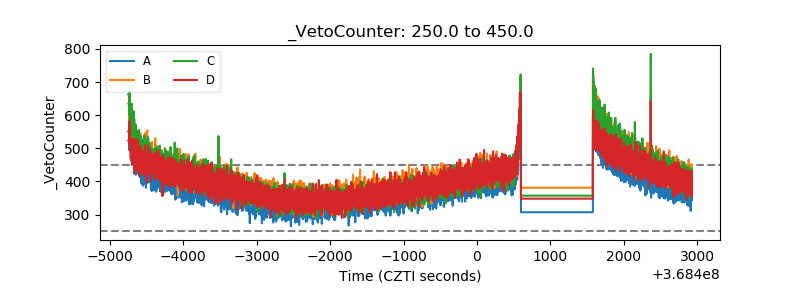 |