| Param | Original file | Final file |
|---|---|---|
| Filename | modeM0/AS1C06_002T04_9000004684_32088cztM0_level2.evt | modeM0/AS1C06_002T04_9000004684_32088cztM0_level2_quad_clean.evt |
| Size (bytes) | 695,695,680 | 105,825,600 |
| Size | 663.5 MB | 100.9 MB |
| Events in quadrant A | 3,070,529 | 737,557 |
| Events in quadrant B | 8,951,674 | 657,513 |
| Events in quadrant C | 3,509,980 | 692,814 |
| Events in quadrant D | 5,097,242 | 662,538 |
| Mode M9 | |||
|---|---|---|---|
| Quadrant | BADHDUFLAG | Total packets | Discarded packets |
| A | 0 | 11 | 0 |
| B | 0 | 11 | 0 |
| C | 0 | 11 | 0 |
| D | 0 | 11 | 0 |
| Mode M0 | |||
|---|---|---|---|
| Quadrant | BADHDUFLAG | Total packets | Discarded packets |
| A | 0 | 13345 | 1 |
| B | 0 | 31114 | 1 |
| C | 0 | 14573 | 1 |
| D | 0 | 19772 | 1 |
| Mode SS | |||
|---|---|---|---|
| Quadrant | BADHDUFLAG | Total packets | Discarded packets |
| A | 0 | 132 | 0 |
| B | 0 | 132 | 0 |
| C | 0 | 132 | 0 |
| D | 0 | 132 | 0 |
| Quadrant | Total seconds | Saturated seconds | Saturation percentage |
|---|---|---|---|
| A | 6501 | 28 | 0.430703% |
| B | 6501 | 2028 | 31.195201% |
| C | 6501 | 332 | 5.106907% |
| D | 6502 | 472 | 7.259305% |
Noise dominated data is calculated using 1-second bins in cleaned event files. If a bin has >2000 counts, and if more than 50% of those come from <1% of pixels, then it is considered to be noise-dominated and hence unusable.
| Quadrant | # 1 sec bins | Bins with >0 counts | Bins with >2000 counts | High rate bins dominated by noise | Noise dominated (total time) | Noise dominated (detector-on time) | Marked lightcurve |
|---|---|---|---|---|---|---|---|
| A | 7601 | 6501 | 0 | 0 | 0.00% | 0.00% | 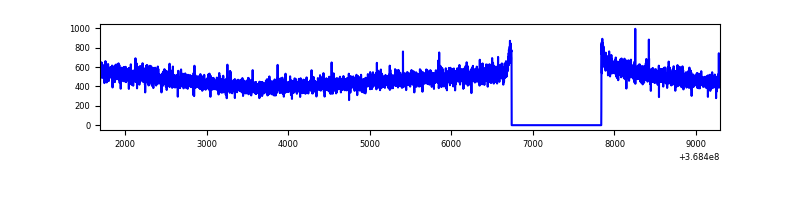 |
| B | 7601 | 6501 | 1706 | 1706 | 22.44% | 26.24% |  |
| C | 7601 | 6501 | 17 | 17 | 0.22% | 0.26% | 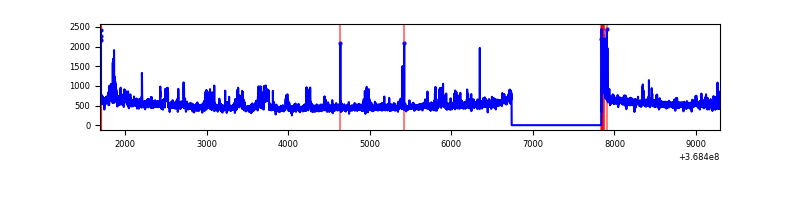 |
| D | 7602 | 6502 | 419 | 419 | 5.51% | 6.44% | 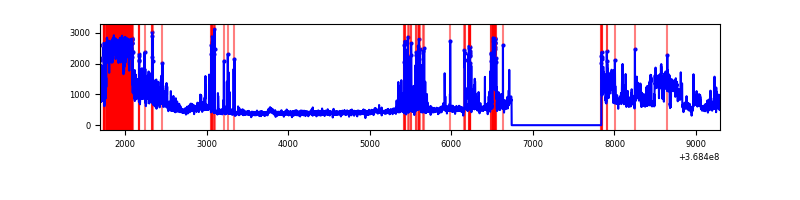 |
Top three noisy pixels from each quadrant. If the there are fewer than three noisy pixels in the level2.evt file, extra rows are filled as -1
| Pixel properties | Quadrant properties | ||||||
|---|---|---|---|---|---|---|---|
| Quadrant | DetID | PixID | Counts | Sigma | Mean | Median | Sigma |
| A | 13 | 254 | 15298 | 92.13 | 792 | 776 | 157.6 |
| A | 13 | 6 | 10275 | 60.26 | 792 | 776 | 157.6 |
| A | 3 | 137 | 7682 | 43.81 | 792 | 776 | 157.6 |
| B | 10 | 245 | 4186406 | 30563.77 | 722 | 704 | 136.9 |
| B | 6 | 159 | 1660991 | 12123.33 | 722 | 704 | 136.9 |
| B | 5 | 172 | 152429 | 1107.89 | 722 | 704 | 136.9 |
| C | 14 | 238 | 236913 | 1334.2 | 753 | 757 | 177.0 |
| C | 14 | 254 | 155803 | 875.95 | 753 | 757 | 177.0 |
| C | 0 | 10 | 113200 | 635.26 | 753 | 757 | 177.0 |
| D | 12 | 227 | 966738 | 5489.91 | 740 | 721 | 176.0 |
| D | 8 | 195 | 758765 | 4307.99 | 740 | 721 | 176.0 |
| D | 2 | 250 | 154564 | 874.3 | 740 | 721 | 176.0 |
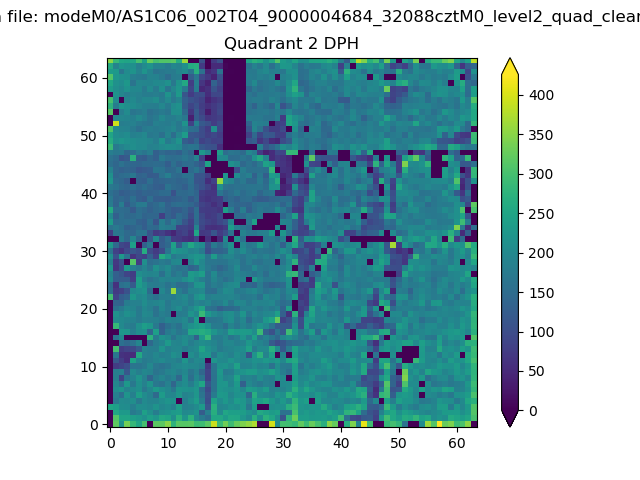
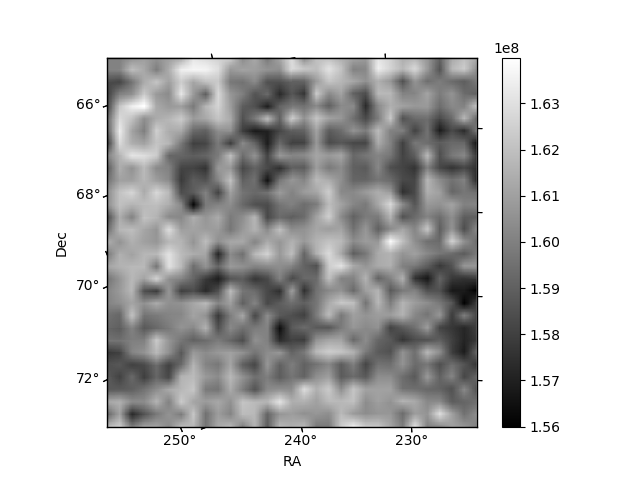
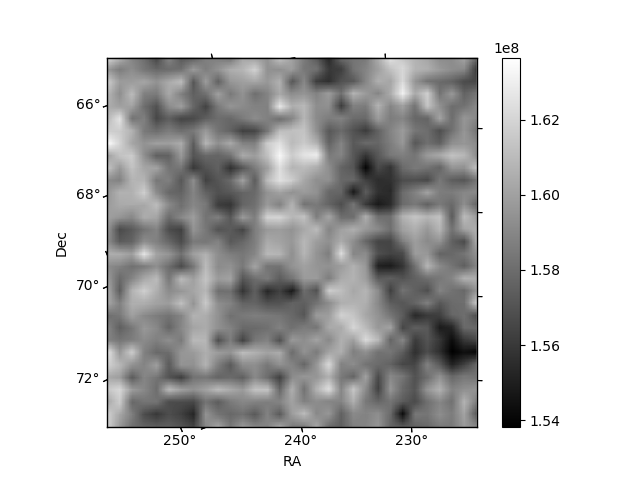
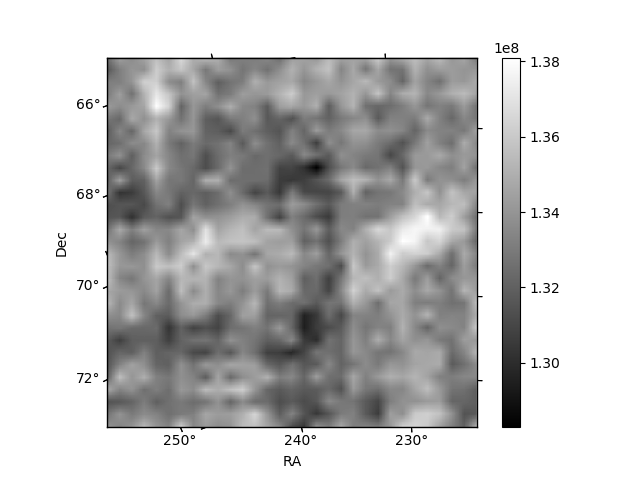
Histogram calculated using DETX and DETY for each event in the final _common_clean file
| Quadrant A | 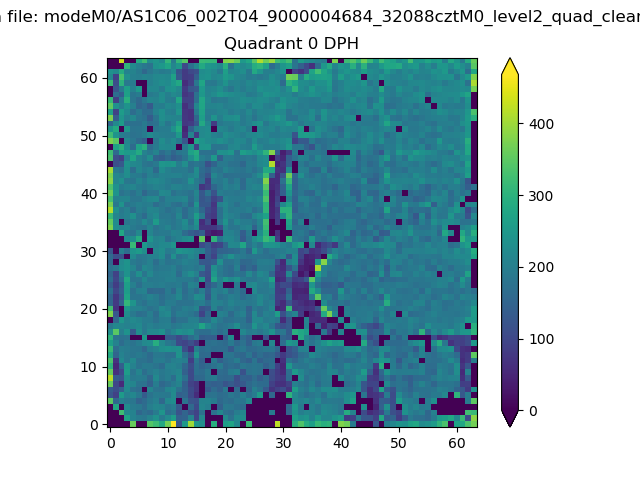 |
 |
Quadrant B |
|---|---|---|---|
| Quadrant D |  |
 |
Quadrant C |
| Plot type | Count rate plots | Images |
|---|---|---|
| Comparison with Poisson distribution Blue bars denote a histogram of data divided into 1 sec bins. Red curve is a Poisson curve with rate = median count rate of data. |
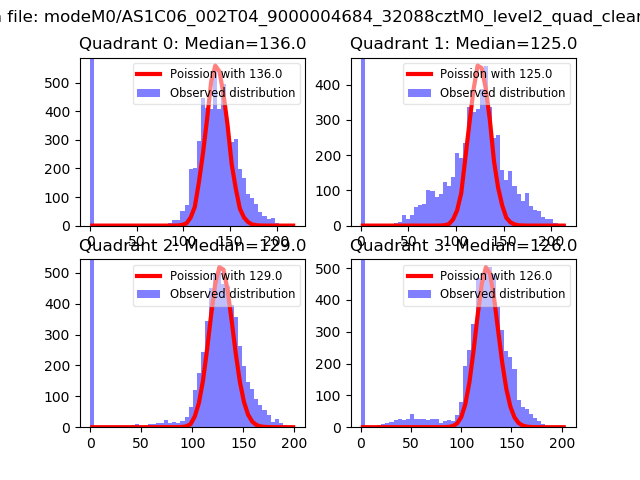 |
 |
| Quadrant-wise count rates Data is divided into 100 sec bins |
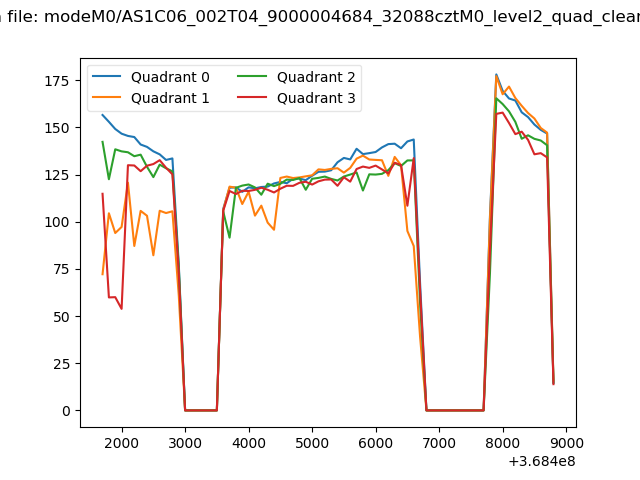 |
|
| Module-wise count rates for Quadrant A Data is divided into 100 sec bins |
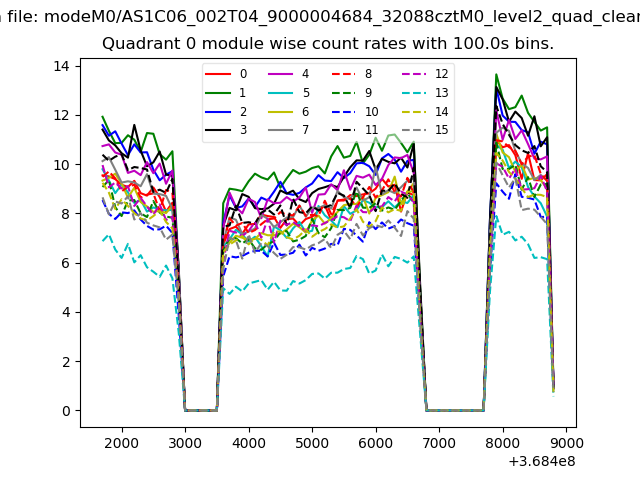 |
 |
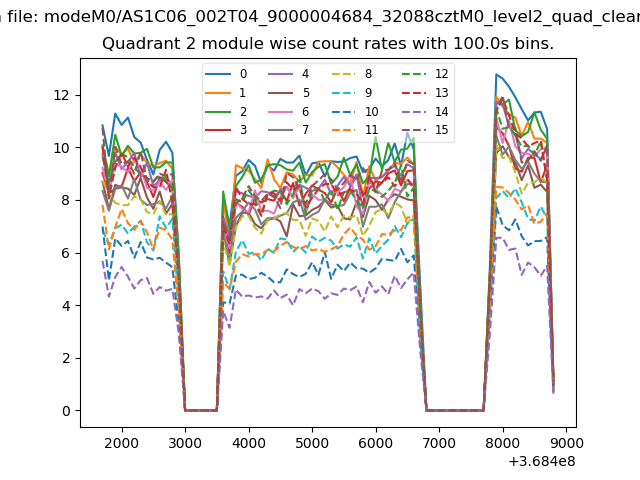
| Module-wise count rates for Quadrant B Data is divided into 100 sec bins |
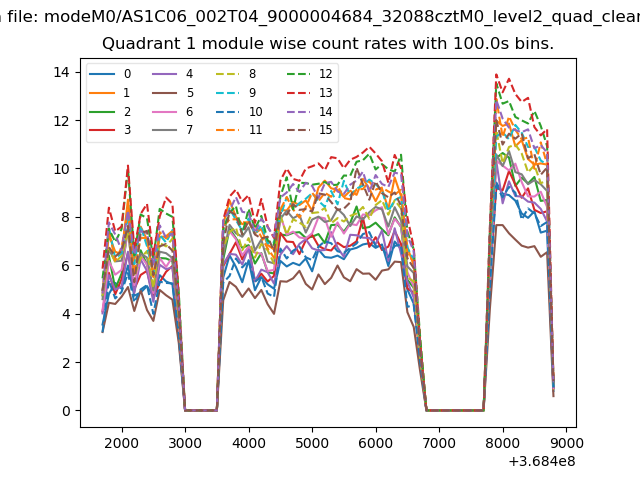 |
 |
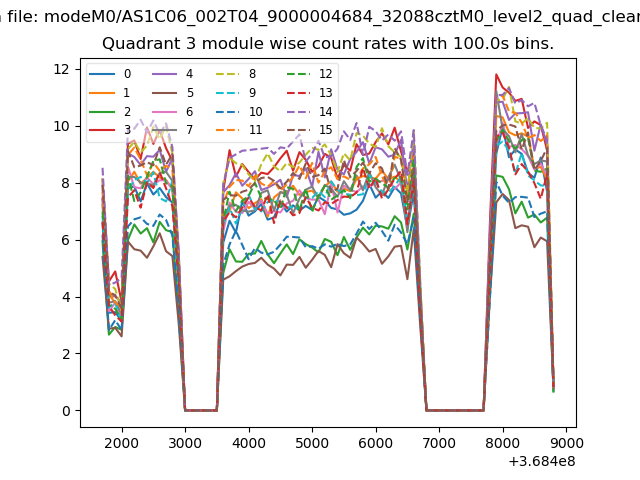
| Module-wise count rates for Quadrant C Data is divided into 100 sec bins |
 |
 |
| Module-wise count rates for Quadrant D Data is divided into 100 sec bins |
 |
 |
| Parameter | Plot |
|---|---|
| CZT HV Monitor |  |
| D_VDD | 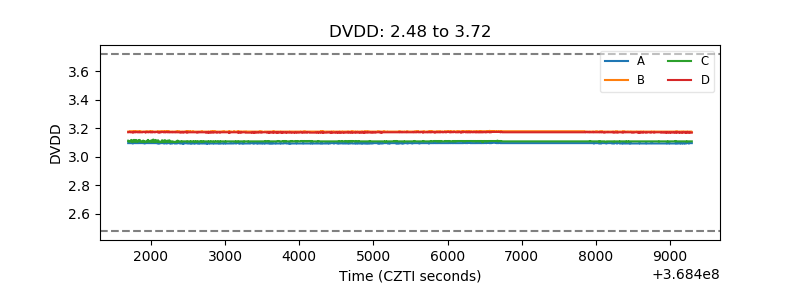 |
| Temperature 1 | 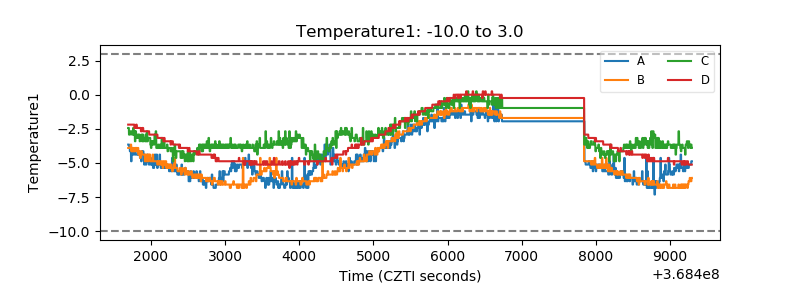 |
| Veto HV Monitor | 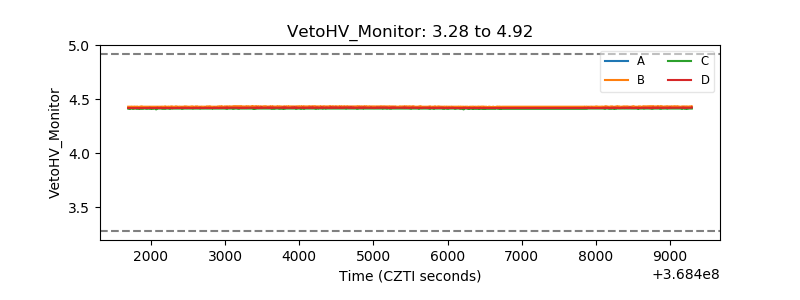 |
| Veto LLD |  |
| Alpha Counter | 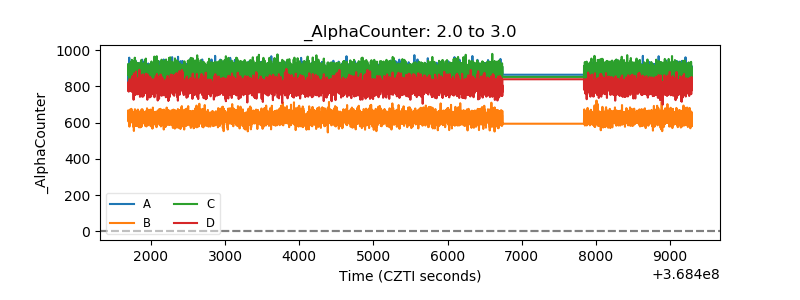 |
| _CPM_Rate | 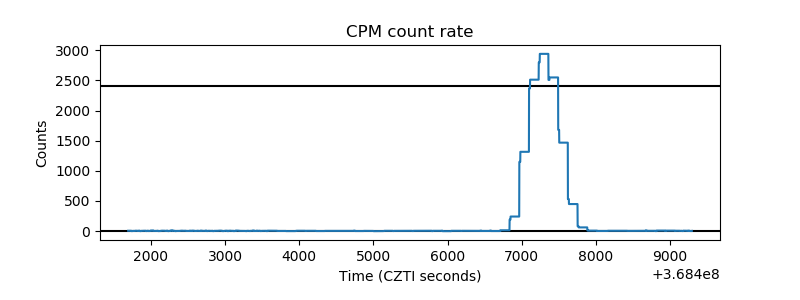 |
| CZT Counter | 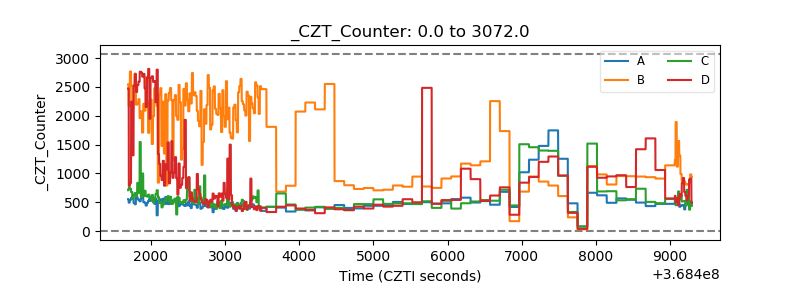 |
| +2.5 Volts monitor |  |
| +5 Volts monitor |  |
| _ROLL_ROT | 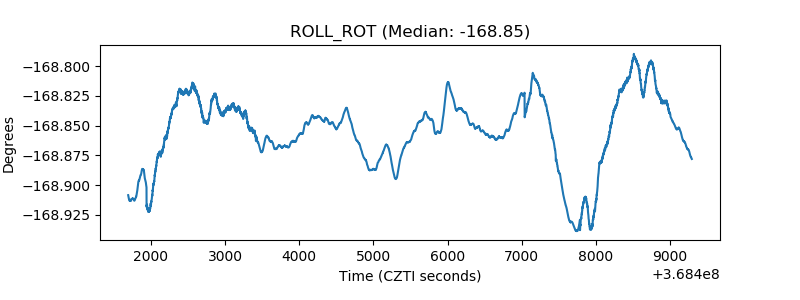 |
| _Roll_DEC | 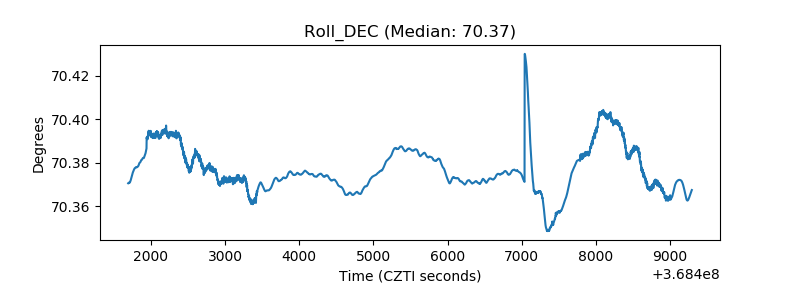 |
| _Roll_RA | 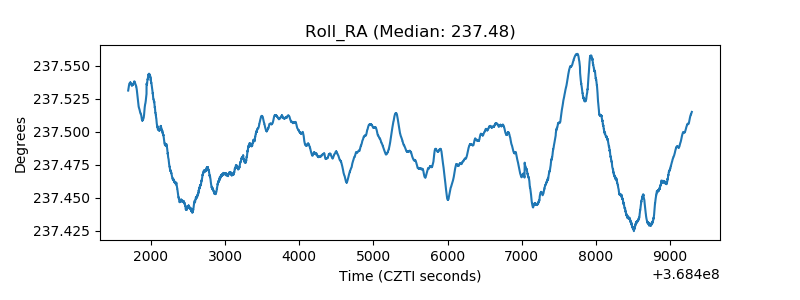 |
| Veto Counter | 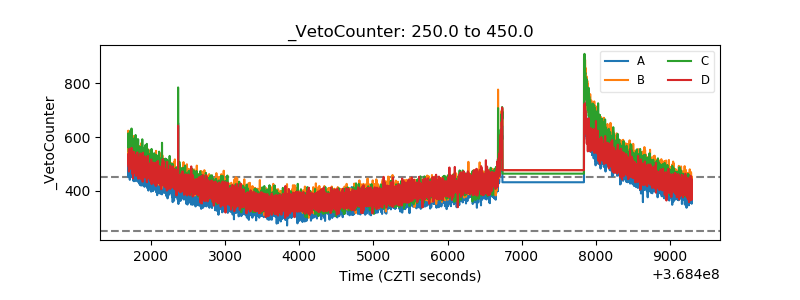 |