| Param | Original file | Final file |
|---|---|---|
| Filename | modeM0/AS1T04_051T01_9000004686cztM0_level2.fits | modeM0/AS1T04_051T01_9000004686cztM0_level2_quad_clean.evt |
| Size (bytes) | 2,621,111,040 | 2,101,789,440 |
| Size | 2.4 GB | 2.0 GB |
| Events in quadrant A | 16,774,800 | 12,494,977 |
| Events in quadrant B | 14,906,842 | 11,136,442 |
| Events in quadrant C | 16,085,608 | 11,898,344 |
| Events in quadrant D | 13,789,788 | 10,313,772 |
| Mode M9 | |||
|---|---|---|---|
| Quadrant | BADHDUFLAG | Total packets | Discarded packets |
| A | 0 | 419 | 0 |
| B | 0 | 419 | 0 |
| C | 0 | 419 | 0 |
| D | 0 | 419 | 0 |
| Mode M0 | |||
|---|---|---|---|
| Quadrant | BADHDUFLAG | Total packets | Discarded packets |
| A | 0 | 543434 | 0 |
| B | 0 | 997019 | 0 |
| C | 0 | 595193 | 0 |
| D | 0 | 866788 | 0 |
| Mode SS | |||
|---|---|---|---|
| Quadrant | BADHDUFLAG | Total packets | Discarded packets |
| A | 0 | 5418 | 0 |
| B | 0 | 5338 | 0 |
| C | 0 | 5330 | 0 |
| D | 0 | 5334 | 0 |
| Quadrant | Total seconds | Saturated seconds | Saturation percentage |
|---|---|---|---|
| A | 259778 | 2804 | 1.079383% |
| B | 259536 | 31170 | 12.009895% |
| C | 259767 | 10493 | 4.039389% |
| D | 259607 | 19112 | 7.361897% |
Noise dominated data is calculated using 1-second bins in cleaned event files. If a bin has >2000 counts, and if more than 50% of those come from <1% of pixels, then it is considered to be noise-dominated and hence unusable.
| Quadrant | # 1 sec bins | Bins with >0 counts | Bins with >2000 counts | High rate bins dominated by noise | Noise dominated (total time) | Noise dominated (detector-on time) | Marked lightcurve |
|---|---|---|---|---|---|---|---|
| A | 336485 | 260038 | 0 | 0 | 0.00% | 0.00% |  |
| B | 336485 | 259706 | 0 | 0 | 0.00% | 0.00% |  |
| C | 336485 | 259922 | 0 | 0 | 0.00% | 0.00% |  |
| D | 336485 | 259758 | 0 | 0 | 0.00% | 0.00% |  |
Top three noisy pixels from each quadrant. If the there are fewer than three noisy pixels in the level2.evt file, extra rows are filled as -1
| Pixel properties | Quadrant properties | ||||||
|---|---|---|---|---|---|---|---|
| Quadrant | DetID | PixID | Counts | Sigma | Mean | Median | Sigma |
| A | 0 | 29 | 16348 | 11.65 | 4374 | 4127 | 1049.5 |
| A | 7 | 110 | 13141 | 8.59 | 4374 | 4127 | 1049.5 |
| A | 0 | 30 | 12963 | 8.42 | 4374 | 4127 | 1049.5 |
| B | 2 | 9 | 11937 | 10.78 | 3950 | 3790 | 755.6 |
| B | 2 | 8 | 10068 | 8.31 | 3950 | 3790 | 755.6 |
| B | 3 | 80 | 9833 | 8.0 | 3950 | 3790 | 755.6 |
| C | 3 | 187 | 11001 | 6.63 | 4269 | 4028 | 1051.9 |
| C | 12 | 241 | 10998 | 6.63 | 4269 | 4028 | 1051.9 |
| C | 9 | 209 | 10975 | 6.6 | 4269 | 4028 | 1051.9 |
| D | 10 | 189 | 9997 | 6.24 | 3949 | 3610 | 1023.0 |
| D | 6 | 67 | 9782 | 6.03 | 3949 | 3610 | 1023.0 |
| D | 7 | 3 | 9672 | 5.93 | 3949 | 3610 | 1023.0 |
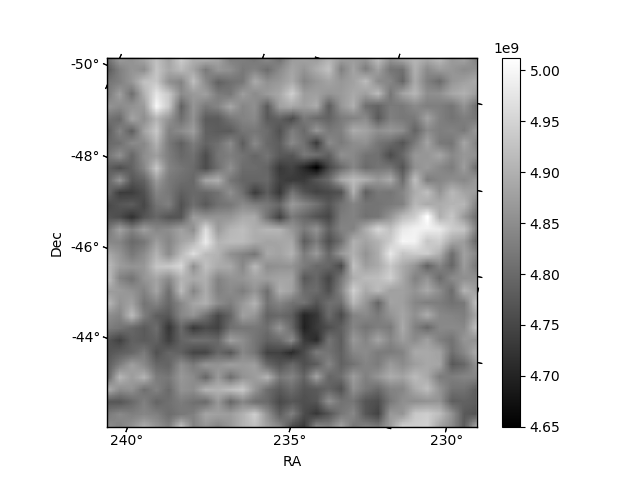
Histogram calculated using DETX and DETY for each event in the final _common_clean file
| Quadrant A |  |
 |
Quadrant B |
|---|---|---|---|
| Quadrant D |  |
 |
Quadrant C |
| Plot type | Count rate plots | Images |
|---|---|---|
| Comparison with Poisson distribution Blue bars denote a histogram of data divided into 1 sec bins. Red curve is a Poisson curve with rate = median count rate of data. |
 |
 |
| Quadrant-wise count rates Data is divided into 100 sec bins |
 |
|
| Module-wise count rates for Quadrant A Data is divided into 100 sec bins |
 |
 |
| Module-wise count rates for Quadrant B Data is divided into 100 sec bins |
 |
 |
| Module-wise count rates for Quadrant C Data is divided into 100 sec bins |
 |
 |
| Module-wise count rates for Quadrant D Data is divided into 100 sec bins |
 |
 |
| Parameter | Plot |
|---|---|
| CZT HV Monitor |  |
| D_VDD | 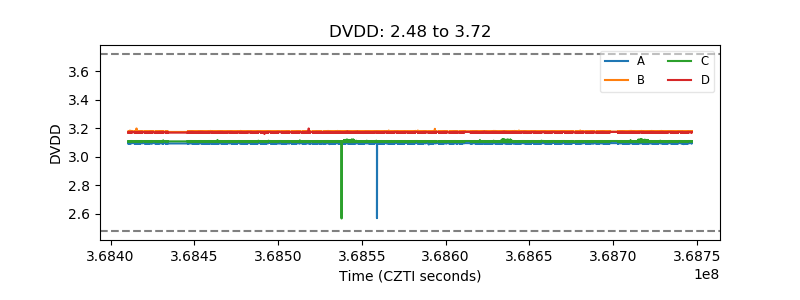 |
| Temperature 1 |  |
| Veto HV Monitor |  |
| Veto LLD |  |
| Alpha Counter |  |
| _CPM_Rate |  |
| CZT Counter |  |
| +2.5 Volts monitor |  |
| +5 Volts monitor |  |
| _ROLL_ROT |  |
| _Roll_DEC |  |
| _Roll_RA |  |
| Veto Counter |  |