| Param | Original file | Final file |
|---|---|---|
| Filename | modeM0/AS1T04_051T01_9000004686_32089cztM0_level2.evt | modeM0/AS1T04_051T01_9000004686_32089cztM0_level2_quad_clean.evt |
| Size (bytes) | 468,714,240 | 55,872,000 |
| Size | 447.0 MB | 53.3 MB |
| Events in quadrant A | 2,074,652 | 378,575 |
| Events in quadrant B | 4,644,353 | 350,883 |
| Events in quadrant C | 2,402,986 | 356,084 |
| Events in quadrant D | 4,804,149 | 325,612 |
| Mode M9 | |||
|---|---|---|---|
| Quadrant | BADHDUFLAG | Total packets | Discarded packets |
| A | 0 | 12 | 0 |
| B | 0 | 12 | 0 |
| C | 0 | 12 | 0 |
| D | 0 | 12 | 0 |
| Mode M0 | |||
|---|---|---|---|
| Quadrant | BADHDUFLAG | Total packets | Discarded packets |
| A | 0 | 8469 | 1 |
| B | 0 | 16462 | 2 |
| C | 0 | 9644 | 1 |
| D | 0 | 17038 | 1 |
| Mode SS | |||
|---|---|---|---|
| Quadrant | BADHDUFLAG | Total packets | Discarded packets |
| A | 0 | 82 | 0 |
| B | 0 | 82 | 0 |
| C | 0 | 82 | 0 |
| D | 0 | 82 | 0 |
| Quadrant | Total seconds | Saturated seconds | Saturation percentage |
|---|---|---|---|
| A | 3965 | 30 | 0.756620% |
| B | 3964 | 607 | 15.312815% |
| C | 3964 | 327 | 8.249243% |
| D | 3964 | 652 | 16.448032% |
Noise dominated data is calculated using 1-second bins in cleaned event files. If a bin has >2000 counts, and if more than 50% of those come from <1% of pixels, then it is considered to be noise-dominated and hence unusable.
| Quadrant | # 1 sec bins | Bins with >0 counts | Bins with >2000 counts | High rate bins dominated by noise | Noise dominated (total time) | Noise dominated (detector-on time) | Marked lightcurve |
|---|---|---|---|---|---|---|---|
| A | 5190 | 3965 | 0 | 0 | 0.00% | 0.00% | 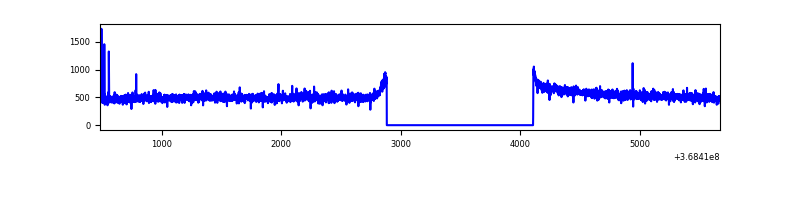 |
| B | 5189 | 3964 | 353 | 353 | 6.80% | 8.91% | 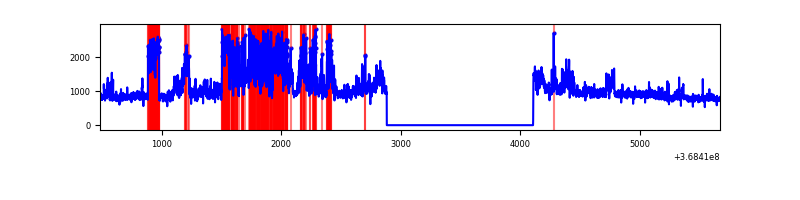 |
| C | 5189 | 3964 | 17 | 17 | 0.33% | 0.43% | 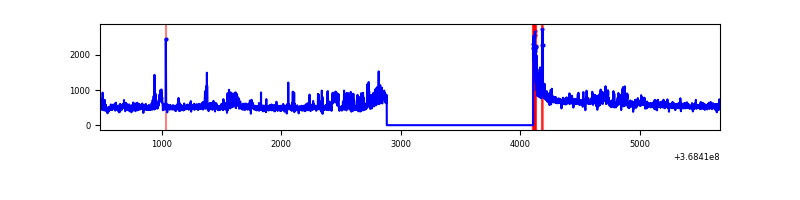 |
| D | 5189 | 3964 | 640 | 640 | 12.33% | 16.15% | 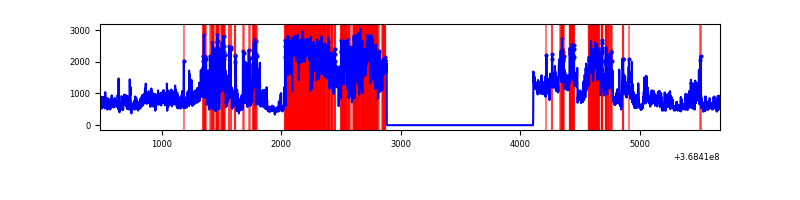 |
Top three noisy pixels from each quadrant. If the there are fewer than three noisy pixels in the level2.evt file, extra rows are filled as -1
| Pixel properties | Quadrant properties | ||||||
|---|---|---|---|---|---|---|---|
| Quadrant | DetID | PixID | Counts | Sigma | Mean | Median | Sigma |
| A | 13 | 254 | 7395 | 64.55 | 535 | 527 | 106.4 |
| A | 0 | 230 | 6960 | 60.46 | 535 | 527 | 106.4 |
| A | 0 | 226 | 5085 | 42.84 | 535 | 527 | 106.4 |
| B | 10 | 245 | 1449862 | 15052.38 | 510 | 498 | 96.3 |
| B | 6 | 159 | 1050801 | 10907.93 | 510 | 498 | 96.3 |
| B | 5 | 172 | 112331 | 1161.44 | 510 | 498 | 96.3 |
| C | 14 | 238 | 158809 | 1374.93 | 499 | 504 | 115.1 |
| C | 14 | 254 | 106701 | 922.35 | 499 | 504 | 115.1 |
| C | 0 | 10 | 90167 | 778.75 | 499 | 504 | 115.1 |
| D | 12 | 227 | 2296264 | 19657.95 | 492 | 479 | 116.8 |
| D | 8 | 195 | 446423 | 3818.45 | 492 | 479 | 116.8 |
| D | 12 | 233 | 78044 | 664.16 | 492 | 479 | 116.8 |
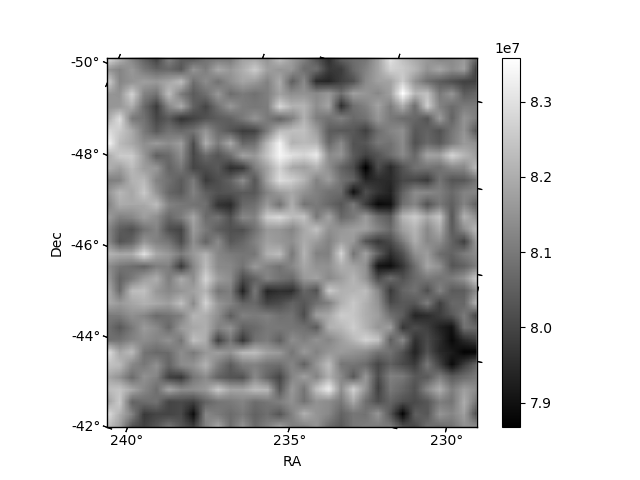
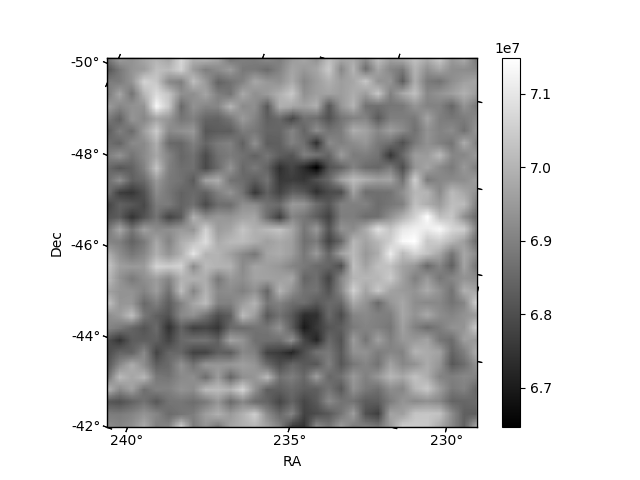
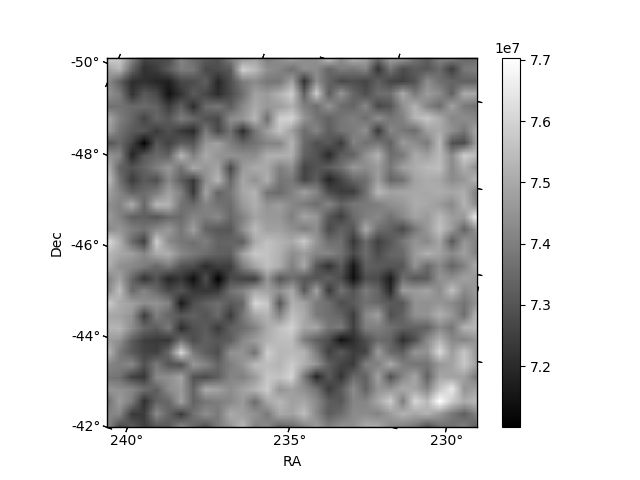
Histogram calculated using DETX and DETY for each event in the final _common_clean file
| Quadrant A | 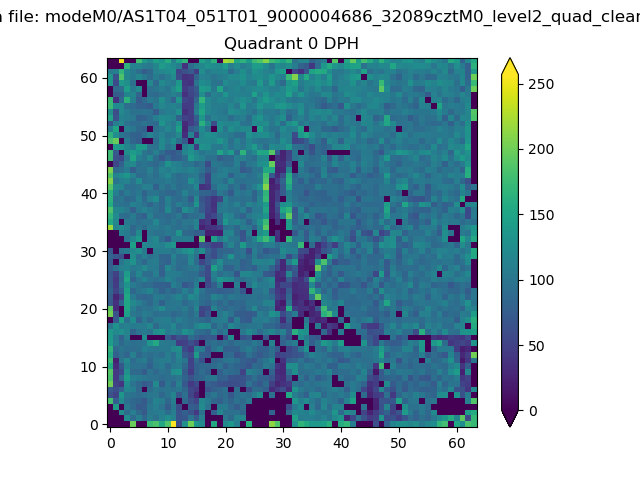 |
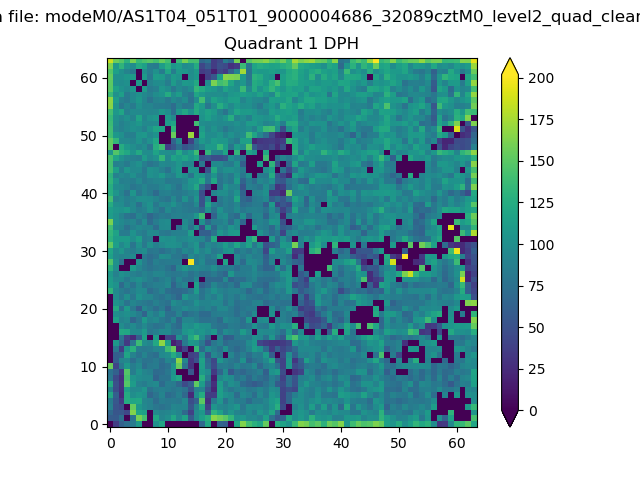 |
Quadrant B |
|---|---|---|---|
| Quadrant D | 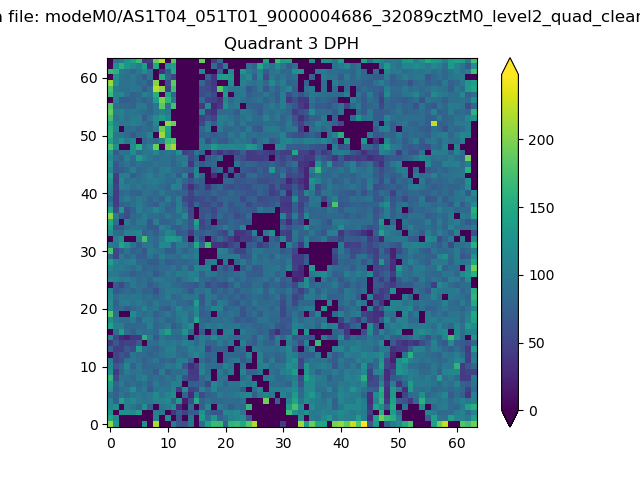 |
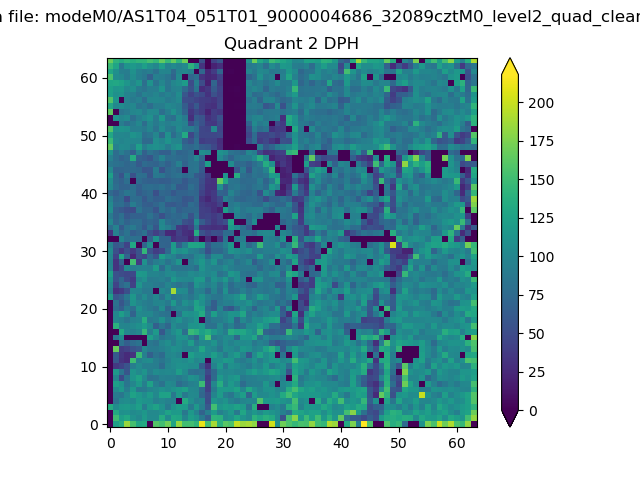 |
Quadrant C |
| Plot type | Count rate plots | Images |
|---|---|---|
| Comparison with Poisson distribution Blue bars denote a histogram of data divided into 1 sec bins. Red curve is a Poisson curve with rate = median count rate of data. |
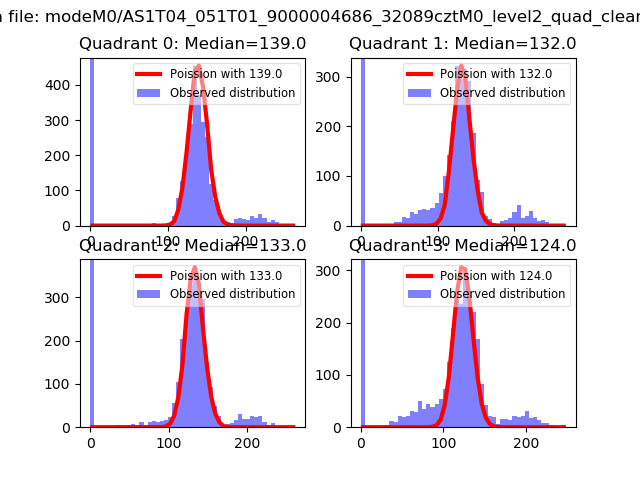 |
 |
| Quadrant-wise count rates Data is divided into 100 sec bins |
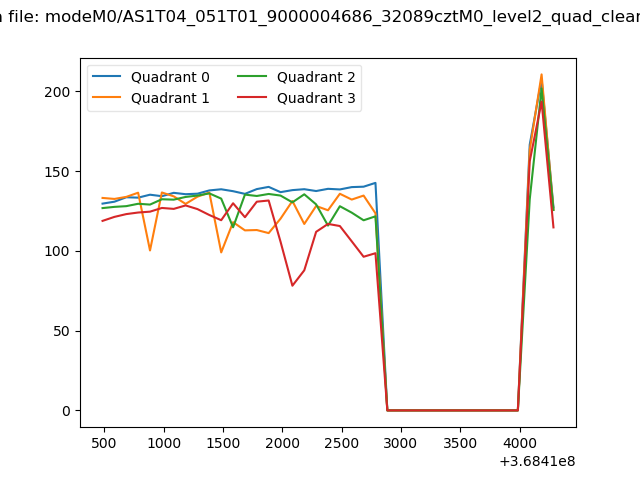 |
|
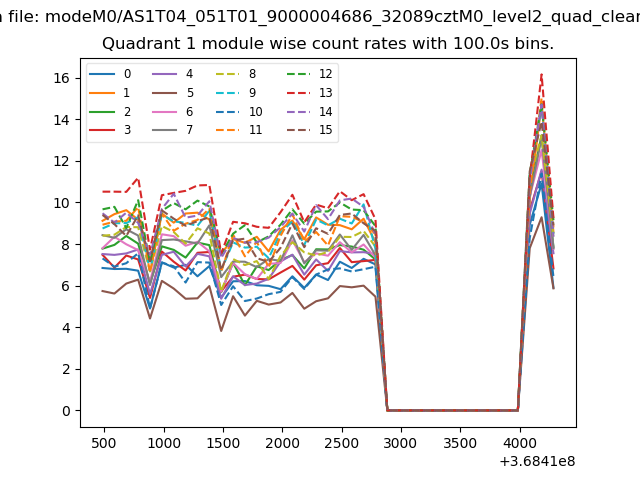
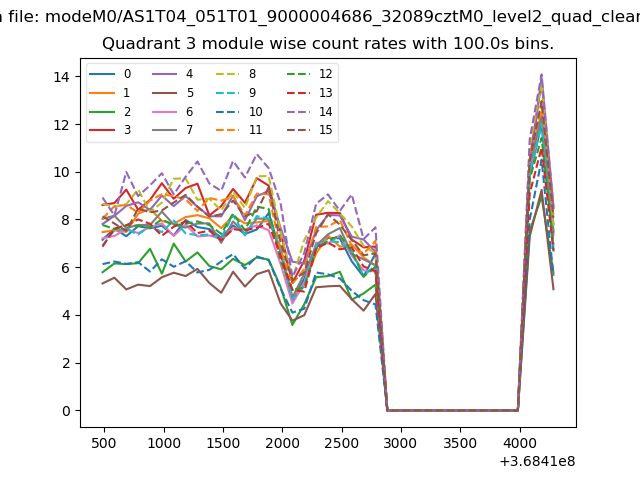
| Module-wise count rates for Quadrant A Data is divided into 100 sec bins |
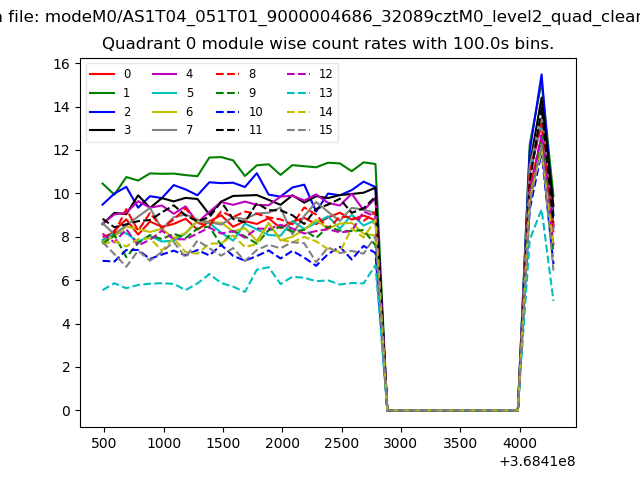 |
 |
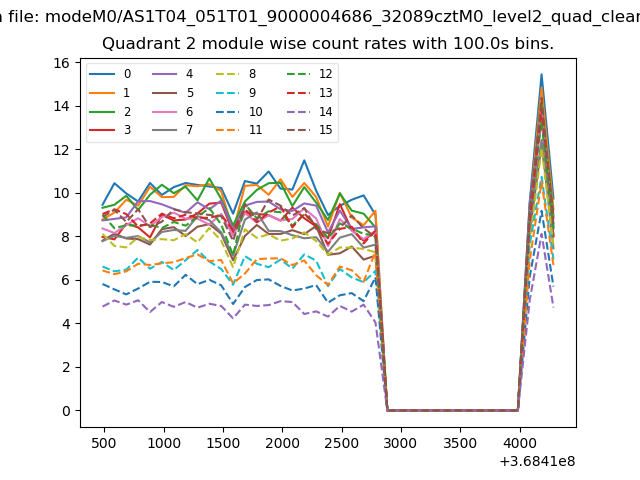
| Module-wise count rates for Quadrant B Data is divided into 100 sec bins |
 |
 |
| Module-wise count rates for Quadrant C Data is divided into 100 sec bins |
 |
 |
| Module-wise count rates for Quadrant D Data is divided into 100 sec bins |
 |
 |
| Parameter | Plot |
|---|---|
| CZT HV Monitor | 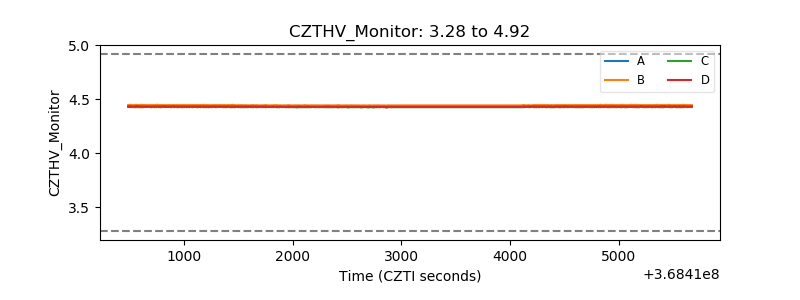 |
| D_VDD | 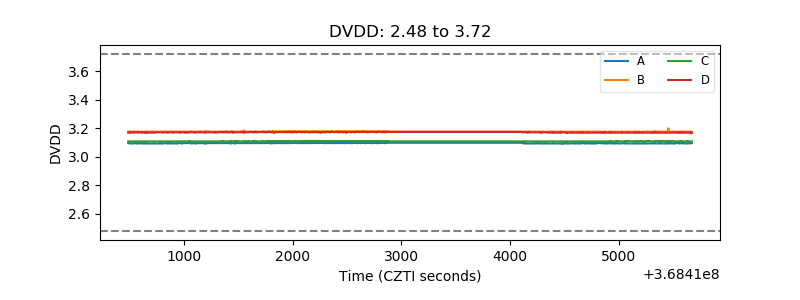 |
| Temperature 1 | 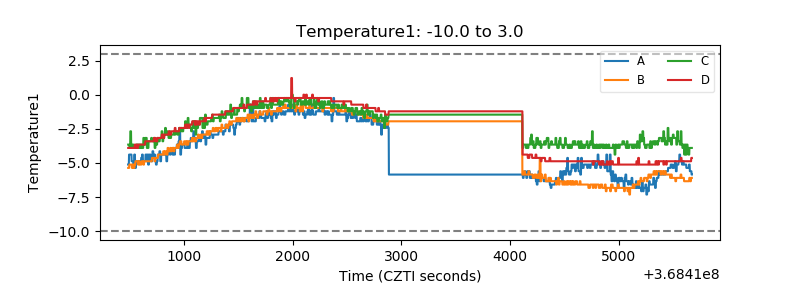 |
| Veto HV Monitor | 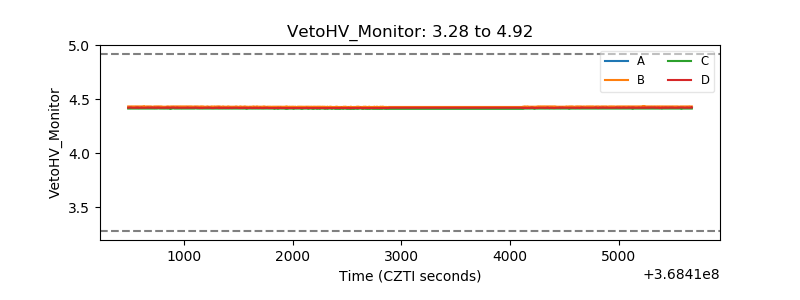 |
| Veto LLD |  |
| Alpha Counter | 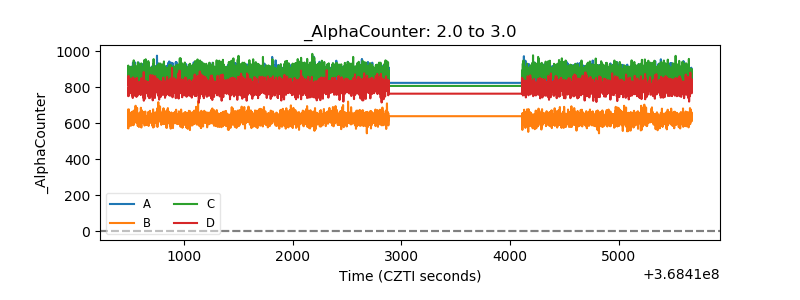 |
| _CPM_Rate | 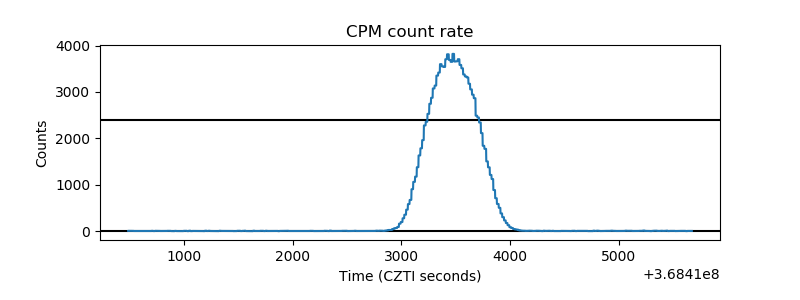 |
| CZT Counter | 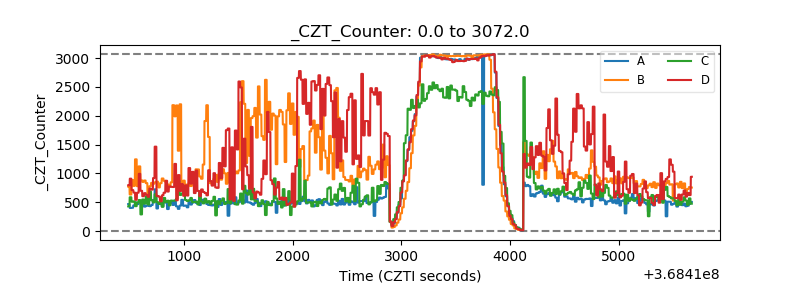 |
| +2.5 Volts monitor |  |
| +5 Volts monitor | 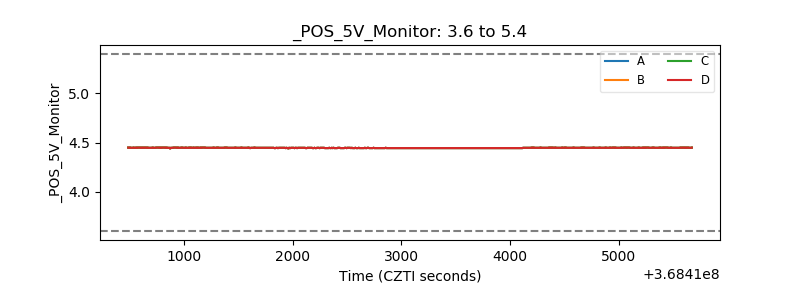 |
| _ROLL_ROT | 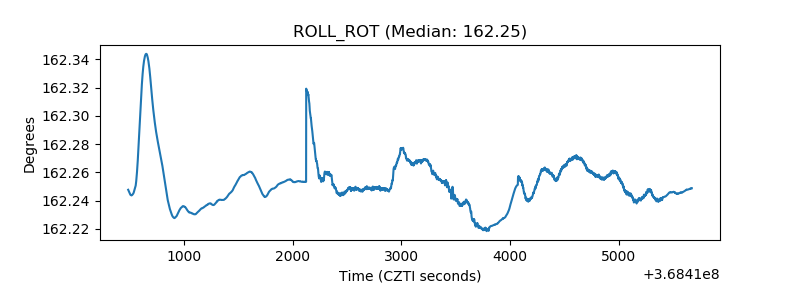 |
| _Roll_DEC | 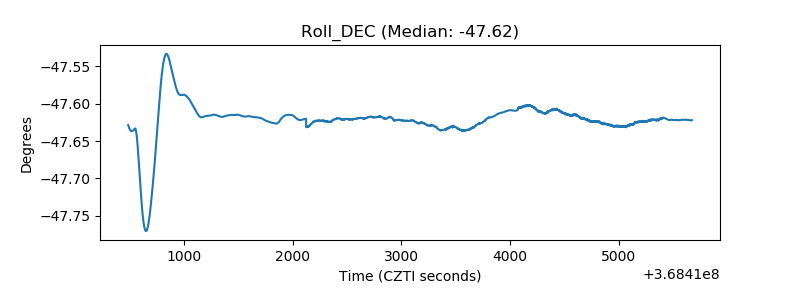 |
| _Roll_RA | 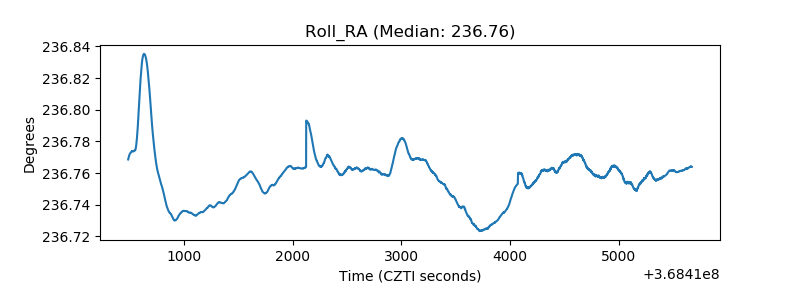 |
| Veto Counter | 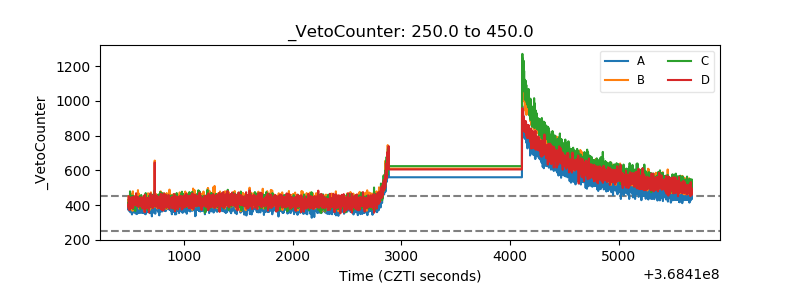 |