| Param | Original file | Final file |
|---|---|---|
| Filename | modeM0/AS1T04_051T01_9000004686_32090cztM0_level2.evt | modeM0/AS1T04_051T01_9000004686_32090cztM0_level2_quad_clean.evt |
| Size (bytes) | 731,652,480 | 71,118,720 |
| Size | 697.8 MB | 67.8 MB |
| Events in quadrant A | 3,478,544 | 449,435 |
| Events in quadrant B | 7,025,515 | 423,072 |
| Events in quadrant C | 3,913,478 | 438,343 |
| Events in quadrant D | 7,306,748 | 392,751 |
| Mode M9 | |||
|---|---|---|---|
| Quadrant | BADHDUFLAG | Total packets | Discarded packets |
| A | 0 | 14 | 0 |
| B | 0 | 15 | 0 |
| C | 0 | 15 | 0 |
| D | 0 | 15 | 0 |
| Mode M0 | |||
|---|---|---|---|
| Quadrant | BADHDUFLAG | Total packets | Discarded packets |
| A | 0 | 14134 | 2 |
| B | 0 | 25239 | 2 |
| C | 0 | 15714 | 2 |
| D | 0 | 26240 | 2 |
| Mode SS | |||
|---|---|---|---|
| Quadrant | BADHDUFLAG | Total packets | Discarded packets |
| A | 0 | 130 | 0 |
| B | 0 | 130 | 0 |
| C | 0 | 130 | 0 |
| D | 0 | 130 | 0 |
| Quadrant | Total seconds | Saturated seconds | Saturation percentage |
|---|---|---|---|
| A | 6444 | 38 | 0.589696% |
| B | 6443 | 693 | 10.755859% |
| C | 6443 | 257 | 3.988825% |
| D | 6443 | 673 | 10.445445% |
Noise dominated data is calculated using 1-second bins in cleaned event files. If a bin has >2000 counts, and if more than 50% of those come from <1% of pixels, then it is considered to be noise-dominated and hence unusable.
| Quadrant | # 1 sec bins | Bins with >0 counts | Bins with >2000 counts | High rate bins dominated by noise | Noise dominated (total time) | Noise dominated (detector-on time) | Marked lightcurve |
|---|---|---|---|---|---|---|---|
| A | 7764 | 6444 | 0 | 0 | 0.00% | 0.00% | 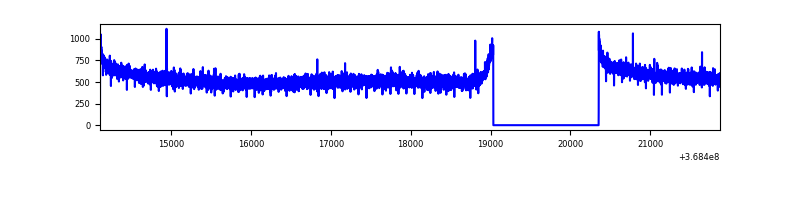 |
| B | 7763 | 6443 | 444 | 444 | 5.72% | 6.89% | 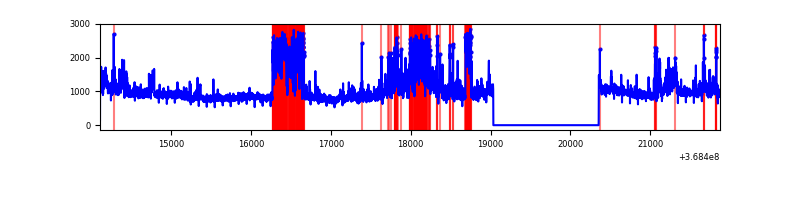 |
| C | 7762 | 6442 | 29 | 29 | 0.37% | 0.45% | 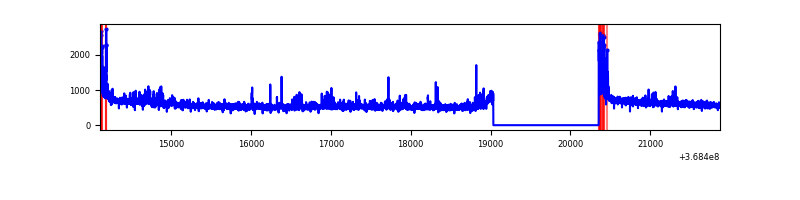 |
| D | 7763 | 6443 | 658 | 658 | 8.48% | 10.21% | 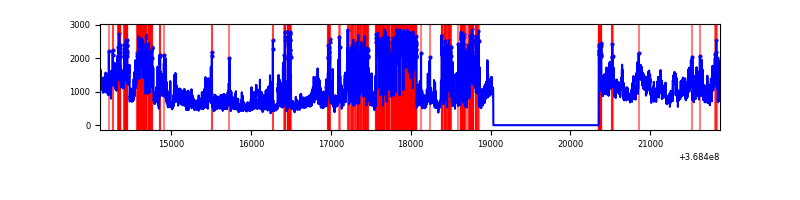 |
Top three noisy pixels from each quadrant. If the there are fewer than three noisy pixels in the level2.evt file, extra rows are filled as -1
| Pixel properties | Quadrant properties | ||||||
|---|---|---|---|---|---|---|---|
| Quadrant | DetID | PixID | Counts | Sigma | Mean | Median | Sigma |
| A | 13 | 254 | 11951 | 62.76 | 900 | 887 | 176.3 |
| A | 13 | 6 | 8926 | 45.6 | 900 | 887 | 176.3 |
| A | 3 | 137 | 8166 | 41.29 | 900 | 887 | 176.3 |
| B | 6 | 159 | 1757764 | 10939.83 | 875 | 855 | 160.6 |
| B | 10 | 245 | 1551453 | 9655.18 | 875 | 855 | 160.6 |
| B | 5 | 172 | 225093 | 1396.27 | 875 | 855 | 160.6 |
| C | 14 | 238 | 191675 | 969.86 | 867 | 875 | 196.7 |
| C | 0 | 10 | 174721 | 883.68 | 867 | 875 | 196.7 |
| C | 14 | 254 | 65839 | 330.22 | 867 | 875 | 196.7 |
| D | 12 | 227 | 2836071 | 14345.73 | 850 | 830 | 197.6 |
| D | 8 | 195 | 773312 | 3908.6 | 850 | 830 | 197.6 |
| D | 12 | 233 | 336338 | 1697.6 | 850 | 830 | 197.6 |
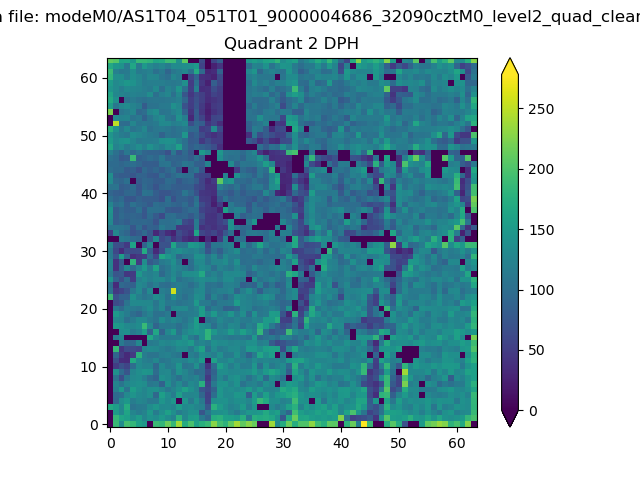
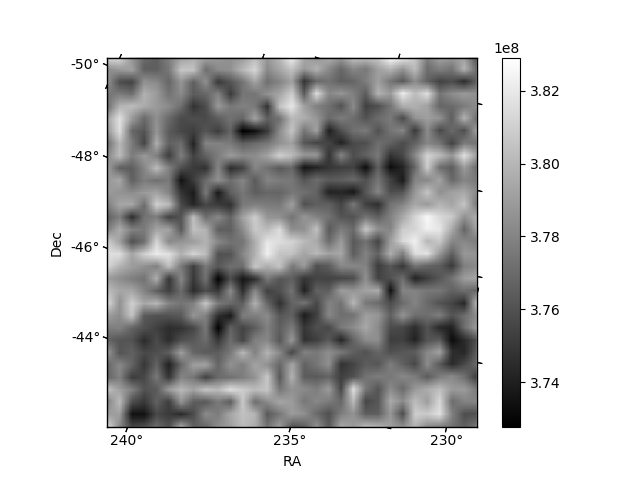
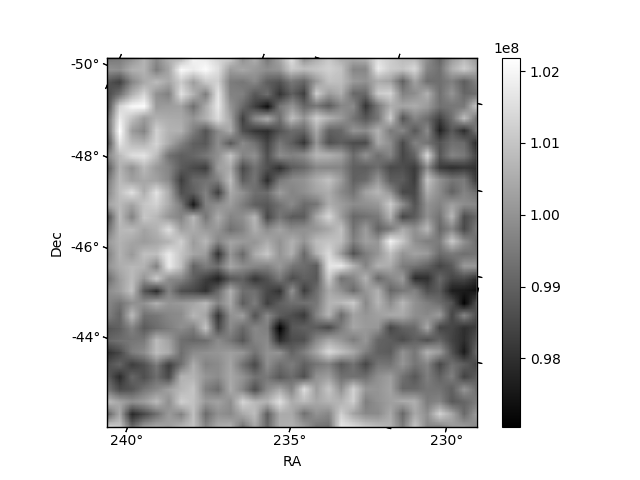
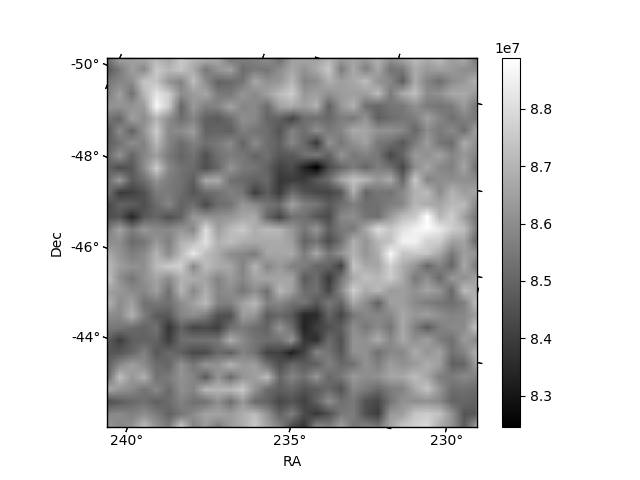
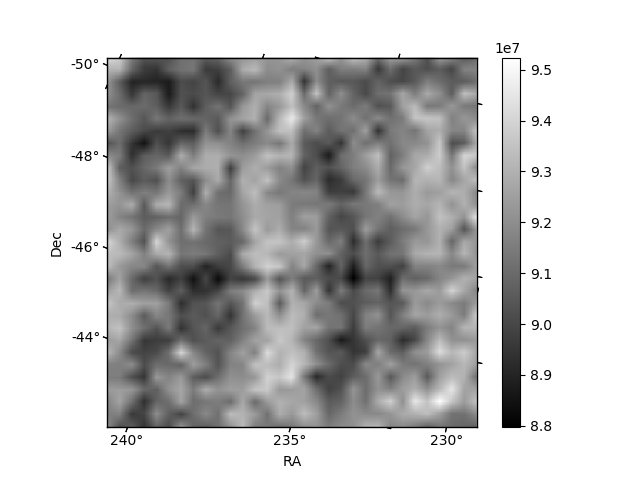
Histogram calculated using DETX and DETY for each event in the final _common_clean file
| Quadrant A | 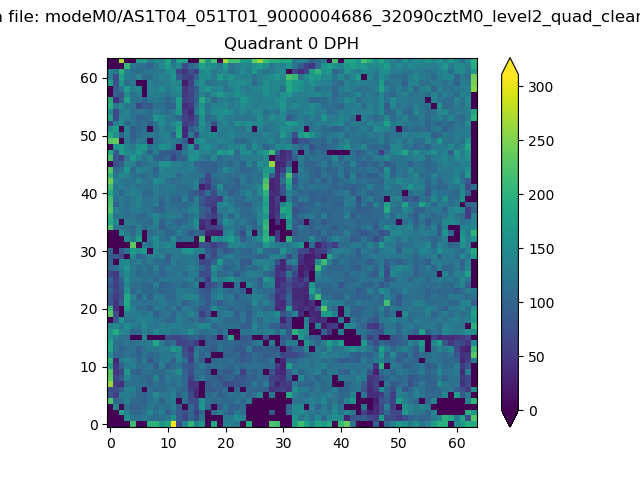 |
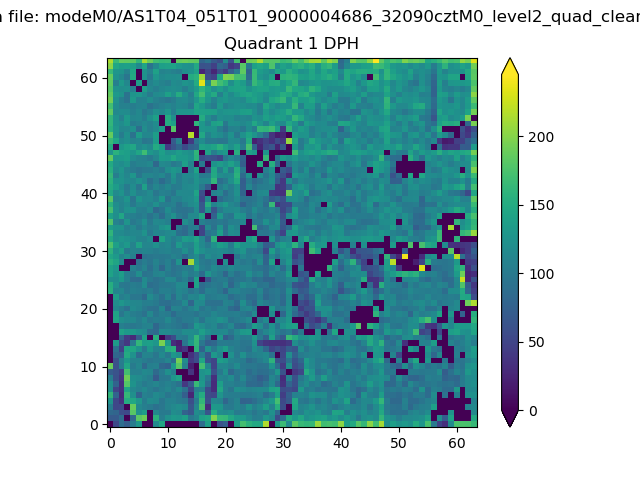 |
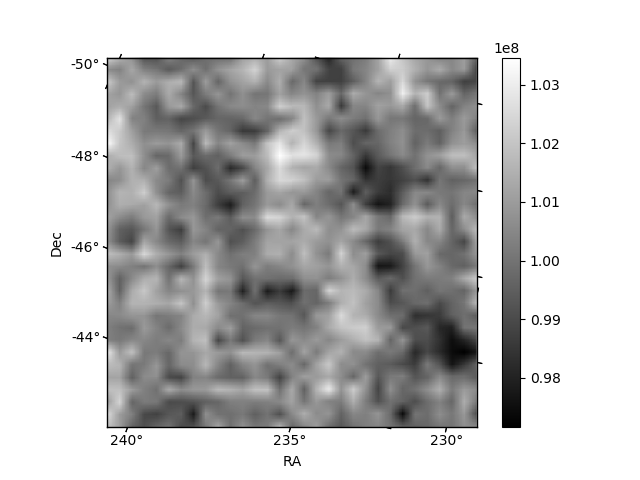
Quadrant B |
|---|---|---|---|
| Quadrant D | 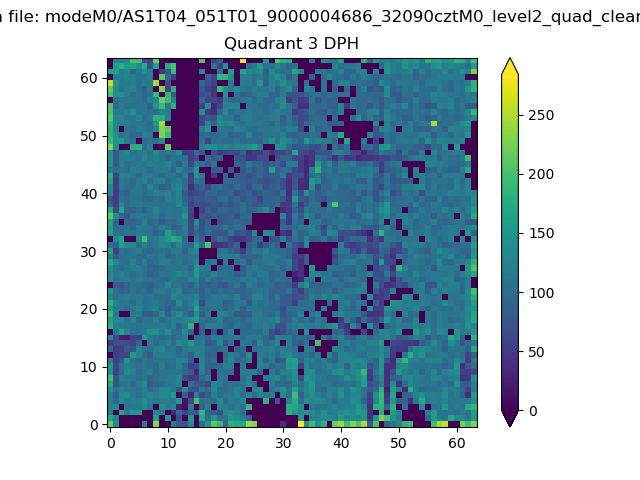 |
 |
Quadrant C |
| Plot type | Count rate plots | Images |
|---|---|---|
| Comparison with Poisson distribution Blue bars denote a histogram of data divided into 1 sec bins. Red curve is a Poisson curve with rate = median count rate of data. |
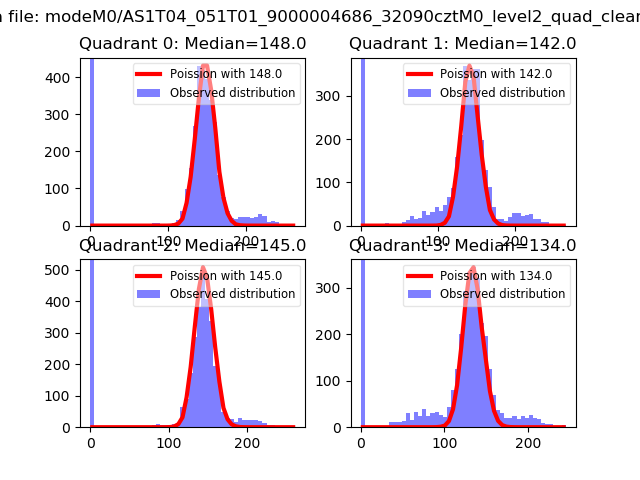 |
 |
| Quadrant-wise count rates Data is divided into 100 sec bins |
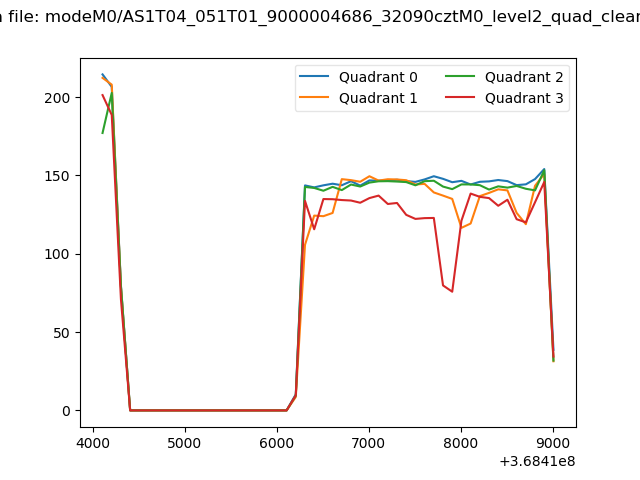 |
|
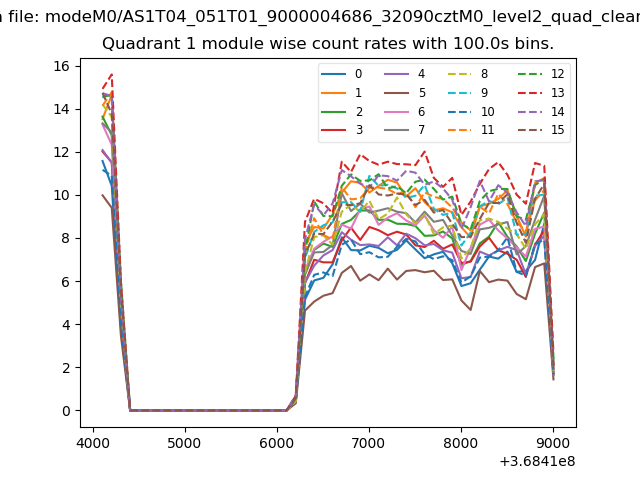
| Module-wise count rates for Quadrant A Data is divided into 100 sec bins |
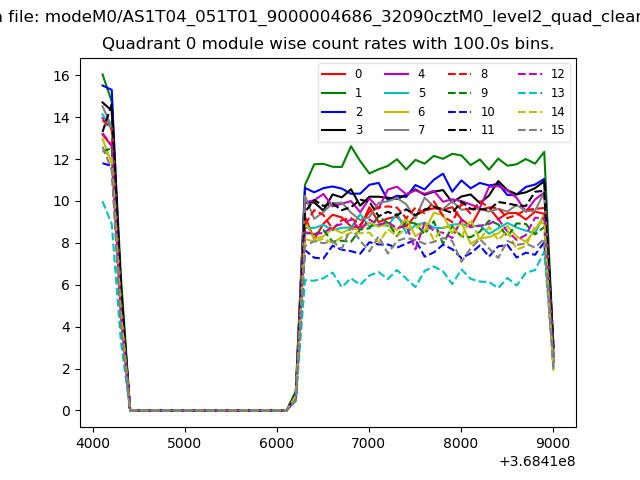 |
 |
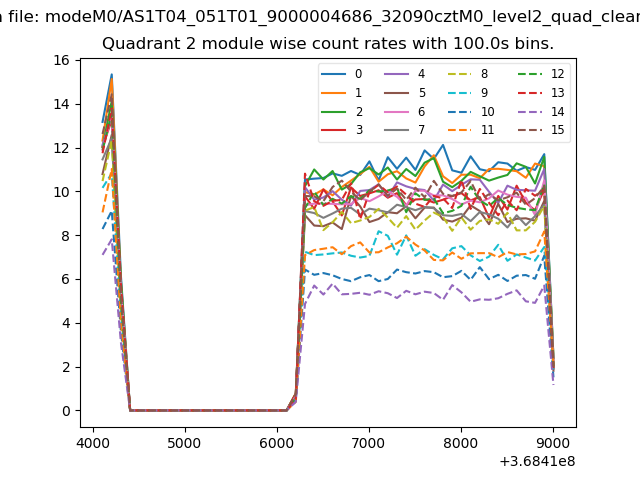
| Module-wise count rates for Quadrant B Data is divided into 100 sec bins |
 |
 |
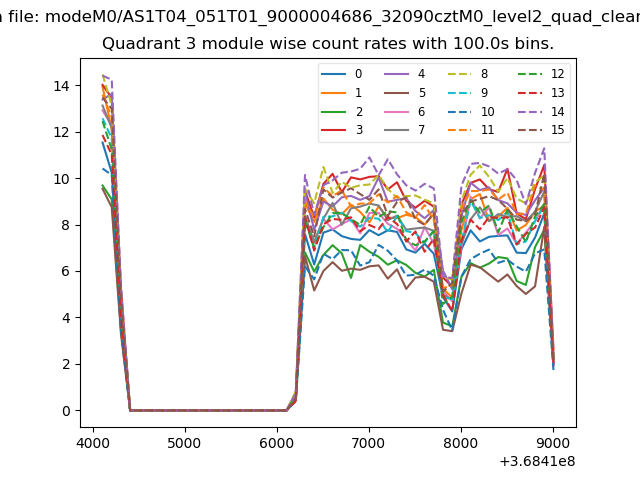
| Module-wise count rates for Quadrant C Data is divided into 100 sec bins |
 |
 |
| Module-wise count rates for Quadrant D Data is divided into 100 sec bins |
 |
 |
| Parameter | Plot |
|---|---|
| CZT HV Monitor | 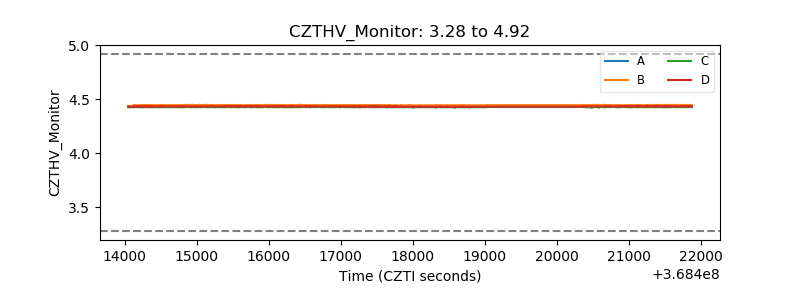 |
| D_VDD | 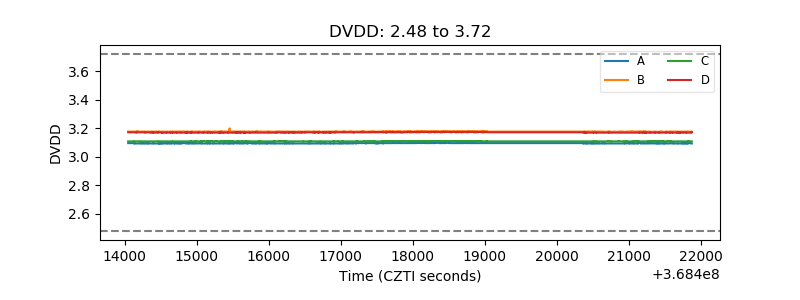 |
| Temperature 1 | 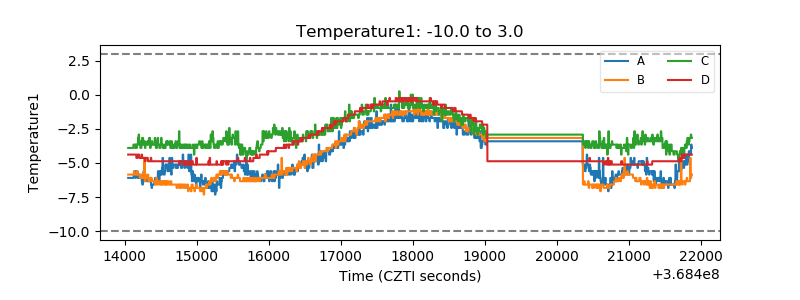 |
| Veto HV Monitor | 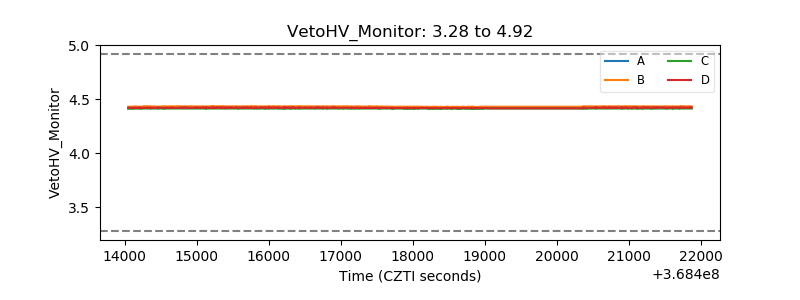 |
| Veto LLD | 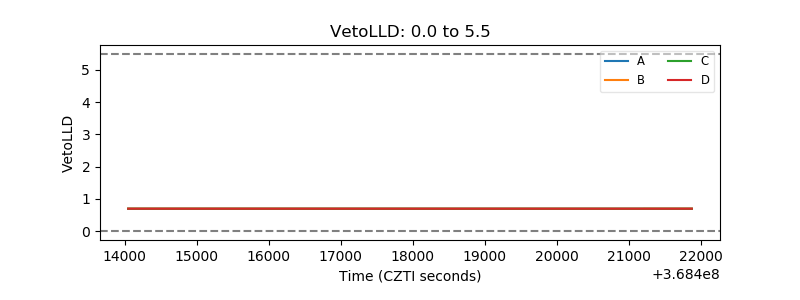 |
| Alpha Counter | 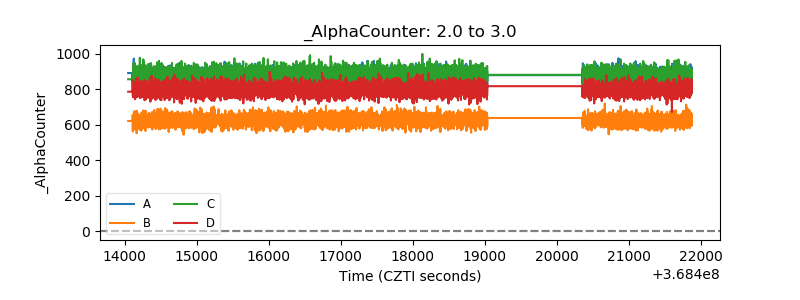 |
| _CPM_Rate | 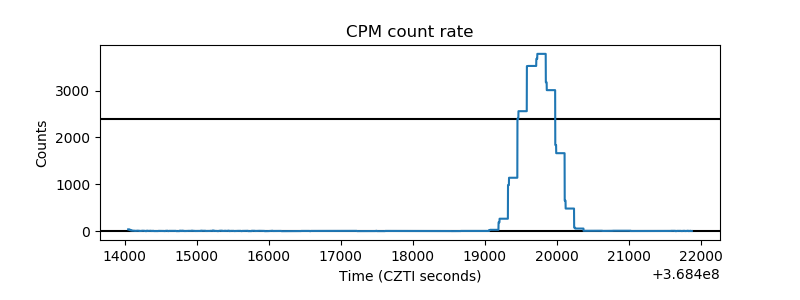 |
| CZT Counter | 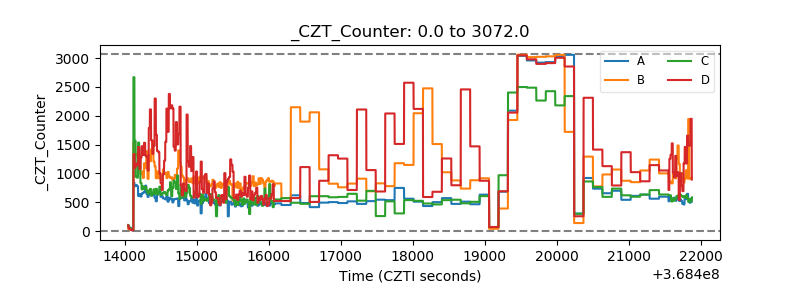 |
| +2.5 Volts monitor | 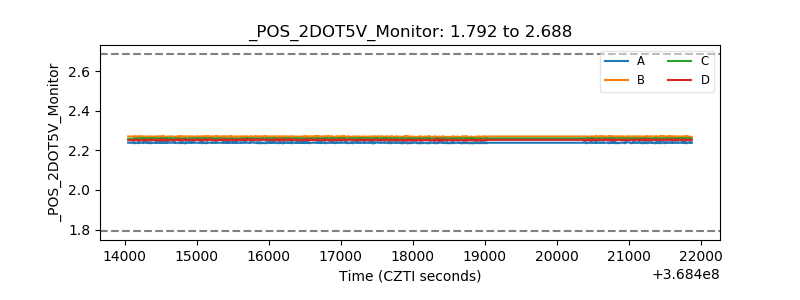 |
| +5 Volts monitor | 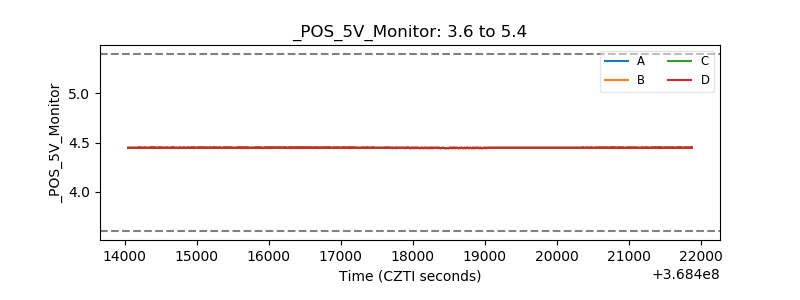 |
| _ROLL_ROT | 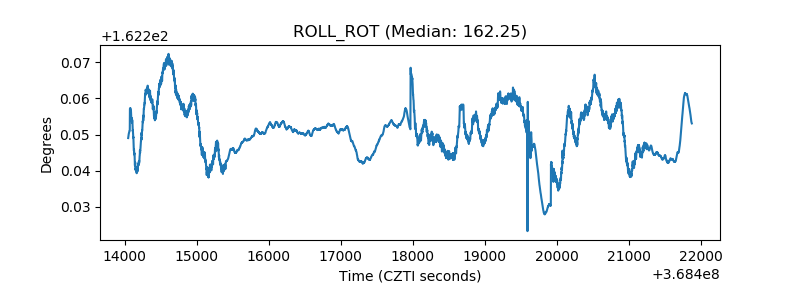 |
| _Roll_DEC | 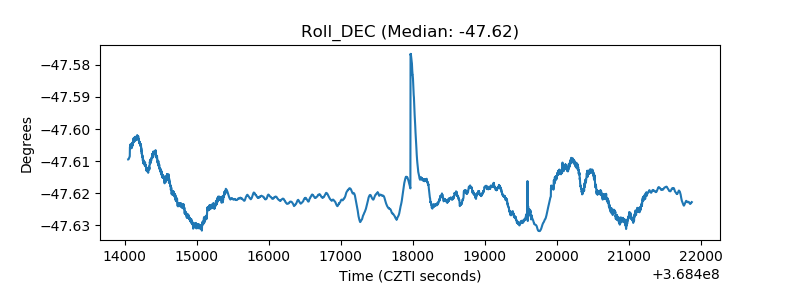 |
| _Roll_RA | 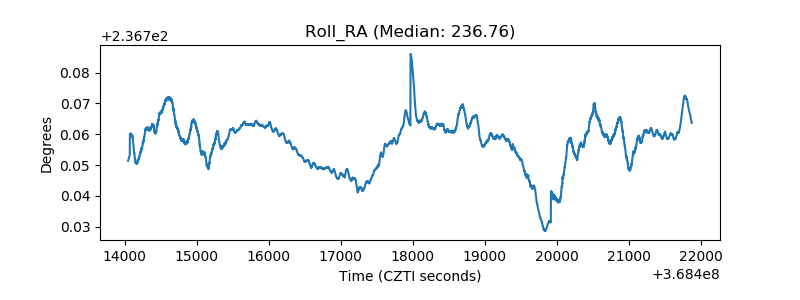 |
| Veto Counter | 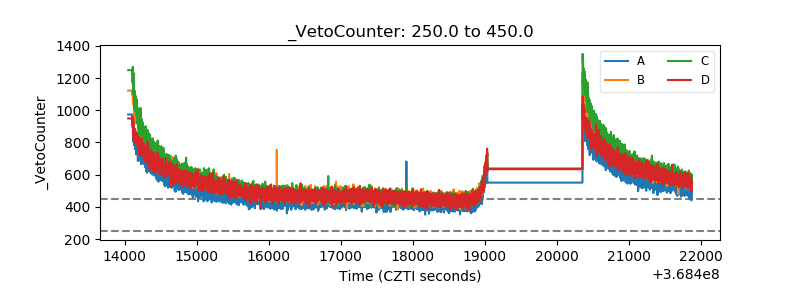 |