| Param | Original file | Final file |
|---|---|---|
| Filename | modeM0/AS1T04_051T01_9000004686_32091cztM0_level2.evt | modeM0/AS1T04_051T01_9000004686_32091cztM0_level2_quad_clean.evt |
| Size (bytes) | 815,716,800 | 73,765,440 |
| Size | 777.9 MB | 70.3 MB |
| Events in quadrant A | 3,539,099 | 481,882 |
| Events in quadrant B | 7,414,299 | 436,042 |
| Events in quadrant C | 3,974,594 | 477,286 |
| Events in quadrant D | 9,350,523 | 396,353 |
| Mode M9 | |||
|---|---|---|---|
| Quadrant | BADHDUFLAG | Total packets | Discarded packets |
| A | 0 | 17 | 0 |
| B | 0 | 18 | 0 |
| C | 0 | 18 | 0 |
| D | 0 | 18 | 0 |
| Mode M0 | |||
|---|---|---|---|
| Quadrant | BADHDUFLAG | Total packets | Discarded packets |
| A | 0 | 14262 | 2 |
| B | 0 | 26287 | 2 |
| C | 0 | 15936 | 2 |
| D | 0 | 32186 | 2 |
| Mode SS | |||
|---|---|---|---|
| Quadrant | BADHDUFLAG | Total packets | Discarded packets |
| A | 0 | 128 | 0 |
| B | 0 | 128 | 0 |
| C | 0 | 128 | 0 |
| D | 0 | 128 | 0 |
| Quadrant | Total seconds | Saturated seconds | Saturation percentage |
|---|---|---|---|
| A | 6324 | 37 | 0.585073% |
| B | 6324 | 899 | 14.215686% |
| C | 6324 | 231 | 3.652751% |
| D | 6324 | 1847 | 29.206199% |
Noise dominated data is calculated using 1-second bins in cleaned event files. If a bin has >2000 counts, and if more than 50% of those come from <1% of pixels, then it is considered to be noise-dominated and hence unusable.
| Quadrant | # 1 sec bins | Bins with >0 counts | Bins with >2000 counts | High rate bins dominated by noise | Noise dominated (total time) | Noise dominated (detector-on time) | Marked lightcurve |
|---|---|---|---|---|---|---|---|
| A | 7709 | 6324 | 0 | 0 | 0.00% | 0.00% | 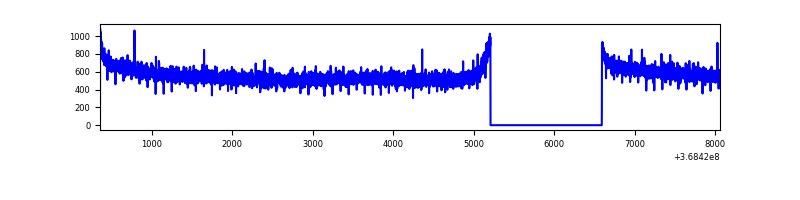 |
| B | 7709 | 6324 | 606 | 606 | 7.86% | 9.58% | 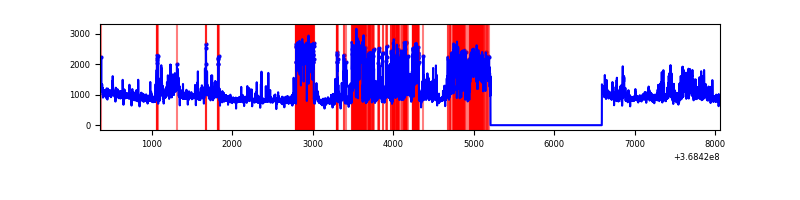 |
| C | 7709 | 6324 | 49 | 49 | 0.64% | 0.77% | 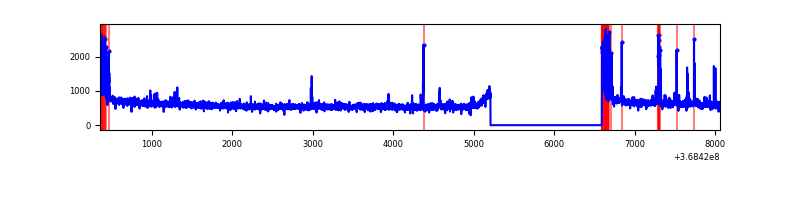 |
| D | 7709 | 6324 | 1861 | 1861 | 24.14% | 29.43% | 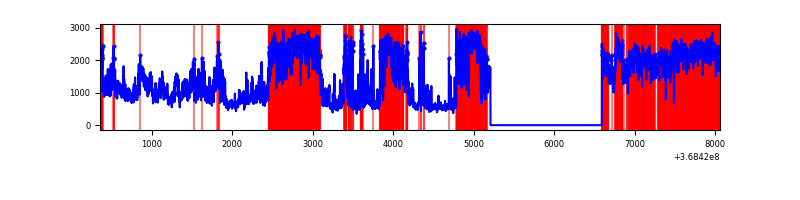 |
Top three noisy pixels from each quadrant. If the there are fewer than three noisy pixels in the level2.evt file, extra rows are filled as -1
| Pixel properties | Quadrant properties | ||||||
|---|---|---|---|---|---|---|---|
| Quadrant | DetID | PixID | Counts | Sigma | Mean | Median | Sigma |
| A | 13 | 6 | 13248 | 69.08 | 915 | 903 | 178.7 |
| A | 13 | 254 | 11686 | 60.34 | 915 | 903 | 178.7 |
| A | 3 | 137 | 8127 | 40.42 | 915 | 903 | 178.7 |
| B | 10 | 245 | 2107018 | 13339.69 | 869 | 852 | 157.9 |
| B | 6 | 159 | 1657079 | 10489.94 | 869 | 852 | 157.9 |
| B | 5 | 172 | 197929 | 1248.21 | 869 | 852 | 157.9 |
| C | 0 | 10 | 235361 | 1181.42 | 883 | 895 | 198.5 |
| C | 14 | 238 | 153245 | 767.66 | 883 | 895 | 198.5 |
| C | 2 | 16 | 58383 | 289.67 | 883 | 895 | 198.5 |
| D | 12 | 227 | 3240366 | 16764.11 | 830 | 811 | 193.2 |
| D | 12 | 79 | 1860201 | 9622.01 | 830 | 811 | 193.2 |
| D | 8 | 195 | 954977 | 4937.64 | 830 | 811 | 193.2 |
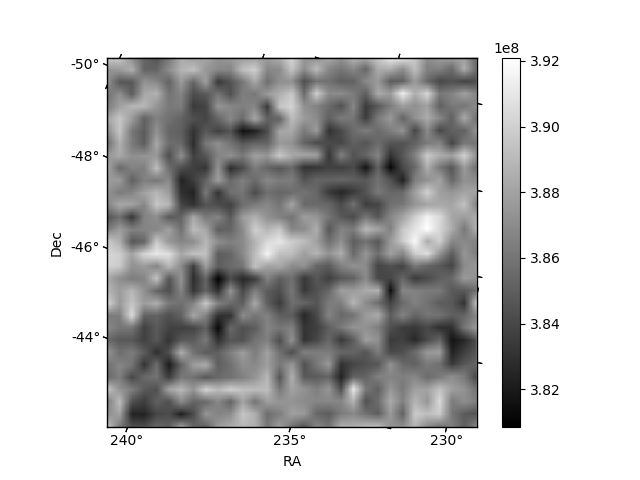
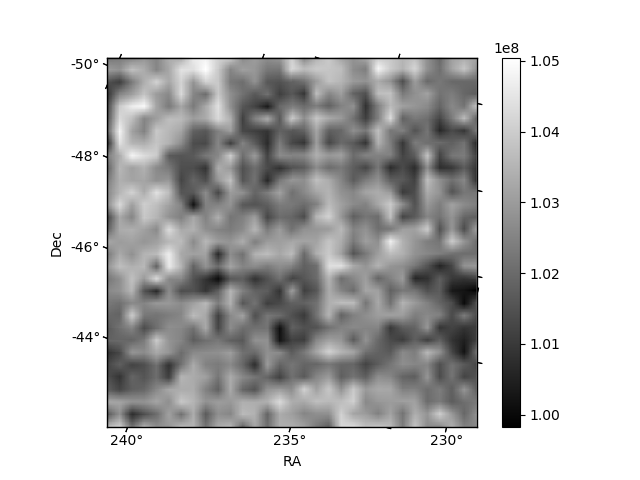
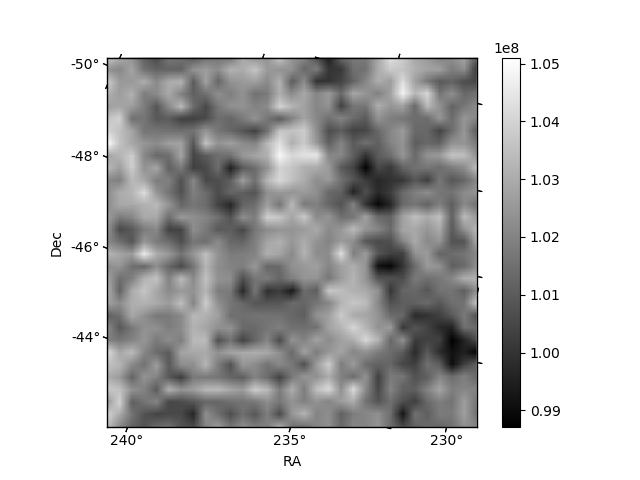
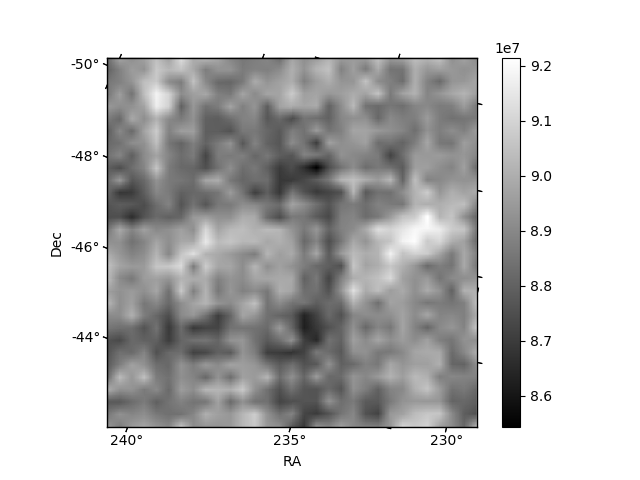
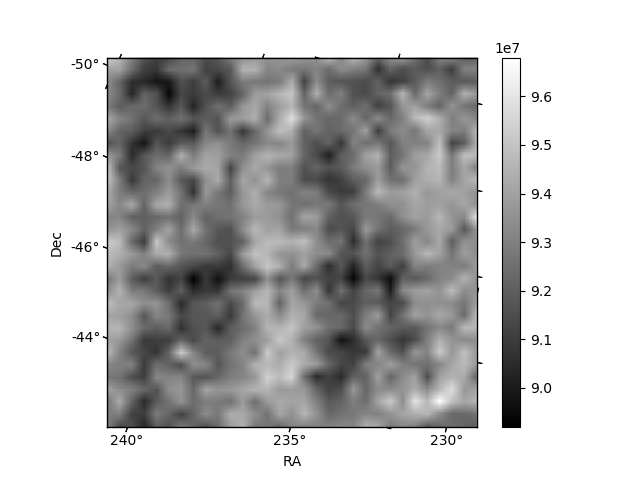
Histogram calculated using DETX and DETY for each event in the final _common_clean file
| Quadrant A | 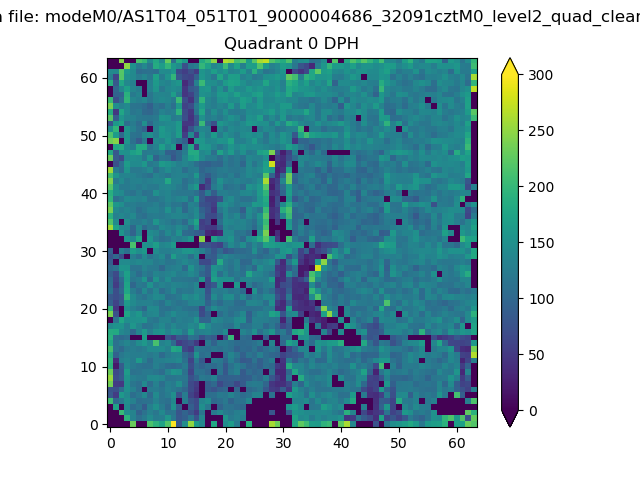 |
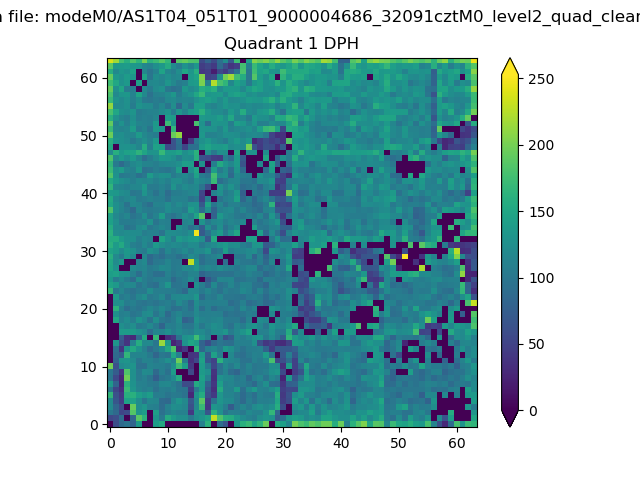 |
Quadrant B |
|---|---|---|---|
| Quadrant D | 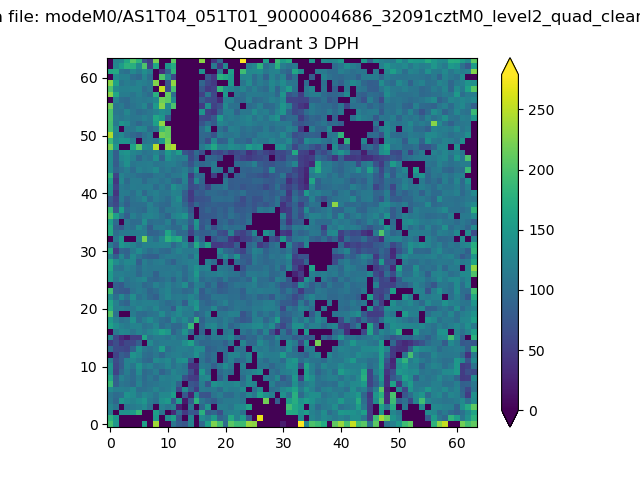 |
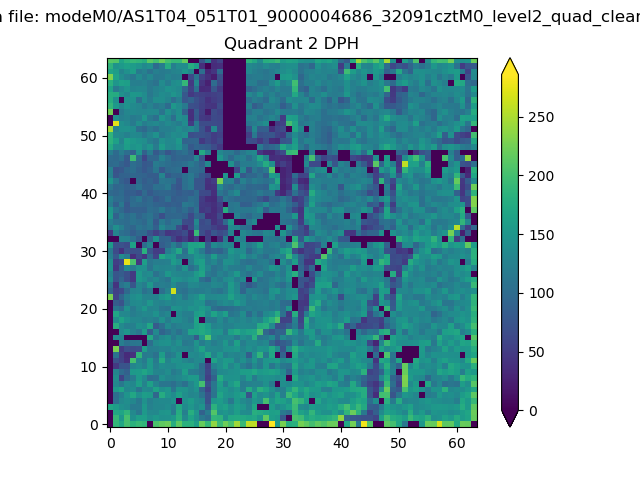 |
Quadrant C |
| Plot type | Count rate plots | Images |
|---|---|---|
| Comparison with Poisson distribution Blue bars denote a histogram of data divided into 1 sec bins. Red curve is a Poisson curve with rate = median count rate of data. |
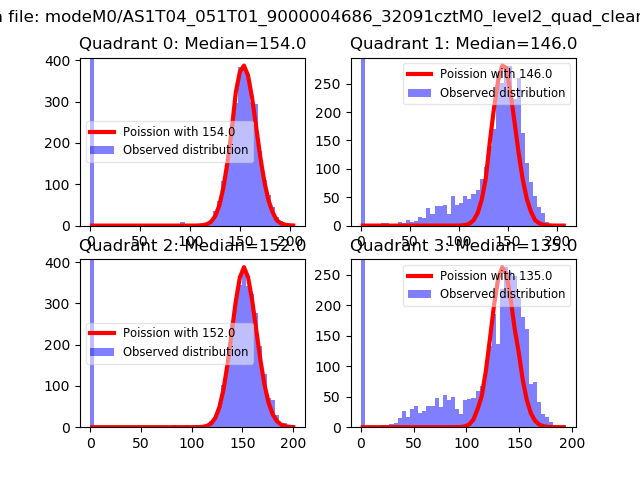 |
 |
| Quadrant-wise count rates Data is divided into 100 sec bins |
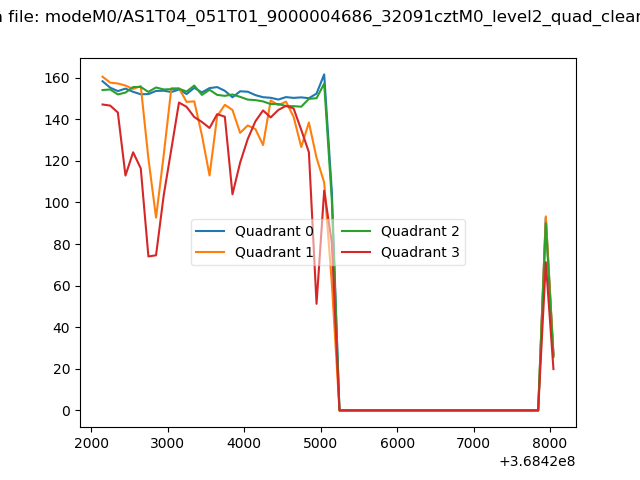 |
|
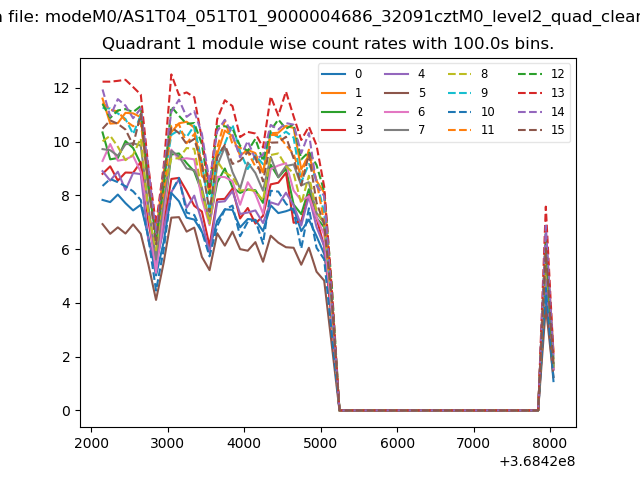
| Module-wise count rates for Quadrant A Data is divided into 100 sec bins |
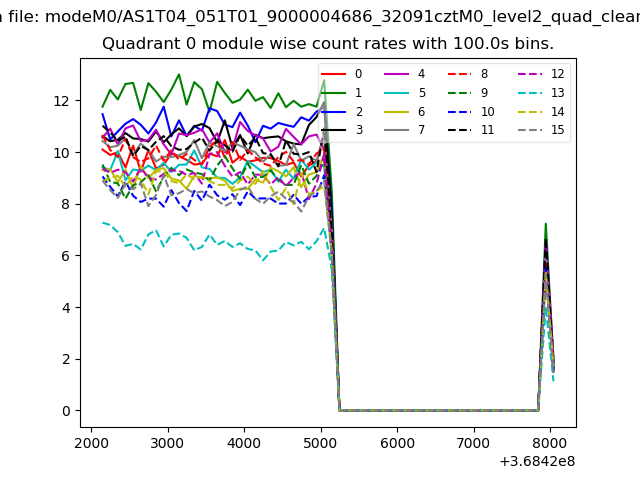 |
 |
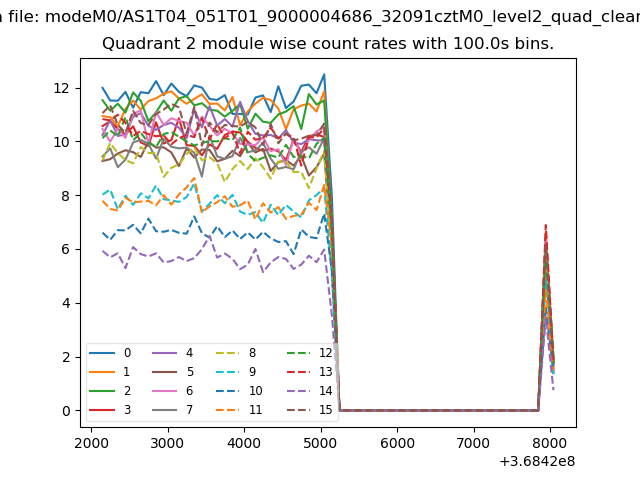
| Module-wise count rates for Quadrant B Data is divided into 100 sec bins |
 |
 |
| Module-wise count rates for Quadrant C Data is divided into 100 sec bins |
 |
 |
| Module-wise count rates for Quadrant D Data is divided into 100 sec bins |
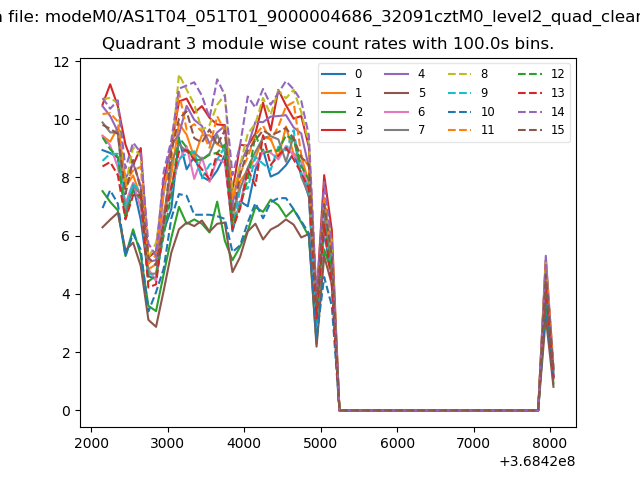 |
 |
| Parameter | Plot |
|---|---|
| CZT HV Monitor | 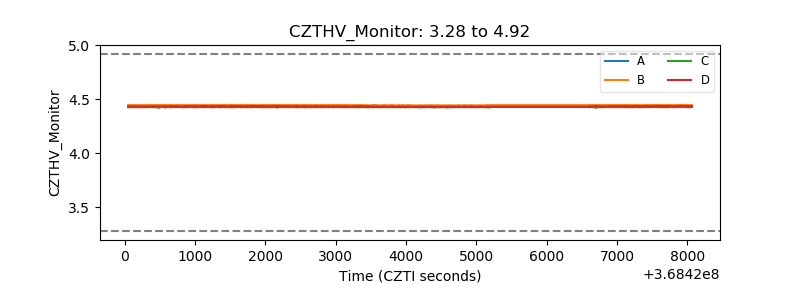 |
| D_VDD | 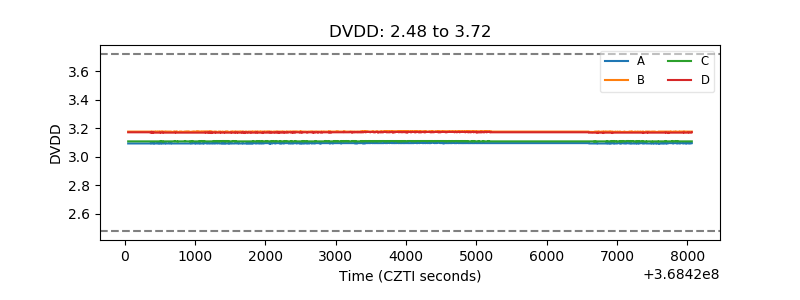 |
| Temperature 1 | 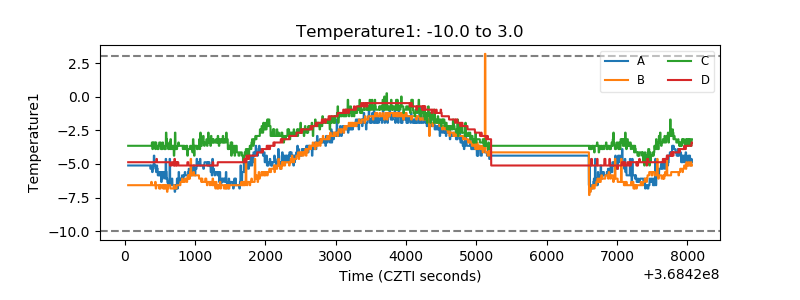 |
| Veto HV Monitor | 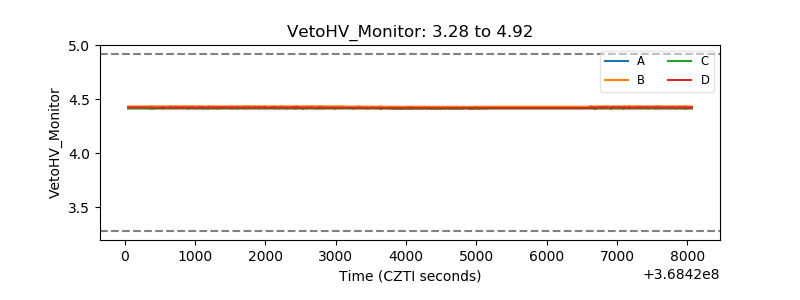 |
| Veto LLD | 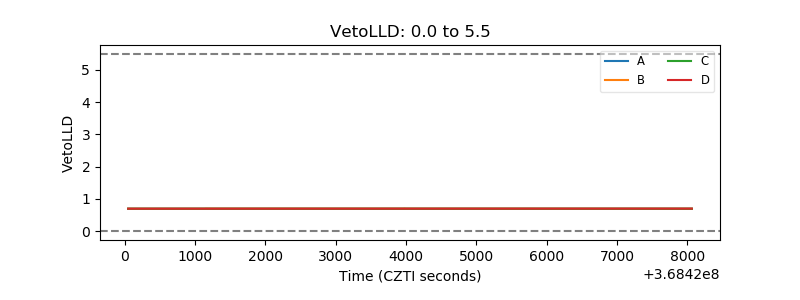 |
| Alpha Counter | 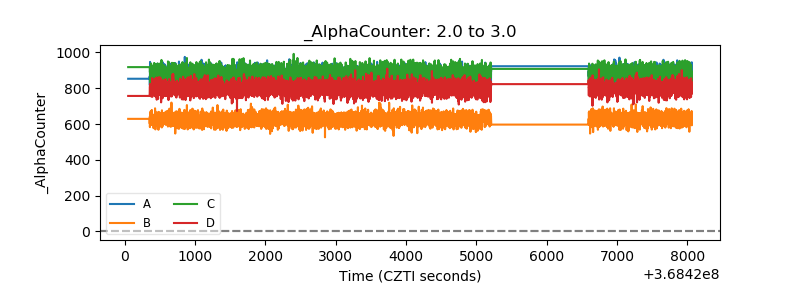 |
| _CPM_Rate | 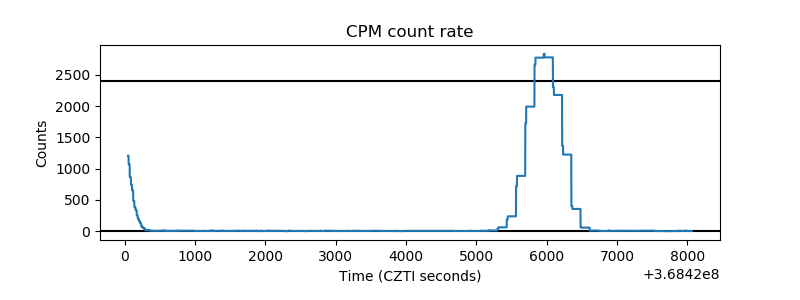 |
| CZT Counter | 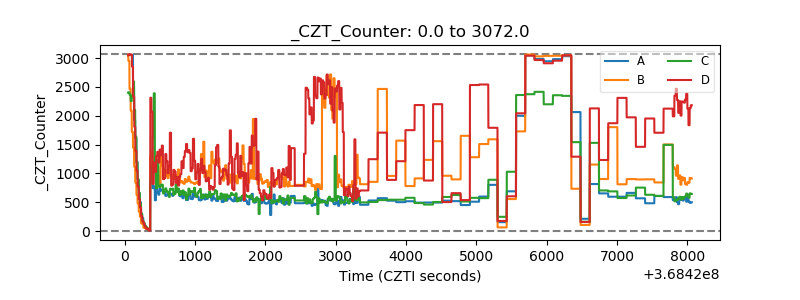 |
| +2.5 Volts monitor | 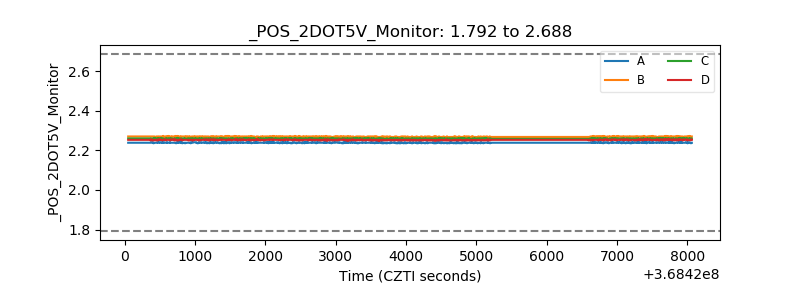 |
| +5 Volts monitor | 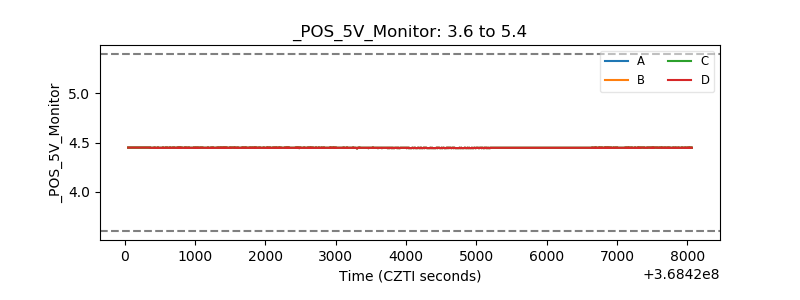 |
| _ROLL_ROT | 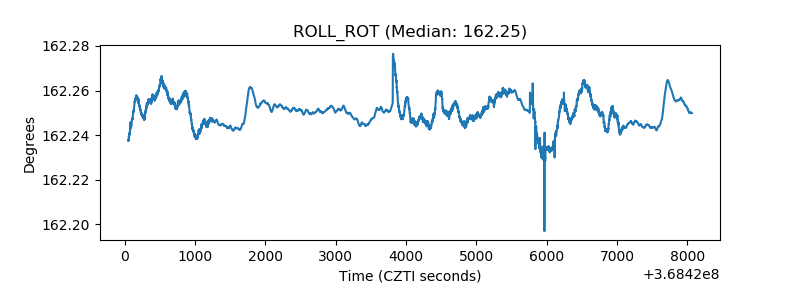 |
| _Roll_DEC |  |
| _Roll_RA | 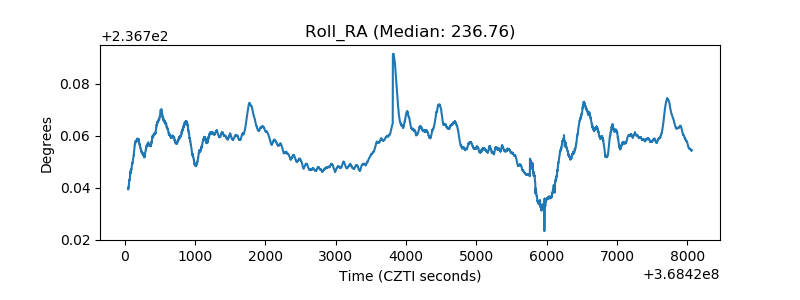 |
| Veto Counter | 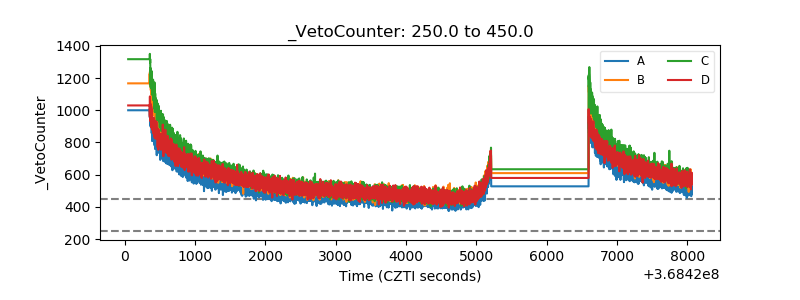 |