| Param | Original file | Final file |
|---|---|---|
| Filename | modeM0/AS1T04_051T01_9000004686_32092cztM0_level2.evt | modeM0/AS1T04_051T01_9000004686_32092cztM0_level2_quad_clean.evt |
| Size (bytes) | 896,639,040 | 80,484,480 |
| Size | 855.1 MB | 76.8 MB |
| Events in quadrant A | 3,141,008 | 588,210 |
| Events in quadrant B | 8,624,886 | 450,393 |
| Events in quadrant C | 3,580,254 | 577,288 |
| Events in quadrant D | 11,420,430 | 415,546 |
| Mode M9 | |||
|---|---|---|---|
| Quadrant | BADHDUFLAG | Total packets | Discarded packets |
| A | 0 | 13 | 0 |
| B | 0 | 13 | 0 |
| C | 0 | 13 | 0 |
| D | 0 | 13 | 0 |
| Mode M0 | |||
|---|---|---|---|
| Quadrant | BADHDUFLAG | Total packets | Discarded packets |
| A | 0 | 12622 | 31 |
| B | 0 | 29466 | 55 |
| C | 0 | 14453 | 15 |
| D | 0 | 37961 | 105 |
| Mode SS | |||
|---|---|---|---|
| Quadrant | BADHDUFLAG | Total packets | Discarded packets |
| A | 0 | 120 | 0 |
| B | 0 | 120 | 0 |
| C | 0 | 120 | 0 |
| D | 0 | 120 | 0 |
| Quadrant | Total seconds | Saturated seconds | Saturation percentage |
|---|---|---|---|
| A | 5762 | 66 | 1.145436% |
| B | 5770 | 2099 | 36.377816% |
| C | 5771 | 229 | 3.968116% |
| D | 5765 | 3066 | 53.183001% |
Noise dominated data is calculated using 1-second bins in cleaned event files. If a bin has >2000 counts, and if more than 50% of those come from <1% of pixels, then it is considered to be noise-dominated and hence unusable.
| Quadrant | # 1 sec bins | Bins with >0 counts | Bins with >2000 counts | High rate bins dominated by noise | Noise dominated (total time) | Noise dominated (detector-on time) | Marked lightcurve |
|---|---|---|---|---|---|---|---|
| A | 7149 | 5771 | 0 | 0 | 0.00% | 0.00% | 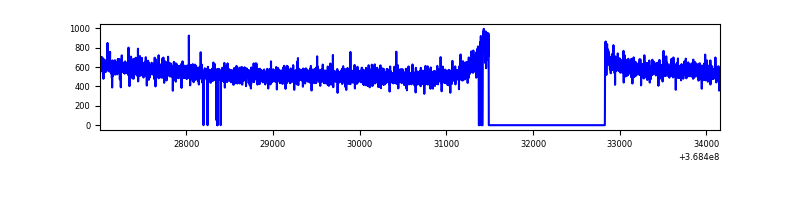 |
| B | 7150 | 5775 | 1851 | 1851 | 25.89% | 32.05% | 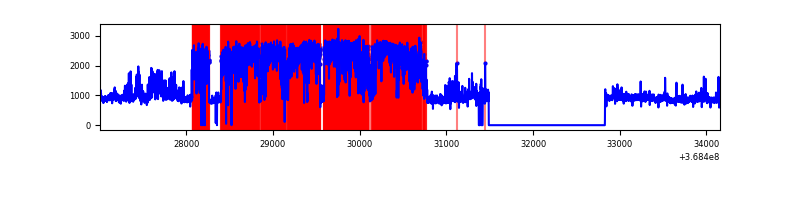 |
| C | 7150 | 5780 | 29 | 29 | 0.41% | 0.50% | 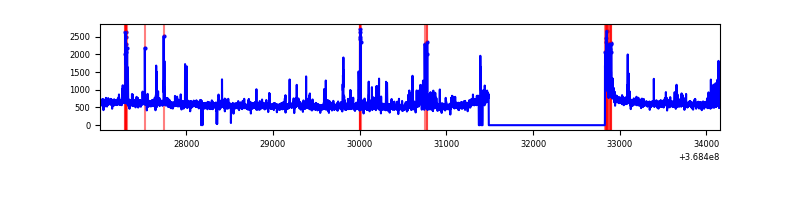 |
| D | 7150 | 5767 | 3387 | 3387 | 47.37% | 58.73% | 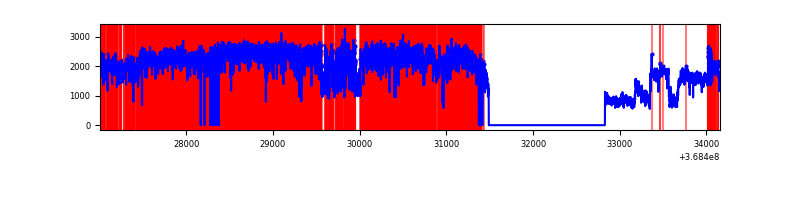 |
Top three noisy pixels from each quadrant. If the there are fewer than three noisy pixels in the level2.evt file, extra rows are filled as -1
| Pixel properties | Quadrant properties | ||||||
|---|---|---|---|---|---|---|---|
| Quadrant | DetID | PixID | Counts | Sigma | Mean | Median | Sigma |
| A | 13 | 254 | 10220 | 59.13 | 813 | 800 | 159.3 |
| A | 3 | 137 | 7284 | 40.7 | 813 | 800 | 159.3 |
| A | 13 | 6 | 7223 | 40.31 | 813 | 800 | 159.3 |
| B | 10 | 245 | 4423355 | 33931.39 | 706 | 690 | 130.3 |
| B | 6 | 159 | 1372290 | 10523.13 | 706 | 690 | 130.3 |
| B | 0 | 190 | 25587 | 191.01 | 706 | 690 | 130.3 |
| C | 0 | 10 | 304063 | 1710.83 | 779 | 785 | 177.3 |
| C | 14 | 238 | 136088 | 763.26 | 779 | 785 | 177.3 |
| C | 2 | 16 | 37928 | 209.53 | 779 | 785 | 177.3 |
| D | 12 | 79 | 5835703 | 36377.42 | 682 | 666 | 160.4 |
| D | 12 | 233 | 1416207 | 8824.92 | 682 | 666 | 160.4 |
| D | 8 | 195 | 1124859 | 7008.57 | 682 | 666 | 160.4 |
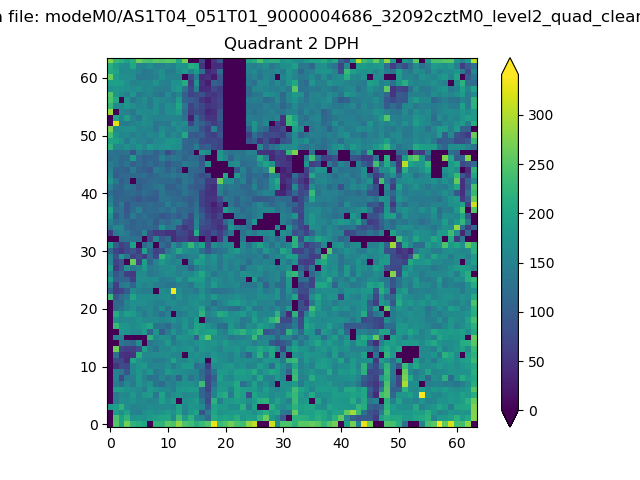
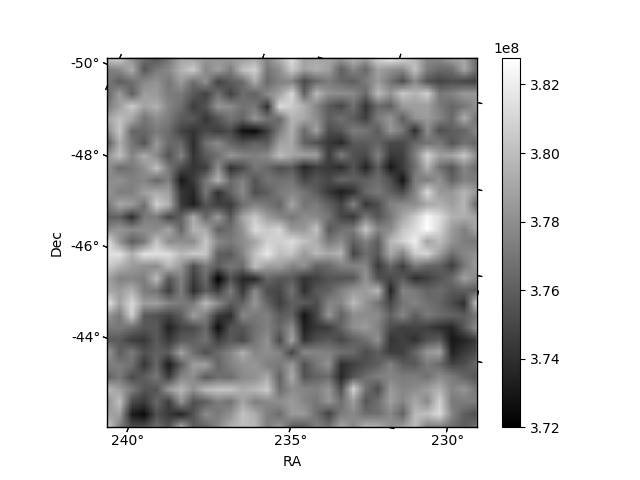
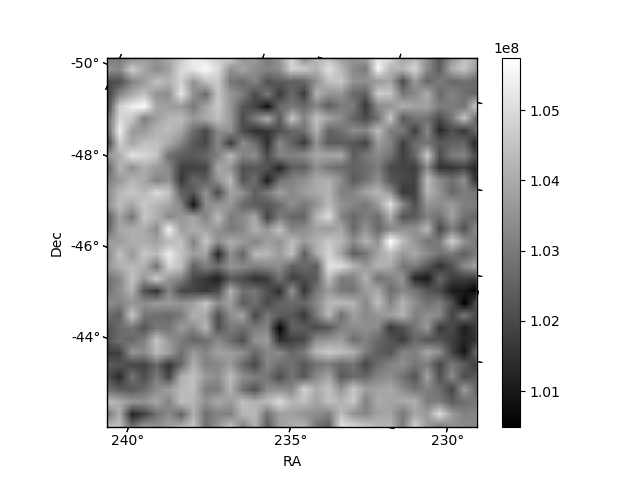
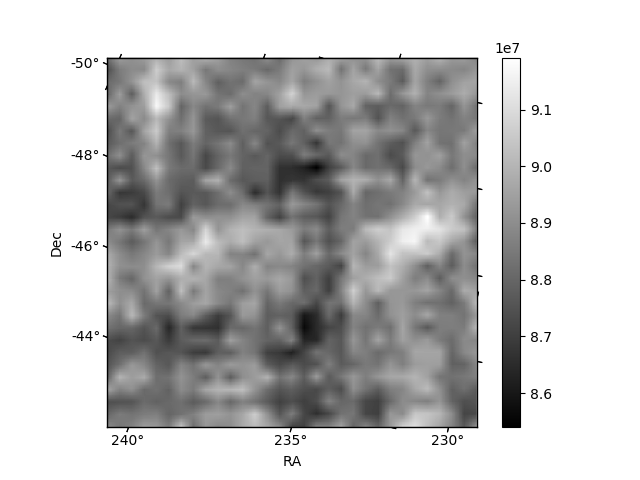
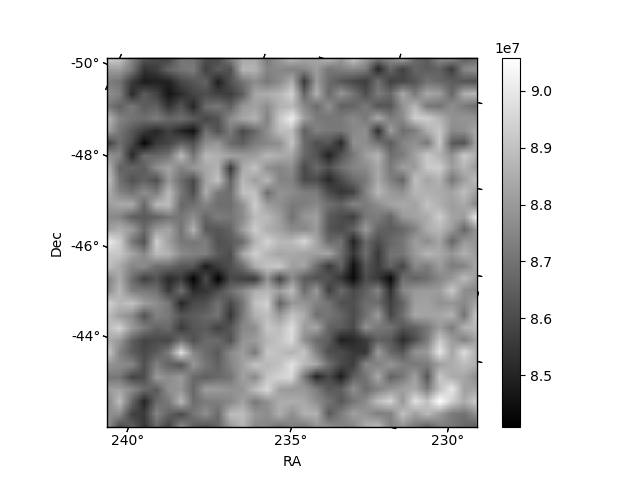
Histogram calculated using DETX and DETY for each event in the final _common_clean file
| Quadrant A | 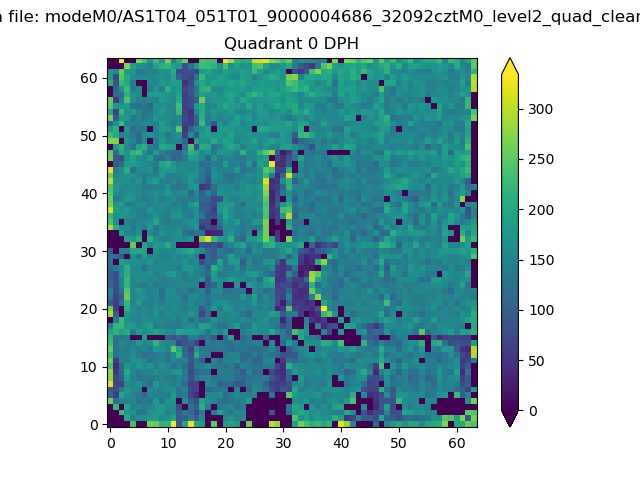 |
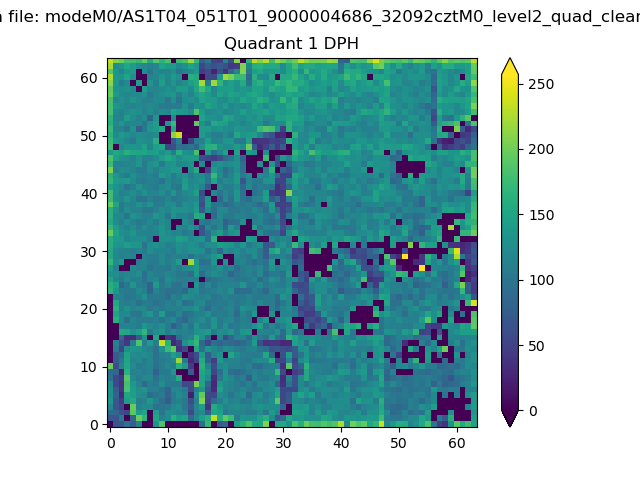 |
Quadrant B |
|---|---|---|---|
| Quadrant D | 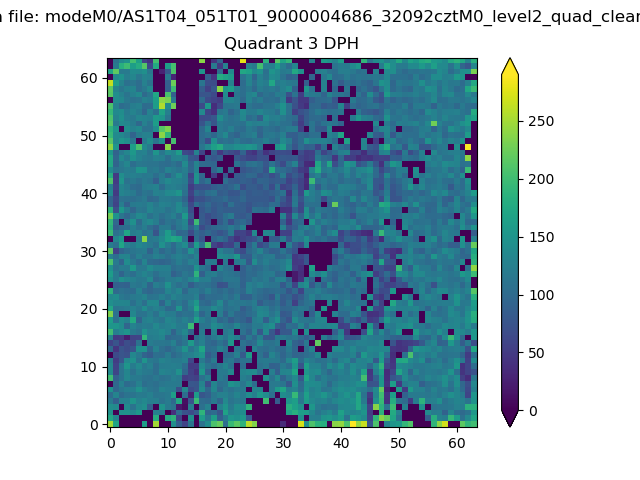 |
 |
Quadrant C |
| Plot type | Count rate plots | Images |
|---|---|---|
| Comparison with Poisson distribution Blue bars denote a histogram of data divided into 1 sec bins. Red curve is a Poisson curve with rate = median count rate of data. |
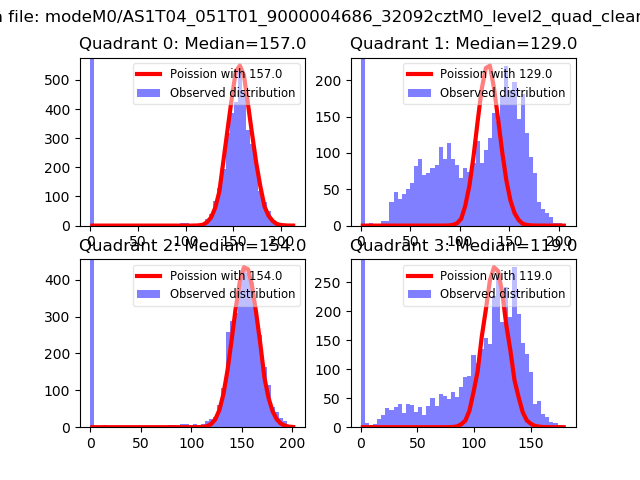 |
 |
| Quadrant-wise count rates Data is divided into 100 sec bins |
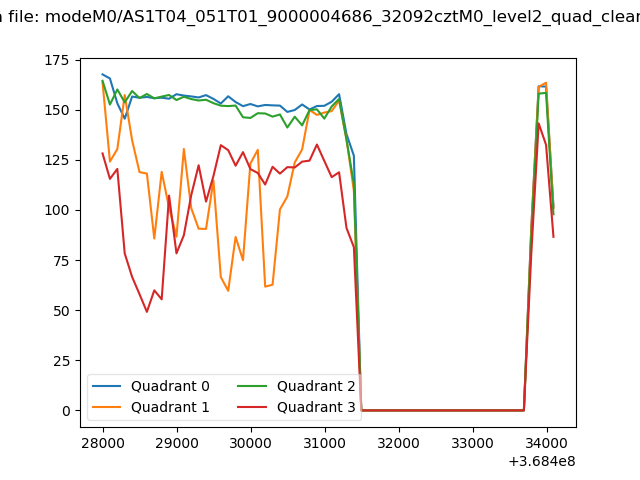 |
|
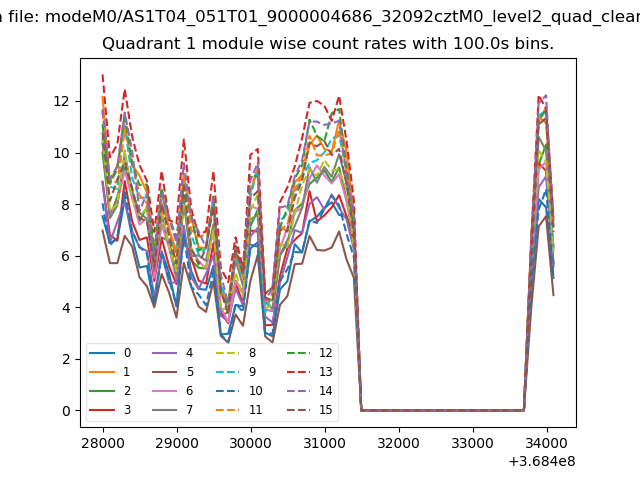
| Module-wise count rates for Quadrant A Data is divided into 100 sec bins |
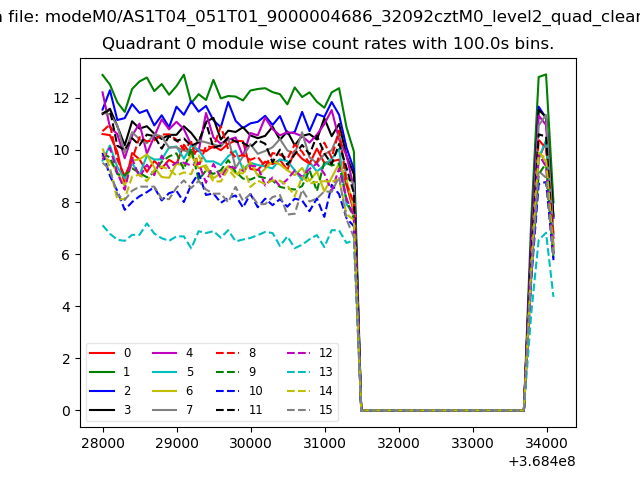 |
 |
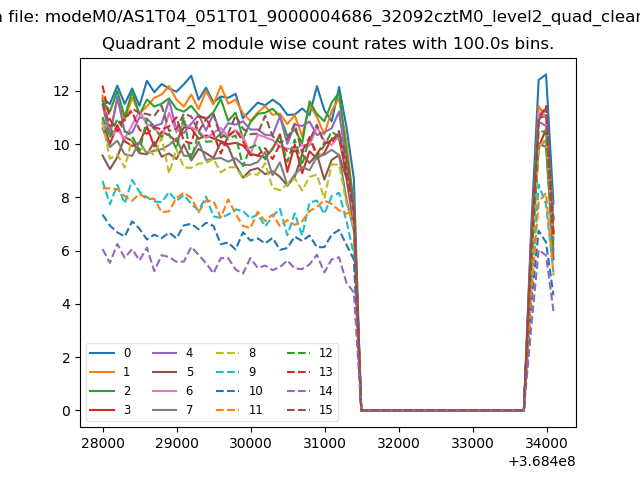
| Module-wise count rates for Quadrant B Data is divided into 100 sec bins |
 |
 |
| Module-wise count rates for Quadrant C Data is divided into 100 sec bins |
 |
 |
| Module-wise count rates for Quadrant D Data is divided into 100 sec bins |
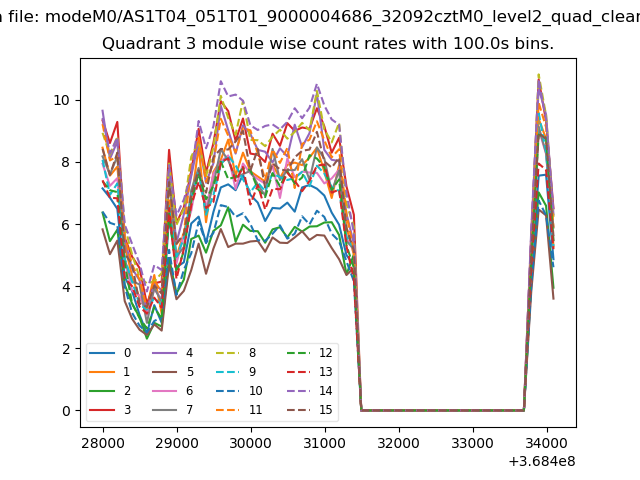 |
 |
| Parameter | Plot |
|---|---|
| CZT HV Monitor | 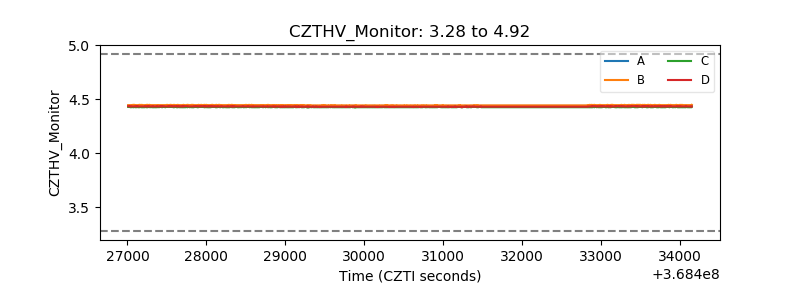 |
| D_VDD | 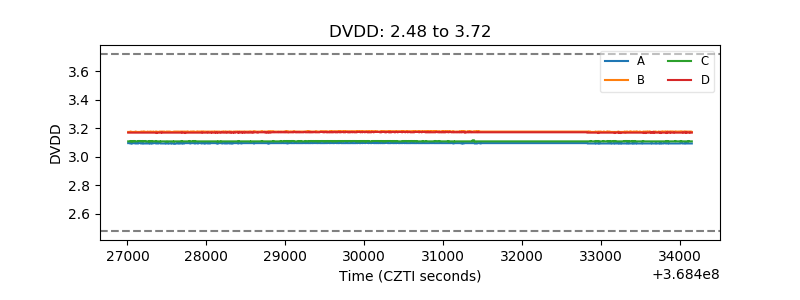 |
| Temperature 1 |  |
| Veto HV Monitor | 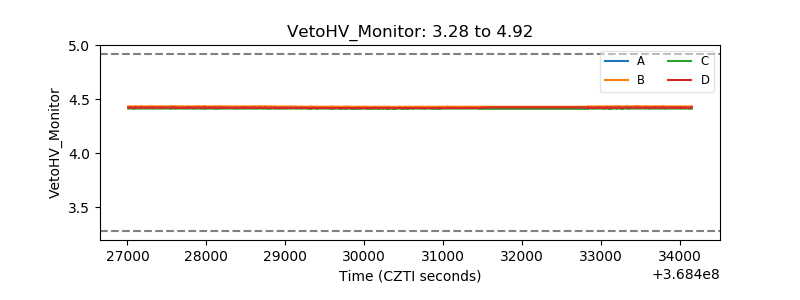 |
| Veto LLD | 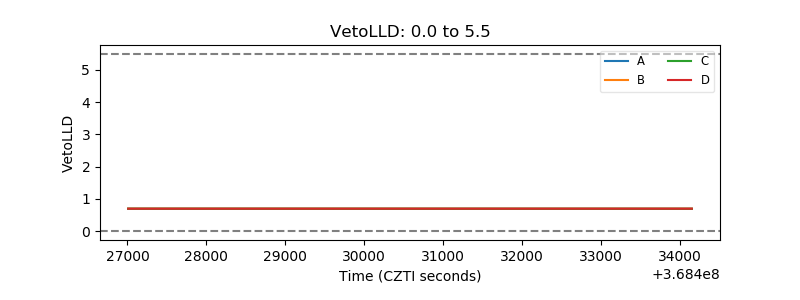 |
| Alpha Counter | 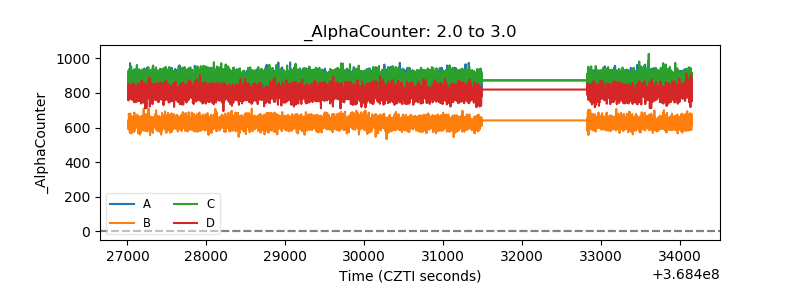 |
| _CPM_Rate | 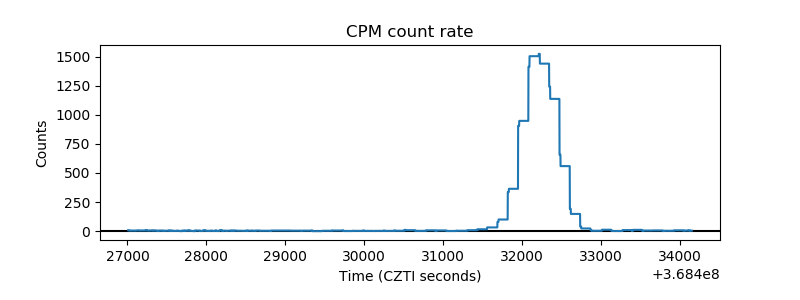 |
| CZT Counter | 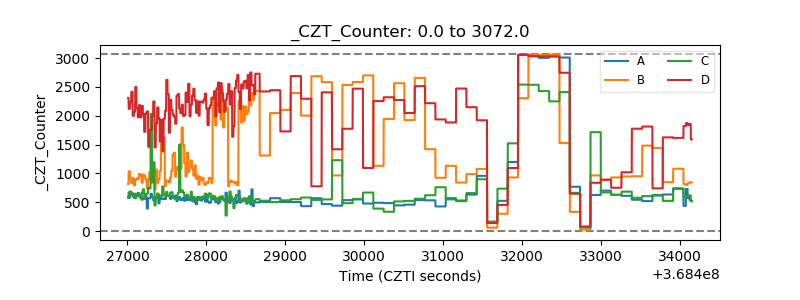 |
| +2.5 Volts monitor |  |
| +5 Volts monitor | 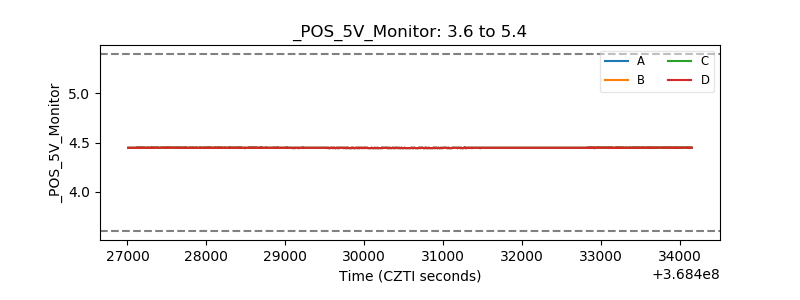 |
| _ROLL_ROT | 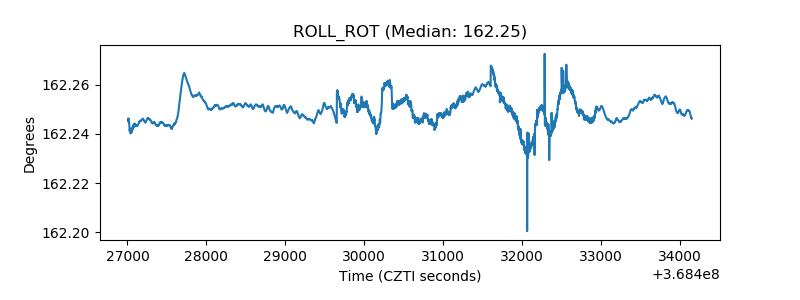 |
| _Roll_DEC | 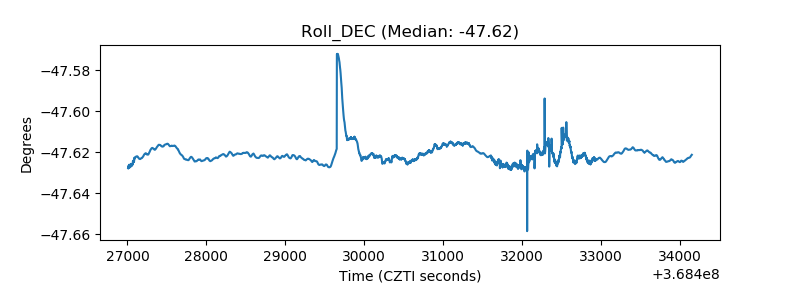 |
| _Roll_RA | 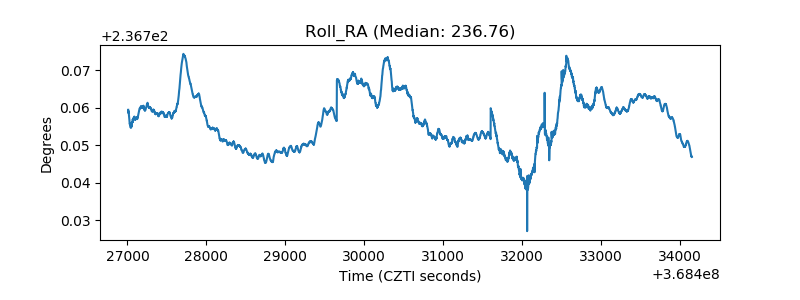 |
| Veto Counter | 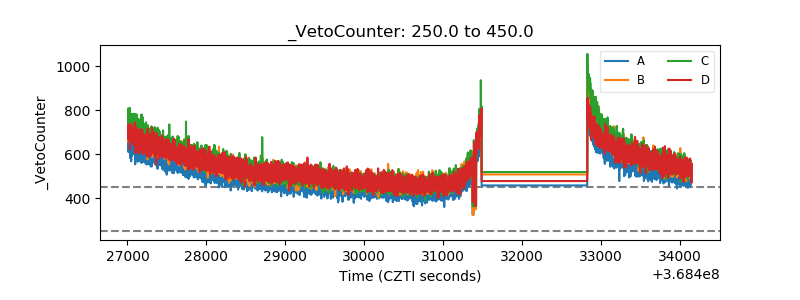 |