| Param | Original file | Final file |
|---|---|---|
| Filename | modeM0/AS1T04_051T01_9000004686_32095cztM0_level2.evt | modeM0/AS1T04_051T01_9000004686_32095cztM0_level2_quad_clean.evt |
| Size (bytes) | 758,528,640 | 108,432,000 |
| Size | 723.4 MB | 103.4 MB |
| Events in quadrant A | 3,480,238 | 722,977 |
| Events in quadrant B | 9,159,613 | 682,786 |
| Events in quadrant C | 3,675,887 | 707,169 |
| Events in quadrant D | 6,175,207 | 673,885 |
| Mode M9 | |||
|---|---|---|---|
| Quadrant | BADHDUFLAG | Total packets | Discarded packets |
| A | 0 | 2 | 0 |
| B | 0 | 2 | 0 |
| C | 0 | 2 | 0 |
| D | 0 | 2 | 0 |
| Mode M0 | |||
|---|---|---|---|
| Quadrant | BADHDUFLAG | Total packets | Discarded packets |
| A | 0 | 14747 | 1 |
| B | 0 | 32200 | 1 |
| C | 0 | 15284 | 1 |
| D | 0 | 23541 | 1 |
| Mode SS | |||
|---|---|---|---|
| Quadrant | BADHDUFLAG | Total packets | Discarded packets |
| A | 0 | 146 | 0 |
| B | 0 | 146 | 0 |
| C | 0 | 146 | 0 |
| D | 0 | 146 | 0 |
| Quadrant | Total seconds | Saturated seconds | Saturation percentage |
|---|---|---|---|
| A | 7129 | 145 | 2.033946% |
| B | 7129 | 1283 | 17.996914% |
| C | 7129 | 207 | 2.903633% |
| D | 7128 | 351 | 4.924242% |
Noise dominated data is calculated using 1-second bins in cleaned event files. If a bin has >2000 counts, and if more than 50% of those come from <1% of pixels, then it is considered to be noise-dominated and hence unusable.
| Quadrant | # 1 sec bins | Bins with >0 counts | Bins with >2000 counts | High rate bins dominated by noise | Noise dominated (total time) | Noise dominated (detector-on time) | Marked lightcurve |
|---|---|---|---|---|---|---|---|
| A | 7384 | 7129 | 0 | 0 | 0.00% | 0.00% | 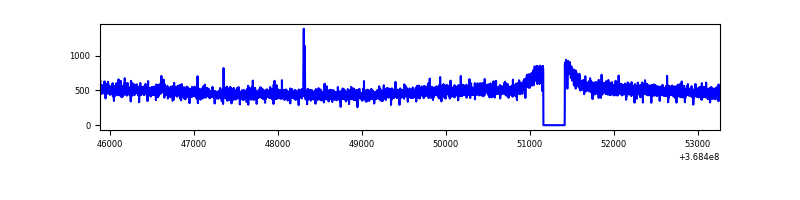 |
| B | 7384 | 7129 | 507 | 507 | 6.87% | 7.11% | 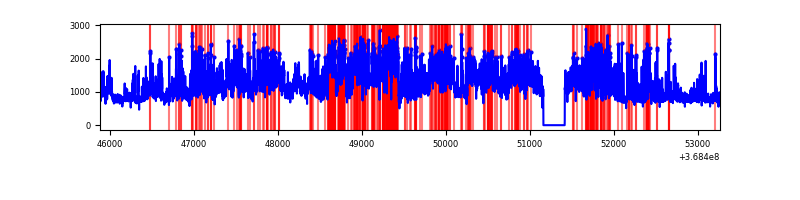 |
| C | 7384 | 7129 | 14 | 14 | 0.19% | 0.20% |  |
| D | 7383 | 7129 | 210 | 210 | 2.84% | 2.95% | 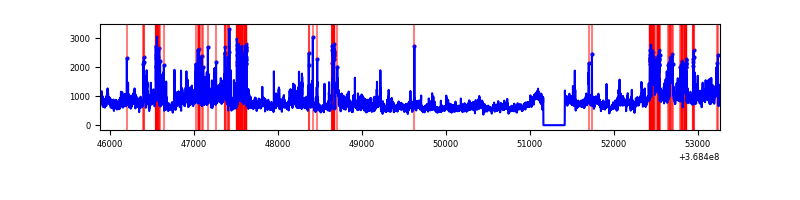 |
Top three noisy pixels from each quadrant. If the there are fewer than three noisy pixels in the level2.evt file, extra rows are filled as -1
| Pixel properties | Quadrant properties | ||||||
|---|---|---|---|---|---|---|---|
| Quadrant | DetID | PixID | Counts | Sigma | Mean | Median | Sigma |
| A | 13 | 254 | 13904 | 72.68 | 896 | 876 | 179.3 |
| A | 15 | 174 | 10289 | 52.51 | 896 | 876 | 179.3 |
| A | 13 | 6 | 9198 | 46.43 | 896 | 876 | 179.3 |
| B | 10 | 245 | 3288613 | 20291.4 | 842 | 821 | 162.0 |
| B | 6 | 159 | 1897068 | 11703.14 | 842 | 821 | 162.0 |
| B | 12 | 18 | 380810 | 2345.19 | 842 | 821 | 162.0 |
| C | 0 | 10 | 159363 | 795.82 | 852 | 858 | 199.2 |
| C | 14 | 238 | 147413 | 735.82 | 852 | 858 | 199.2 |
| C | 2 | 114 | 16217 | 77.11 | 852 | 858 | 199.2 |
| D | 8 | 195 | 1544809 | 7554.19 | 859 | 834 | 204.4 |
| D | 12 | 79 | 363611 | 1774.96 | 859 | 834 | 204.4 |
| D | 12 | 218 | 363181 | 1772.85 | 859 | 834 | 204.4 |
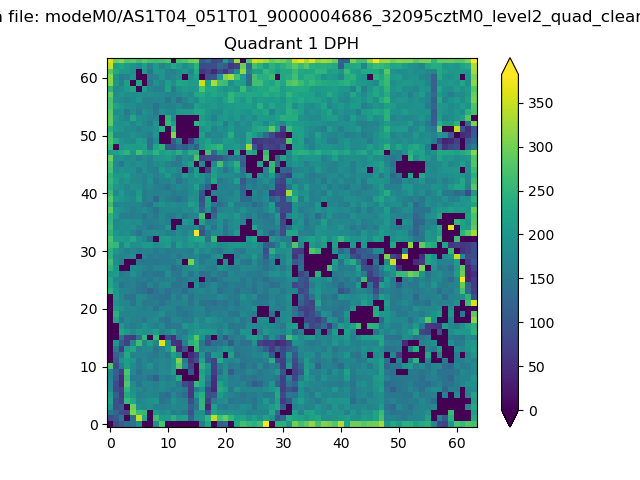
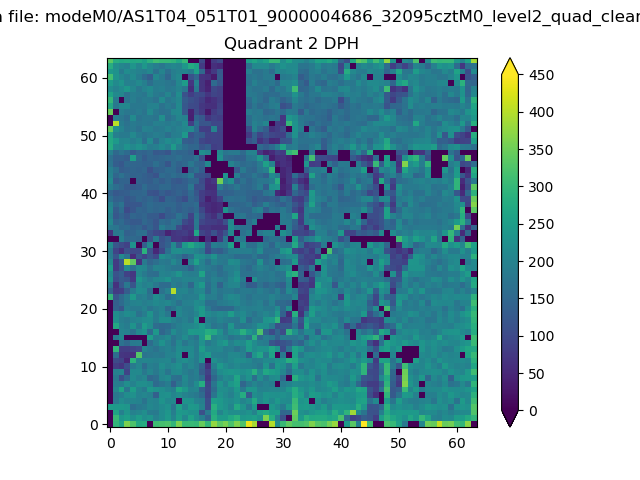
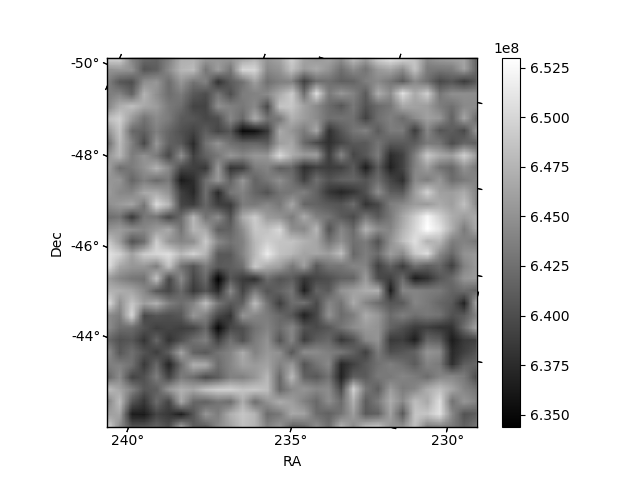
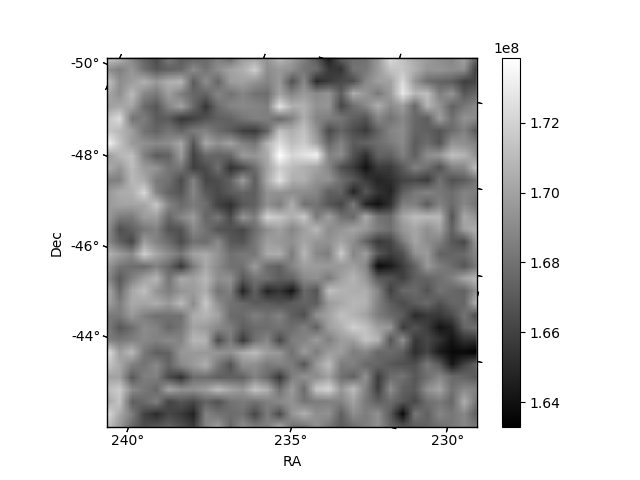
Histogram calculated using DETX and DETY for each event in the final _common_clean file
| Quadrant A | 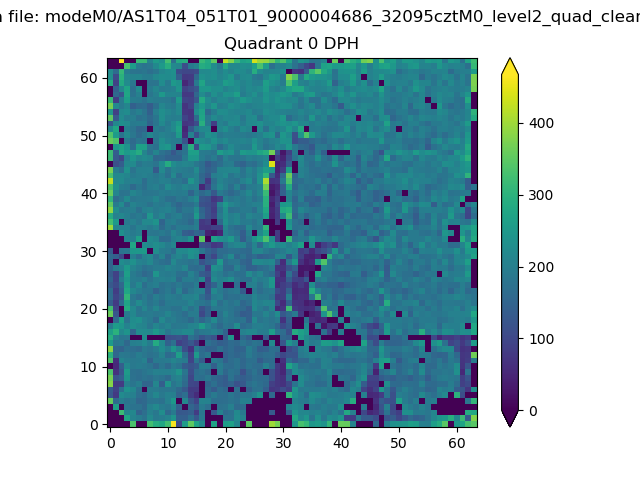 |
 |
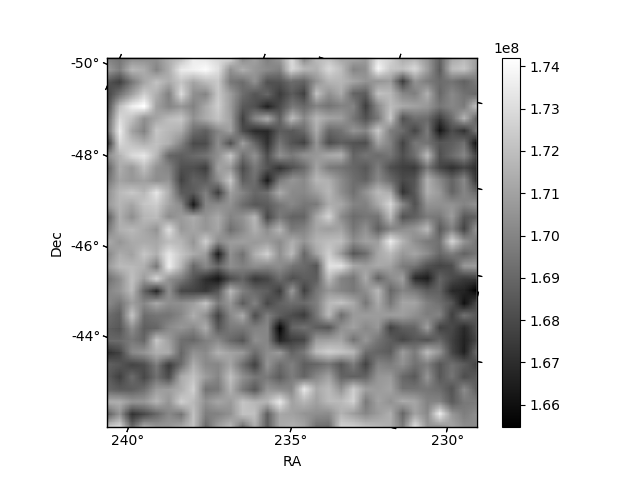
Quadrant B |
|---|---|---|---|
| Quadrant D | 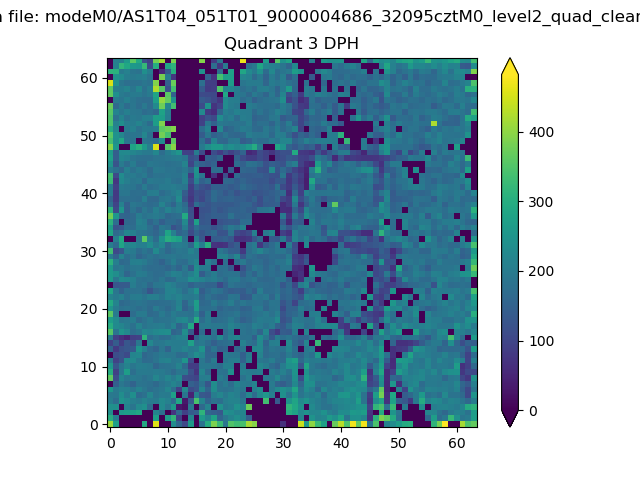 |
 |
Quadrant C |
| Plot type | Count rate plots | Images |
|---|---|---|
| Comparison with Poisson distribution Blue bars denote a histogram of data divided into 1 sec bins. Red curve is a Poisson curve with rate = median count rate of data. |
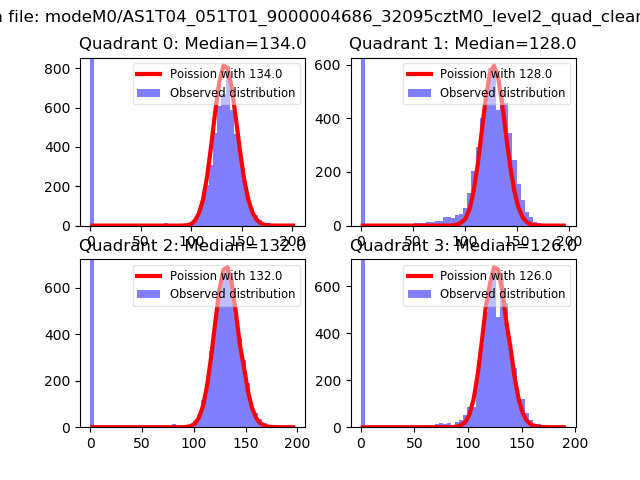 |
 |
| Quadrant-wise count rates Data is divided into 100 sec bins |
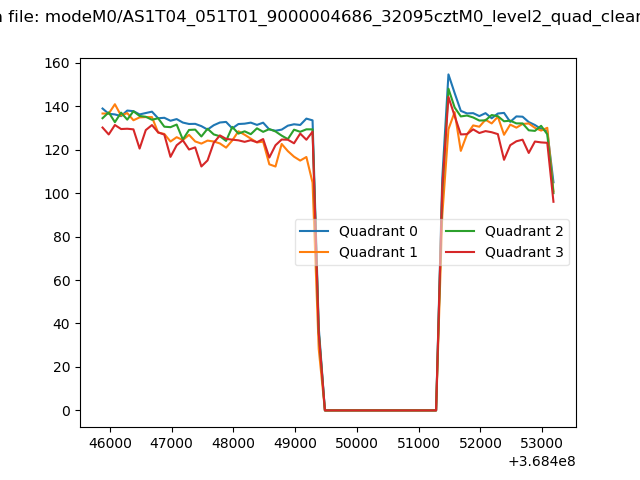 |
|
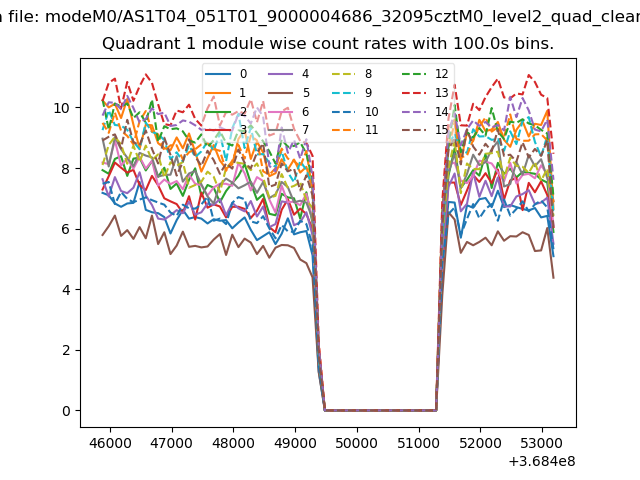
| Module-wise count rates for Quadrant A Data is divided into 100 sec bins |
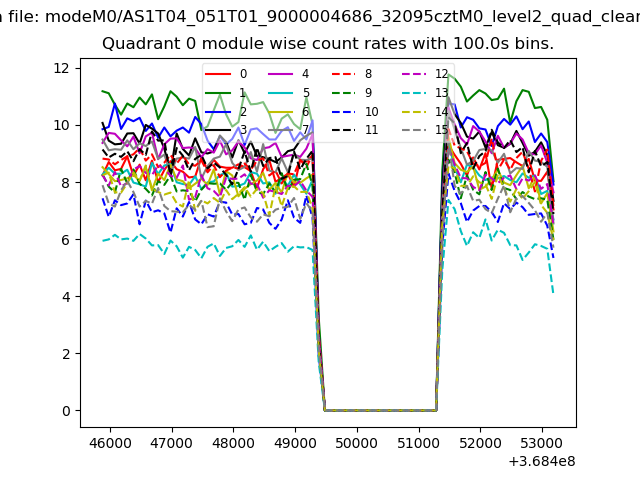 |
 |
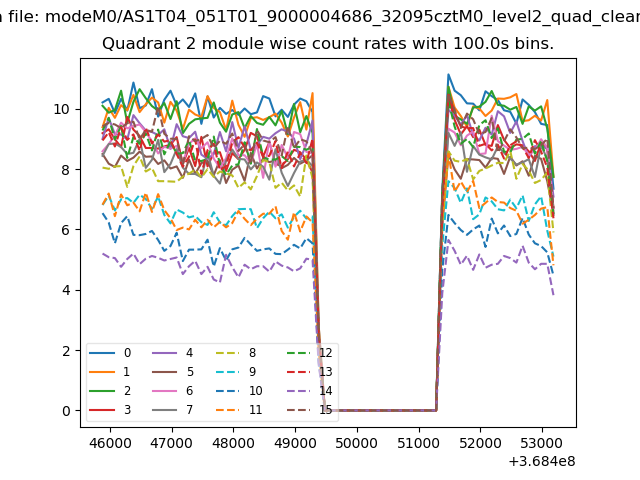
| Module-wise count rates for Quadrant B Data is divided into 100 sec bins |
 |
 |
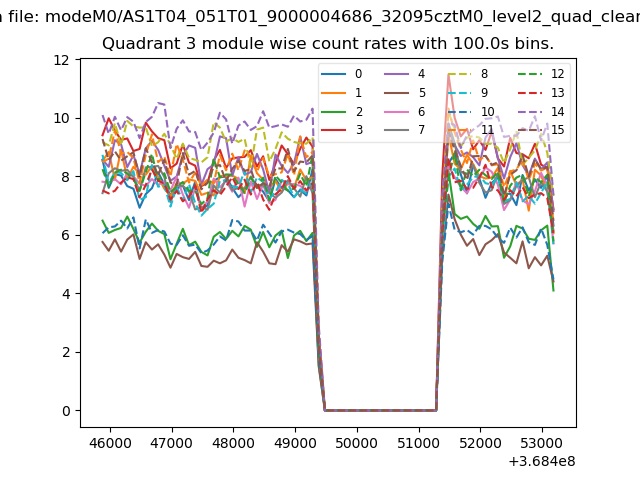
| Module-wise count rates for Quadrant C Data is divided into 100 sec bins |
 |
 |
| Module-wise count rates for Quadrant D Data is divided into 100 sec bins |
 |
 |
| Parameter | Plot |
|---|---|
| CZT HV Monitor | 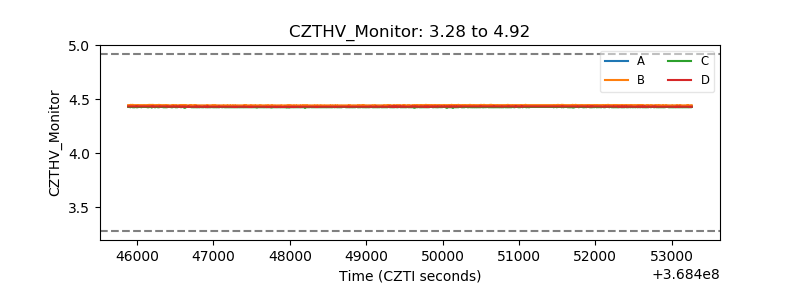 |
| D_VDD | 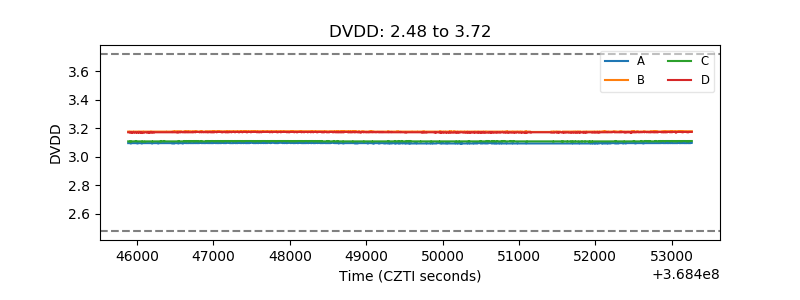 |
| Temperature 1 | 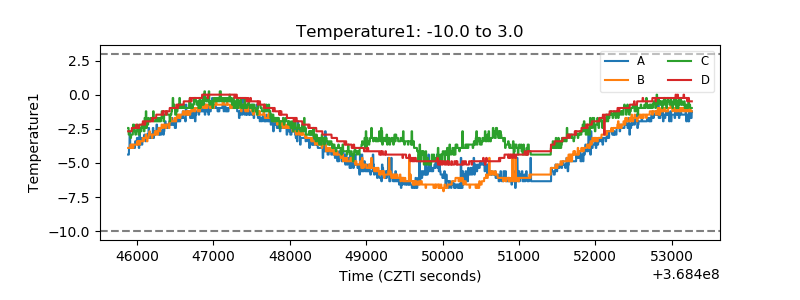 |
| Veto HV Monitor |  |
| Veto LLD | 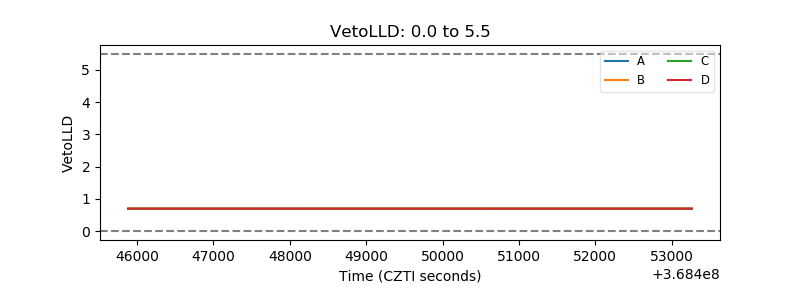 |
| Alpha Counter | 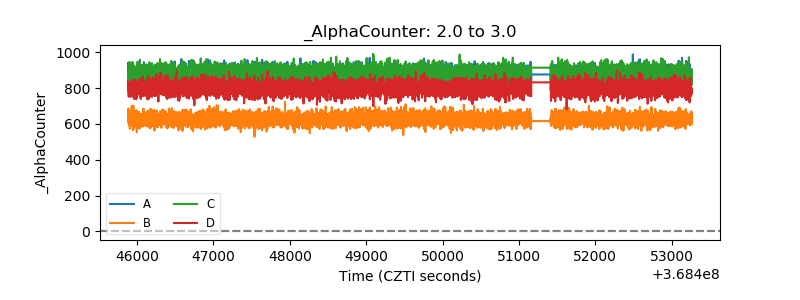 |
| _CPM_Rate | 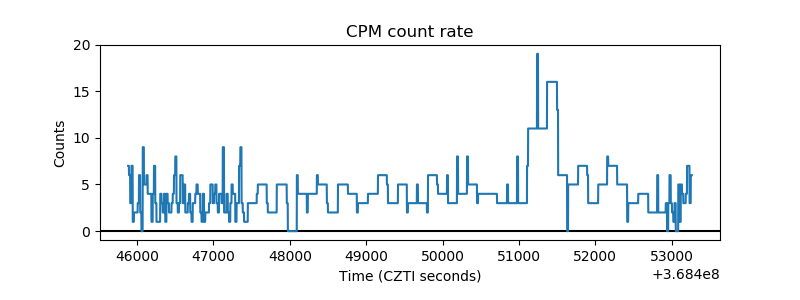 |
| CZT Counter | 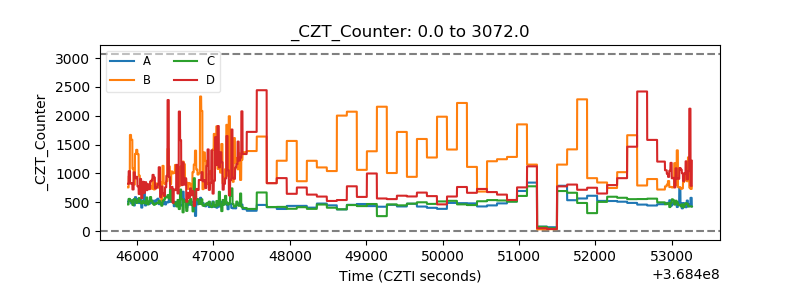 |
| +2.5 Volts monitor |  |
| +5 Volts monitor | 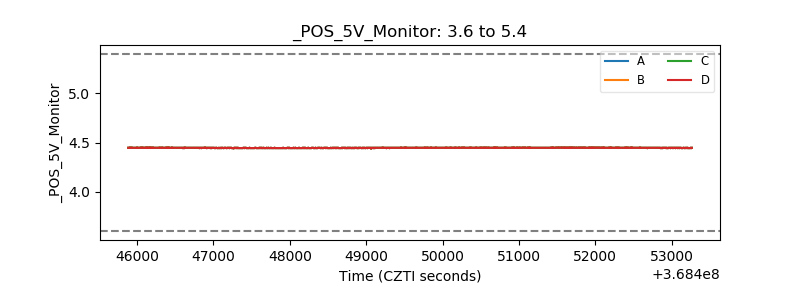 |
| _ROLL_ROT | 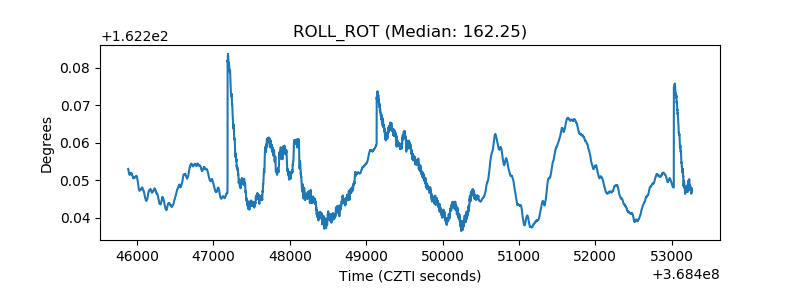 |
| _Roll_DEC | 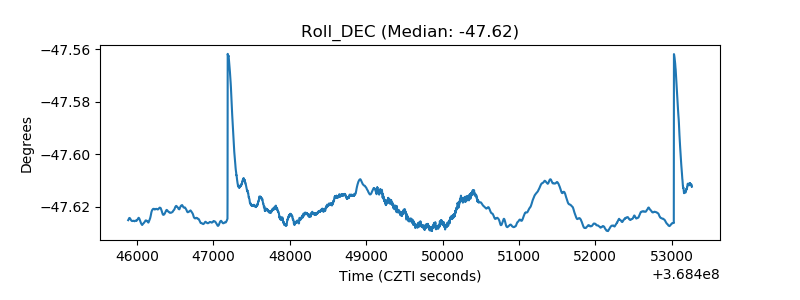 |
| _Roll_RA | 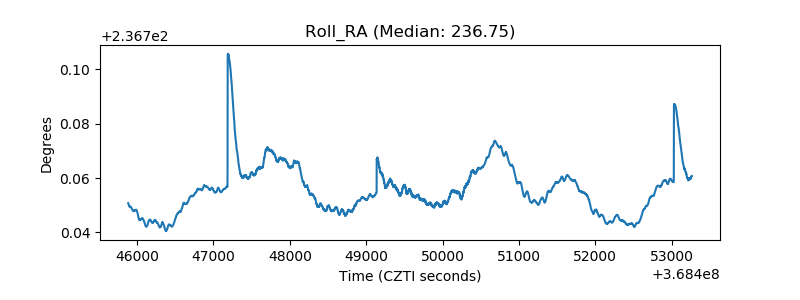 |
| Veto Counter | 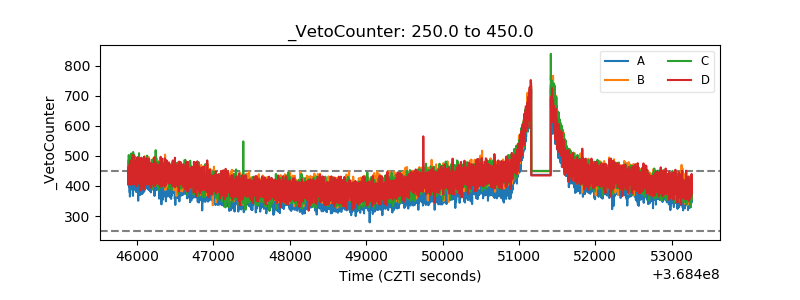 |